Volume 9 Issue 2 pp. 137-149 • doi: 10.15627/jd.2022.11
The optimization of louvers shading devices and room orientation under three different sky conditions
Rendy Perdana Khidmat,a,b Hiroatsu Fukuda,c Beta Paramita,d,* M. Donny Koerniawan,e Kustianif
Author affiliations
a Doctoral program, Graduate School of Environmental Engineering, The University of Kitakyushu, Japan
b Architecture Study Program, Department of Infrastructure and Regional Technology, Institut Teknologi Sumatera, Indonesia
c Department of Architecture, Faculty of Environmental Engineering, The University of Kitakyushu, Japan
d Architecture Study Program, Faculty of Technology and Vocational Education, Universitas Pendidikan Indonesia, Indonesia
e School of Architecture, Planning, and Policy Development, Bandung Institute of Technology, Jalan Ganesha 10, Bandung 40132, Indonesia
f Department of Architecture, Faculty of Engineering, Bandar Lampung University, Lampung, Indonesia
*Corresponding author.
rendy.perdana@ar.itera.ac.id (R. P. Khidmat)
fukuda@kitakyu-u.ac.jp (H. Fukuda)
betaparamita@upi.edu (B. Paramita)
mdkoerniawan@gmail.com (M. D. Koerniawan)
kustiani.tia@ubl.ac.id (Kustiani)
History: Received 14 April 2022 | Revised 22 July 2022 | Accepted 9 August 2022 | Published online 17 August 2022
Copyright: © 2022 The Author(s). Published by solarlits.com. This is an open access article under the CC BY license (http://creativecommons.org/licenses/by/4.0/).
Citation: Rendy Perdana Khidmat, Hiroatsu Fukuda, Beta Paramita, M. Donny Koerniawan, Kustiani, The optimization of louvers shading devices and room orientation under three different sky conditions, Journal of Daylighting 9 (2022) 137-149. https://dx.doi.org/10.15627/jd.2022.11
Figures and tables
Abstract
This paper presents parametric and multi-objective optimization (MOO) approach in optimizing daylight and energy consumption by incorporating louvres shading devices depicting three different sky conditions: Birmingham, UK, Jakarta, Indonesia, and Sydney, Australia. The study aims to observe the best louvre design configuration for each given context. The proposed optimization system iterates the logic of the louvre shading device as the dynamic design parameters such as overhang, blade size, spacing, and blade rotation, together with the room orientation to achieve maximum useful daylight illuminance (UDI) and the shading aperture while simultaneously reduces energy consumption. A total of 8509 simulations for three cities have been run and distributed for the purpose of this research. The results of MOO stated an improvement in UDI for Birmingham, Jakarta, and Sydney of 80%, 146.26%, and 79.48%, and cooling energy consumption of 28%, 3.26%, and 2.99% respectively.
Keywords
Daylight, Parametric design, Louver shading, Energy consumption
Nomenclature
| MOO | Multi-objective optimization |
| UDI | Useful daylight illuminance |
| COP26 | Conference of The Parties |
| EU | European Union |
| DA | Daylight autonomy |
| AUDI | Adjusted useful daylight illuminance |
| BM | Baseline model |
| THERM | Software for heat transfer analysis |
| JMP | Read Jump is a statistical analysis software |
| CIE | Commission Internationale de l'Éclairage |
| EPW | EnergyPlus Weather |
| EP | Energyplus |
| RAD | Radiance |
| HypE | Hypervolume-Based many-objective optimization |
| FF | Fitness function |
1. Introduction
The COP26 summit that held recently in Glasgow, Scotland, reminds an alarming situation regarding the world's rapid temperature rise and the target of establishing zero carbon society in 2050 was emphasized. In the EU, buildings account for 40% of total energy consumption and 36% of total greenhouse emissions [1] while cities consume nearly 70% of the world’s energy and are responsible for more than 70% of global greenhouse gas emissions [2]. Besides the issues of carbon produced by industries, engineers are required to be able to think creatively in dealing with climate change. In architecture, the call for low environmental impact building design and construction has become a necessity.
Façade and shading systems have evolved into major building features that play an important role in passive design strategies, as well as in addressing comfort and energy-related efficiency concerns. Louver or slats [3] have become a popular shade because of their availability and aesthetic. The future applications of louvers vary from static or fixed [4,5] to dynamic and self-shaping [6]. Many research engineers use louver shading to improve daylight performance and energy efficiency. In a range of research, Eltaweel et al. conducted research incorporating a parametric approach to see the implication of multi-variate axis of louver shading systems in different settings and contexts [7–10]. By investigating sunray reflection through the slat’s orientation and angle, the studies prove that the proposed methodology leads to an improved daylight distribution and a reduction in energy consumption. Lee et al. [11] investigated how different shading types, such as vertical louver, horizontal louver, eggcrate louver, overhang, vertical slat, and light shelf, is impacting daylight autonomy (DA) and useful daylight illuminance (UDI) of a high-school classroom in Incheon, South Korea. Iterating parameters of count, depth, and direction with a total number of 200 variations for each shading type, the results showed a meaningful difference in the use of two different daylight metrics with different shading types and orientation and concluded that UDI explains daylight performance relatively well. Grobman et al. [12] presented an assessment and comparison of the static and kinetic external shading elements on a dynamic measurement. Parametrically, louver shading in a simulated office was operated to achieve optimal adjusted useful daylight illuminance (AUDI) in a Mediterranean climate. The conducted research resulted in the dynamically adjusted louver performing better than the fixed or seasonally adjusted mode one with an increase in AUDI by up to 51%.
A digital movement in design has been shifting the way designers and architects think. Through digitalization, complex mathematical calculations required by the design criteria can be addressed. Deploying the ability to read and process large amounts of data in a relatively short time, automatic design exploration nowadays become possible. So-called parametric design approaches design intention through setting up its dynamic parameters. Despite its association with extraordinary and ambitious geometry, this approach has the potential to generate and explore design variations that can further assist non-experts in collecting sufficient information-related design [13]. When the iteration and automation are conducted to gather information about the building's performance, a huge amount of design feedback concerning its performance can be obtained to observe the design beyond the designer’s imagination. Besides, multi-objective optimization (MOO) has recently become an approach in the built environment [14,15] to see the genetical trade-off between design objectives. One of the benefits of its use is that it reduces the negative impact on the environment where the building is constructed, for example, by lowering carbon emissions from energy consumption related to cooling and heating loads, comfort sensations that affect people's health [16], and urban heat island phenomena [17]. Using such a technique, the environmental awareness design optimization process will be more robust, opening the possibility for a discovery in design efficiency.
While a development in computational tools offers the potential for approaching environmental performance through building performance simulation, and a number of research incorporates it in conducting shading-related daylight and energy simulations, a generative optimization intention while investigating and comparing different sky conditions and analysis periods is still limited. Thus, this paper presents a generative approach in investigating daylight and energy efficiency and seeing the possibility of optimization during the early design stage of a virtually designated office through the parametric process and multi-objective optimization, simulated in three different sky conditions and analysis periods, which are Birmingham, UK [7], Jakarta, Indonesia, and Sydney, Australia, aiming to answer the questions of whether the proposed approach can produce optimization and what the best design solution and its parameters that can balance the daylight, view to the outside, and energy consumption objectives.
2. Research methodology
2.1. General insight
The study was entirely conducted using virtual model and platform using a parametrical approach [18,19]. Figure 1 presents the workflow of the conducted research. The initial phase started by defining the metrics for the objectives. Geometry preparation, environmental and energy simulation was established by arranging the definition of the office model, dynamic louvers configuration, daylight simulation definition set, and the energy simulation definition set. In the environmental simulation definition making, the weather data of targeted city was applied. During the genetic MOO process, the single results will be trained to be filtered and to yield pareto front individual solutions. The obtained pareto front solutions will further be ranked using fitness function calculation and compared to the baseline model (BM) without shading.
Figure 1
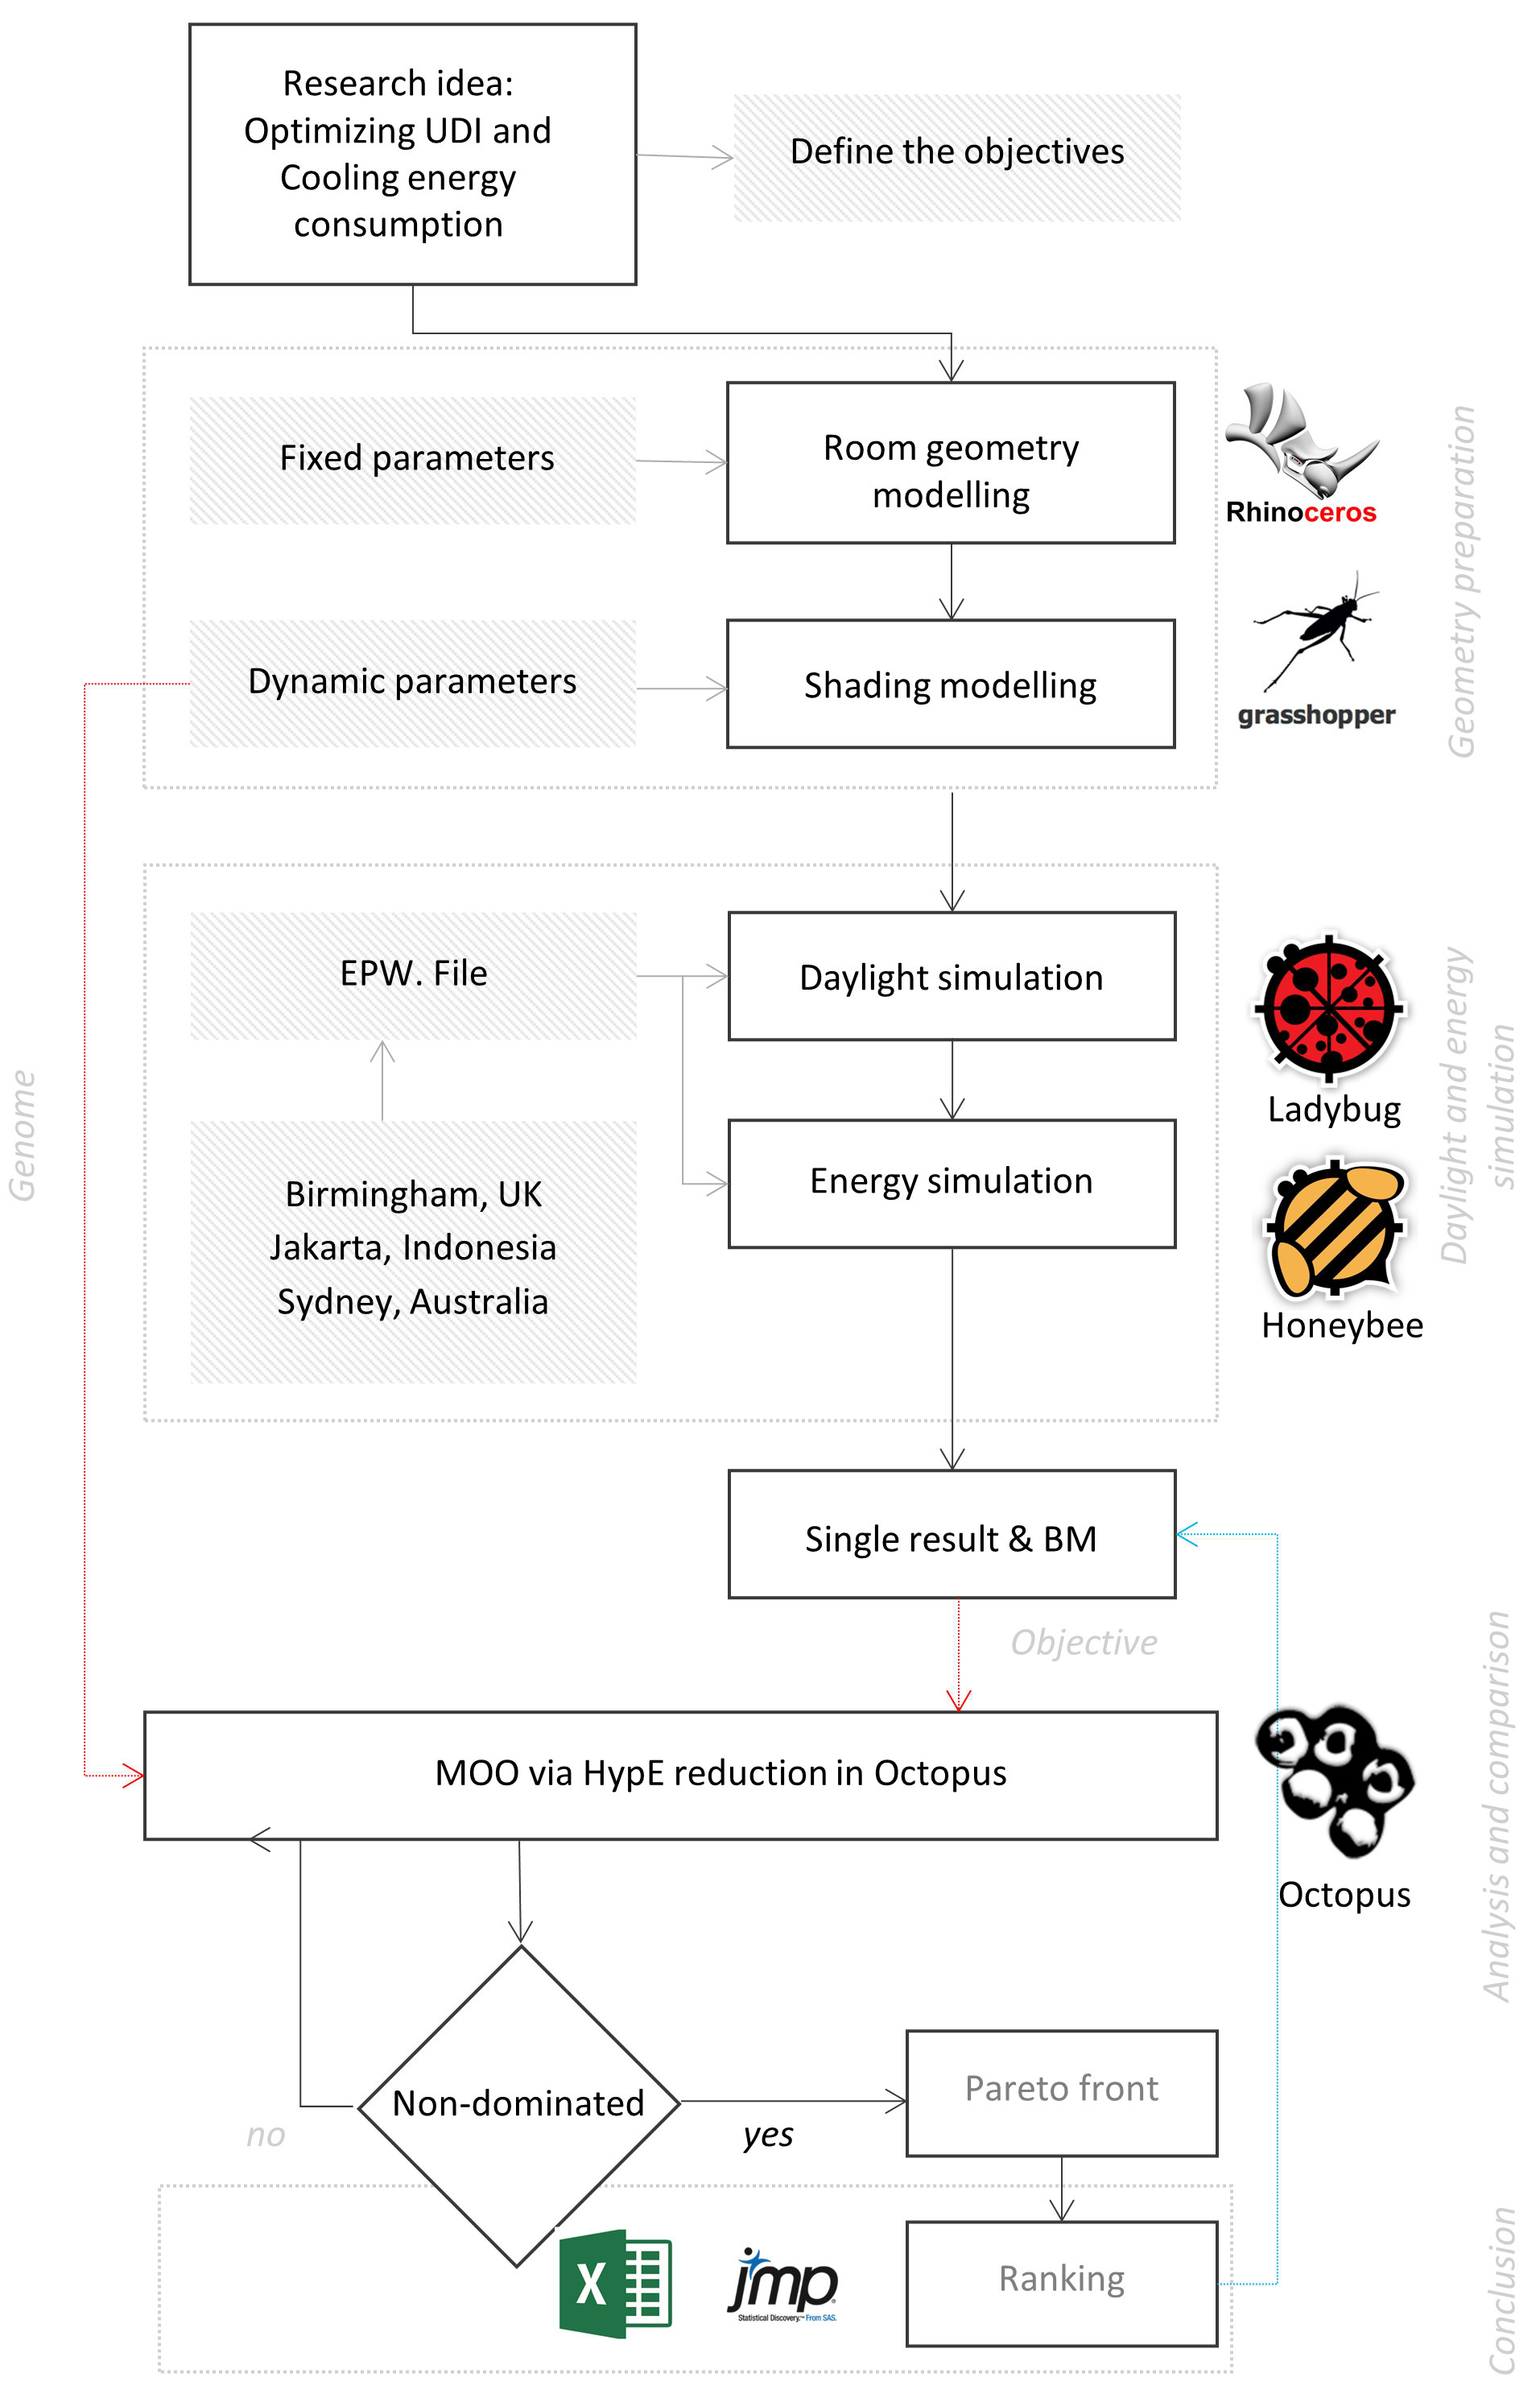
Fig. 1. Research workflow.
Rhinoceros and Grasshopper [20] are the main platform in modelling, simulation phase, and optimization phases. Ladybug and Honeybee [21] are the plugin bridging the well-known simulation engine such as THERM, Radiance, EnergyPlus, OpenStudio, and Daysim. While for the optimization, the plugin called Octopus [22] has been used. However, for the data collection and design iterator, Colibri from TTtoolbox was incorporated. Several of the tools employed in this study have also been utilized in other investigations, including [18,23,32,33,24–31]. After collecting data on the dynamic parameters and target value, the data was analysed and visualised using Microsoft Excel, the statistical analysis software JMP and Jupiter Notebook, a Python-based platform operated in the Anaconda launcher. The daylight simulation and MOO of the two designated periods were run on a PC with Intel (R) Core (TM) i9-10980XE (36 CPUs) 3.00 GHz (36 CPUs) processors, 128 GB RAM and GPU NVIDIA GeForce RTX 3090 90 GB integrated RAMDAC, running in Windows 10 Pro 64-Bit platform.
2.2. Geometry modelling
As for UDI and cooling energy consumption data collection, a 12 m x 8 m x 3.5 m hypothetical office room has been virtually developed. The room dimension adopted based on the consideration of the common structural grid of used for office room. The virtual office room model equipped with fixed opening size of 50% glazing ratio. The shading as a main feature has four dynamic parameters as a logic of louver shading device namely overhang, spacing, blade size, blade rotation, and the additional parameters of rotation angle the room orientation, illustrated in Fig. 2. The multiplication factor presented in Table 1 is set to limit the number of solutions during the generation process and to avoid unusual or random parameter changes that can cause an error or difficult observation toward the overall generation results. Thus, it keeps the value range of the parameters in control and with prevalent dimension. Each parameter was set to have a variation between its minimum and maximum value, assumed to be close to the commercial louver type that available in the market. However, the form-finding opens the possibility to make the configuration custom depending on how the optimization process answer each given specific sky context. The parameters such as blade rotation and orientation were divided and multiplied by a multifaction or division factor to avoid uncontrolled and clashing iterations during the iteration processes. Besides, the strategy to divide the value was to limit the number of possible design solutions, saving time on optimization. The detailed dynamic parameters are presented in Table 1.
Table 1
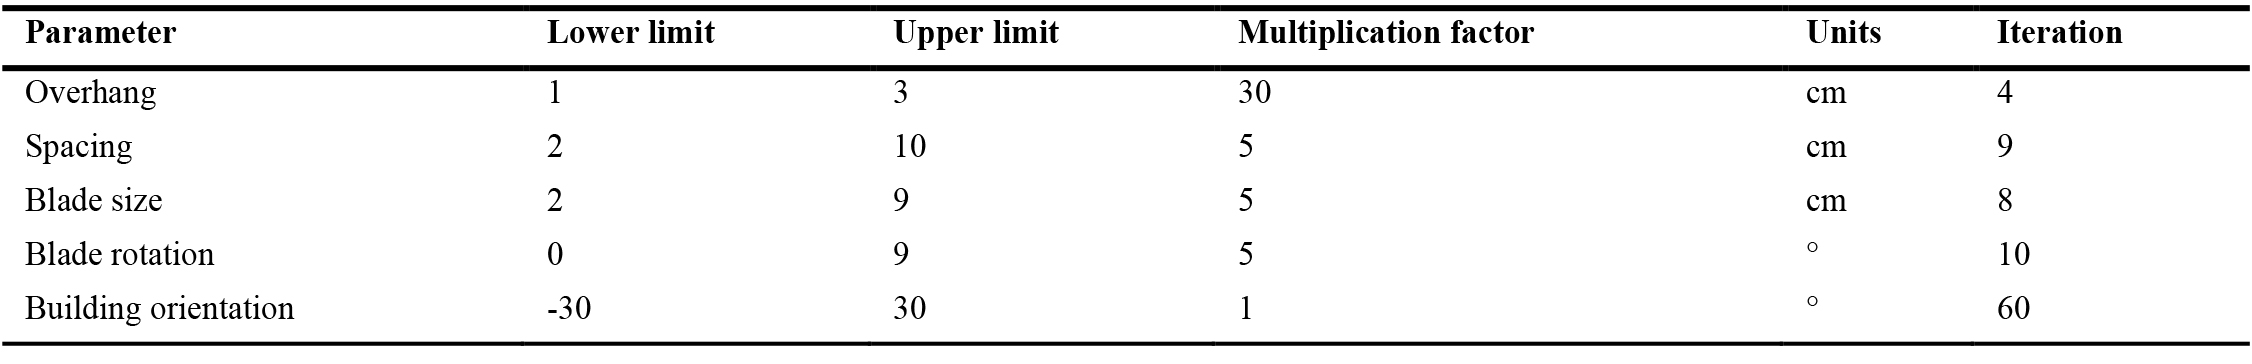
Table 1. Dynamic parameter setting.
Figure 2
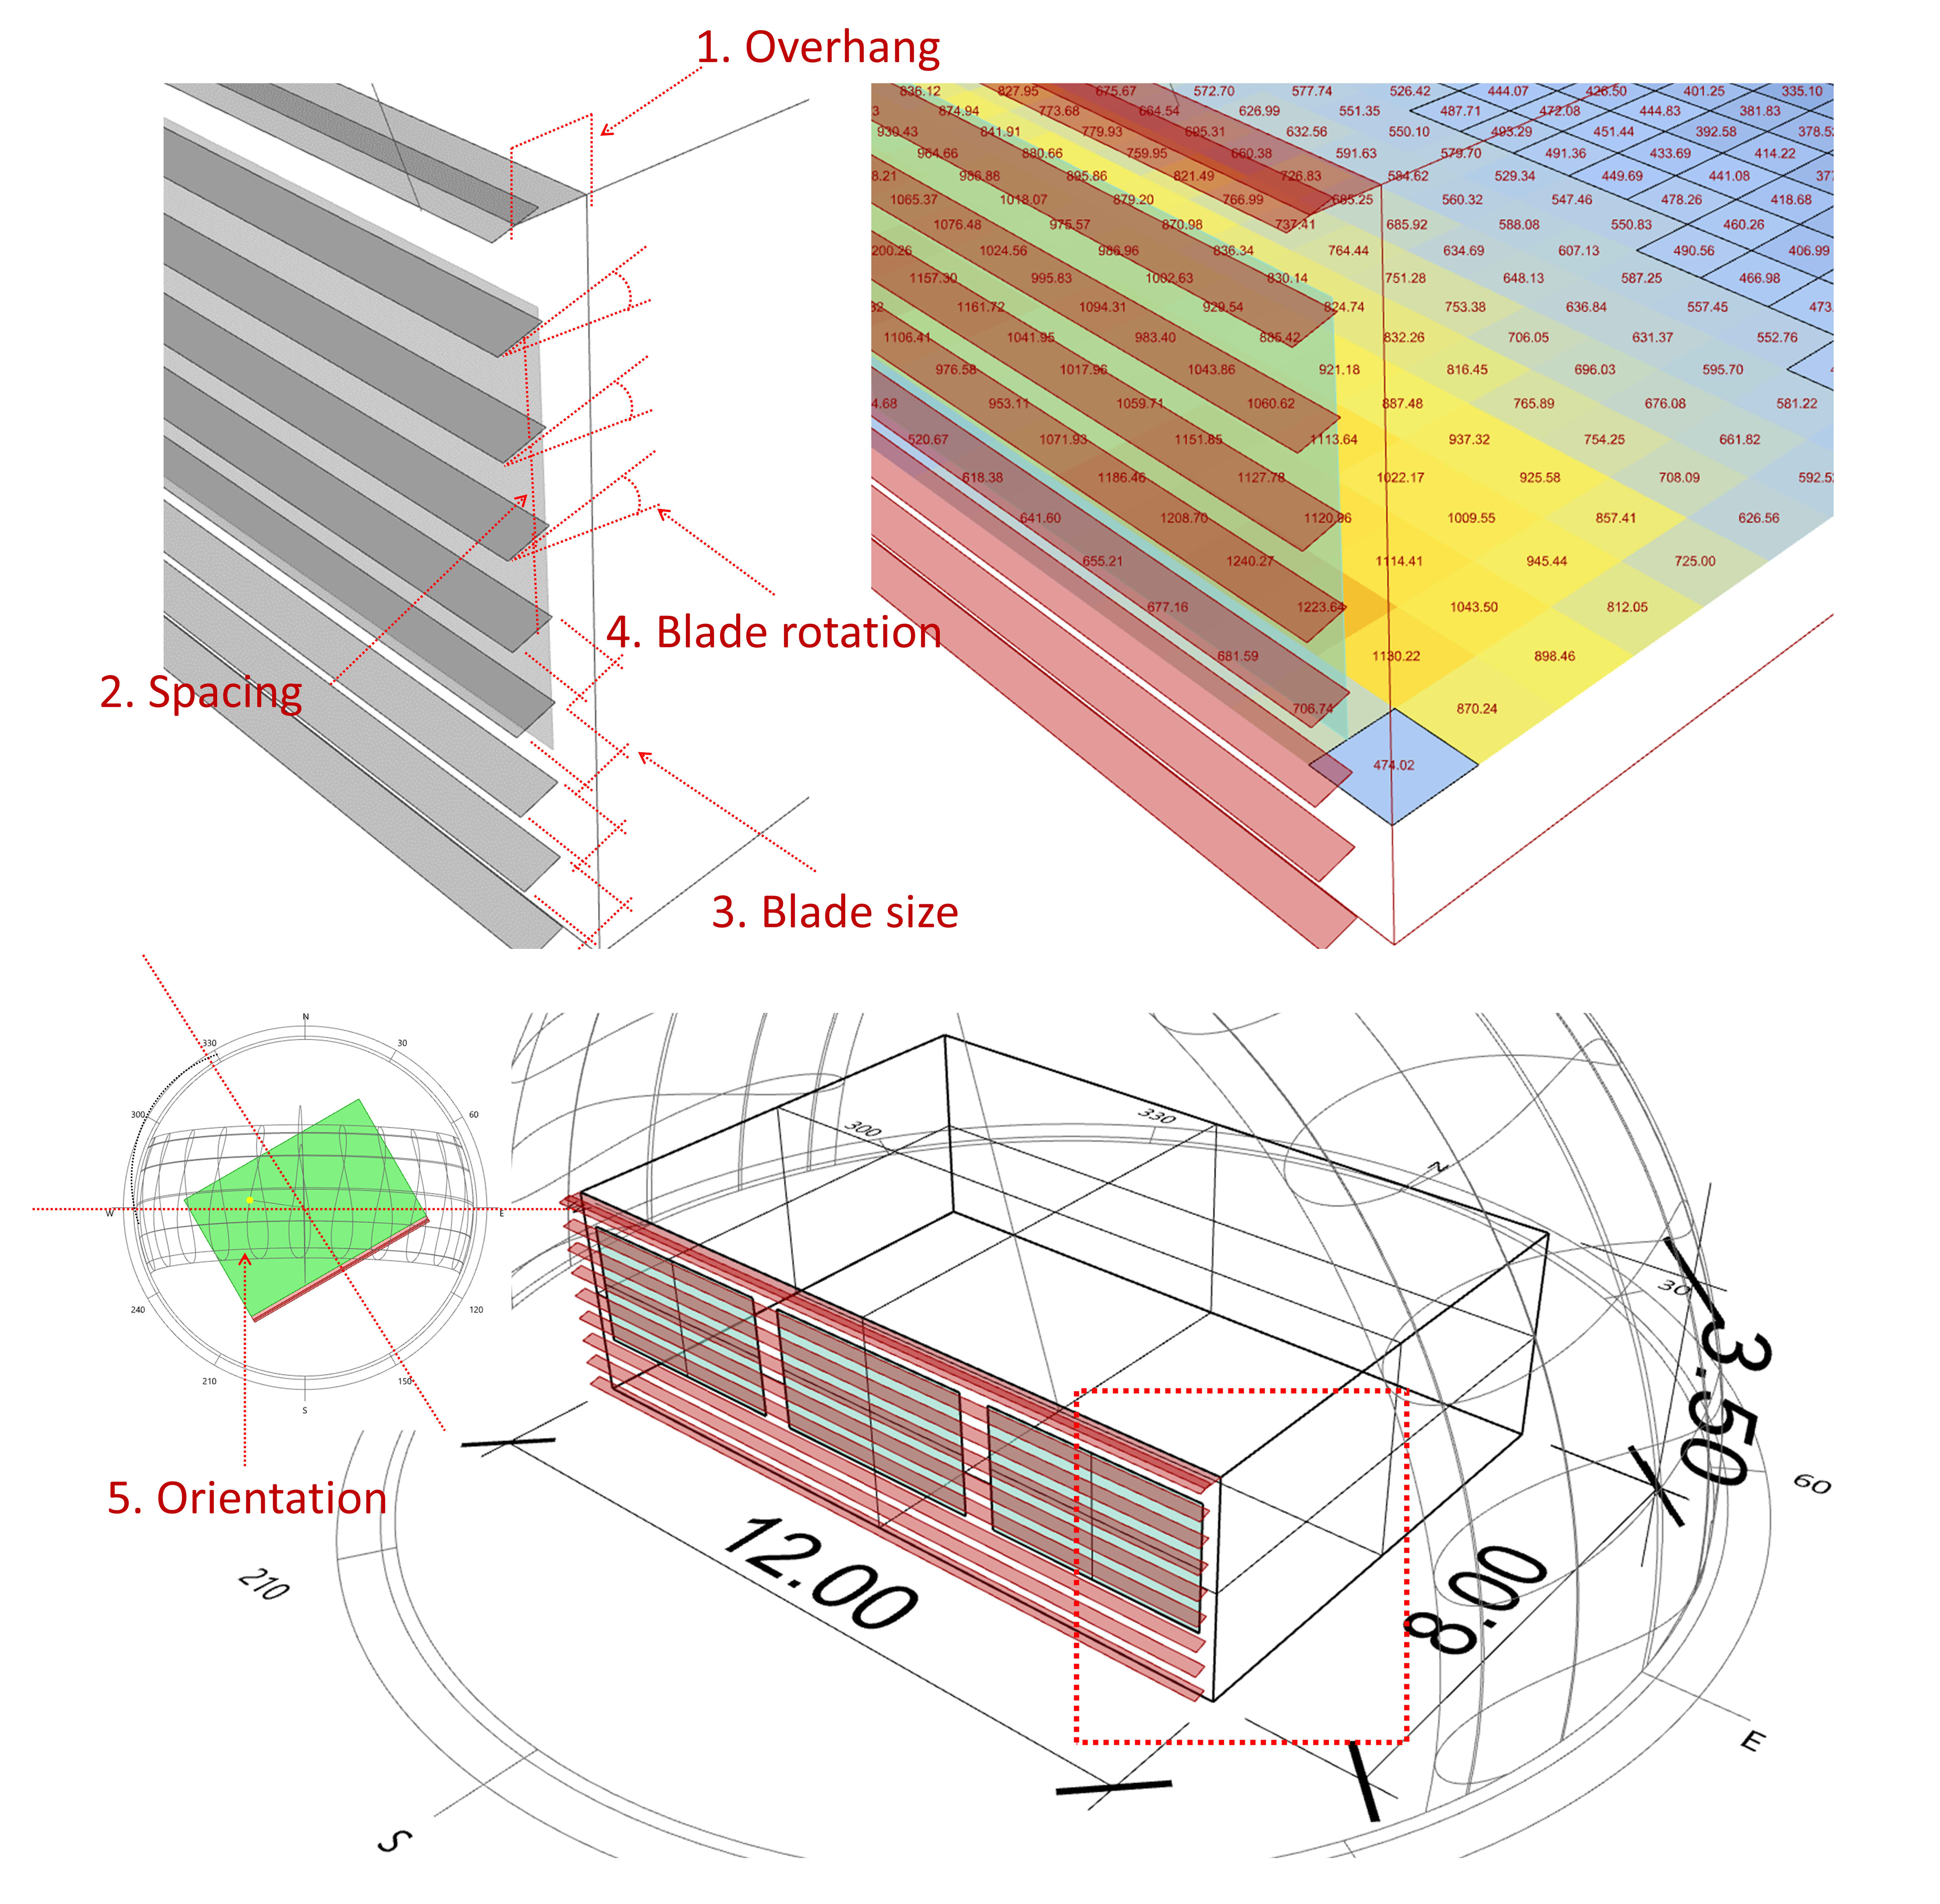
Fig. 2. Dynamic parameters of the louver shading and the room orientation.
2.3. Context and simulation period
The weather data for each city is supplied by using the EnergyPlus Weather File, or EPW File. Regarding the combination objective of energy (cooling energy consumption) and daylight (UDI), the analysis period taken was decided to be the hottest area based on the weather forecast engine online [34] following the extreme hot week that was taken for the analysis period in the energy simulation. The designated date and the sun position are illustrated in Fig. 3. To generate sky conditions, the component Honeybee Generate standard CIE sky with the input of sunny without sun has been used to match the analysis period that designated day in Fig. 4. As for the energy simulation, the extreme hot week from each city has been extracted from the EPW statFile. The following period includes Birmingham was set to be August 8 to August 23, Jakarta, April 23 to April 29, and Sydney, February 2 to February 18.
Figure 3
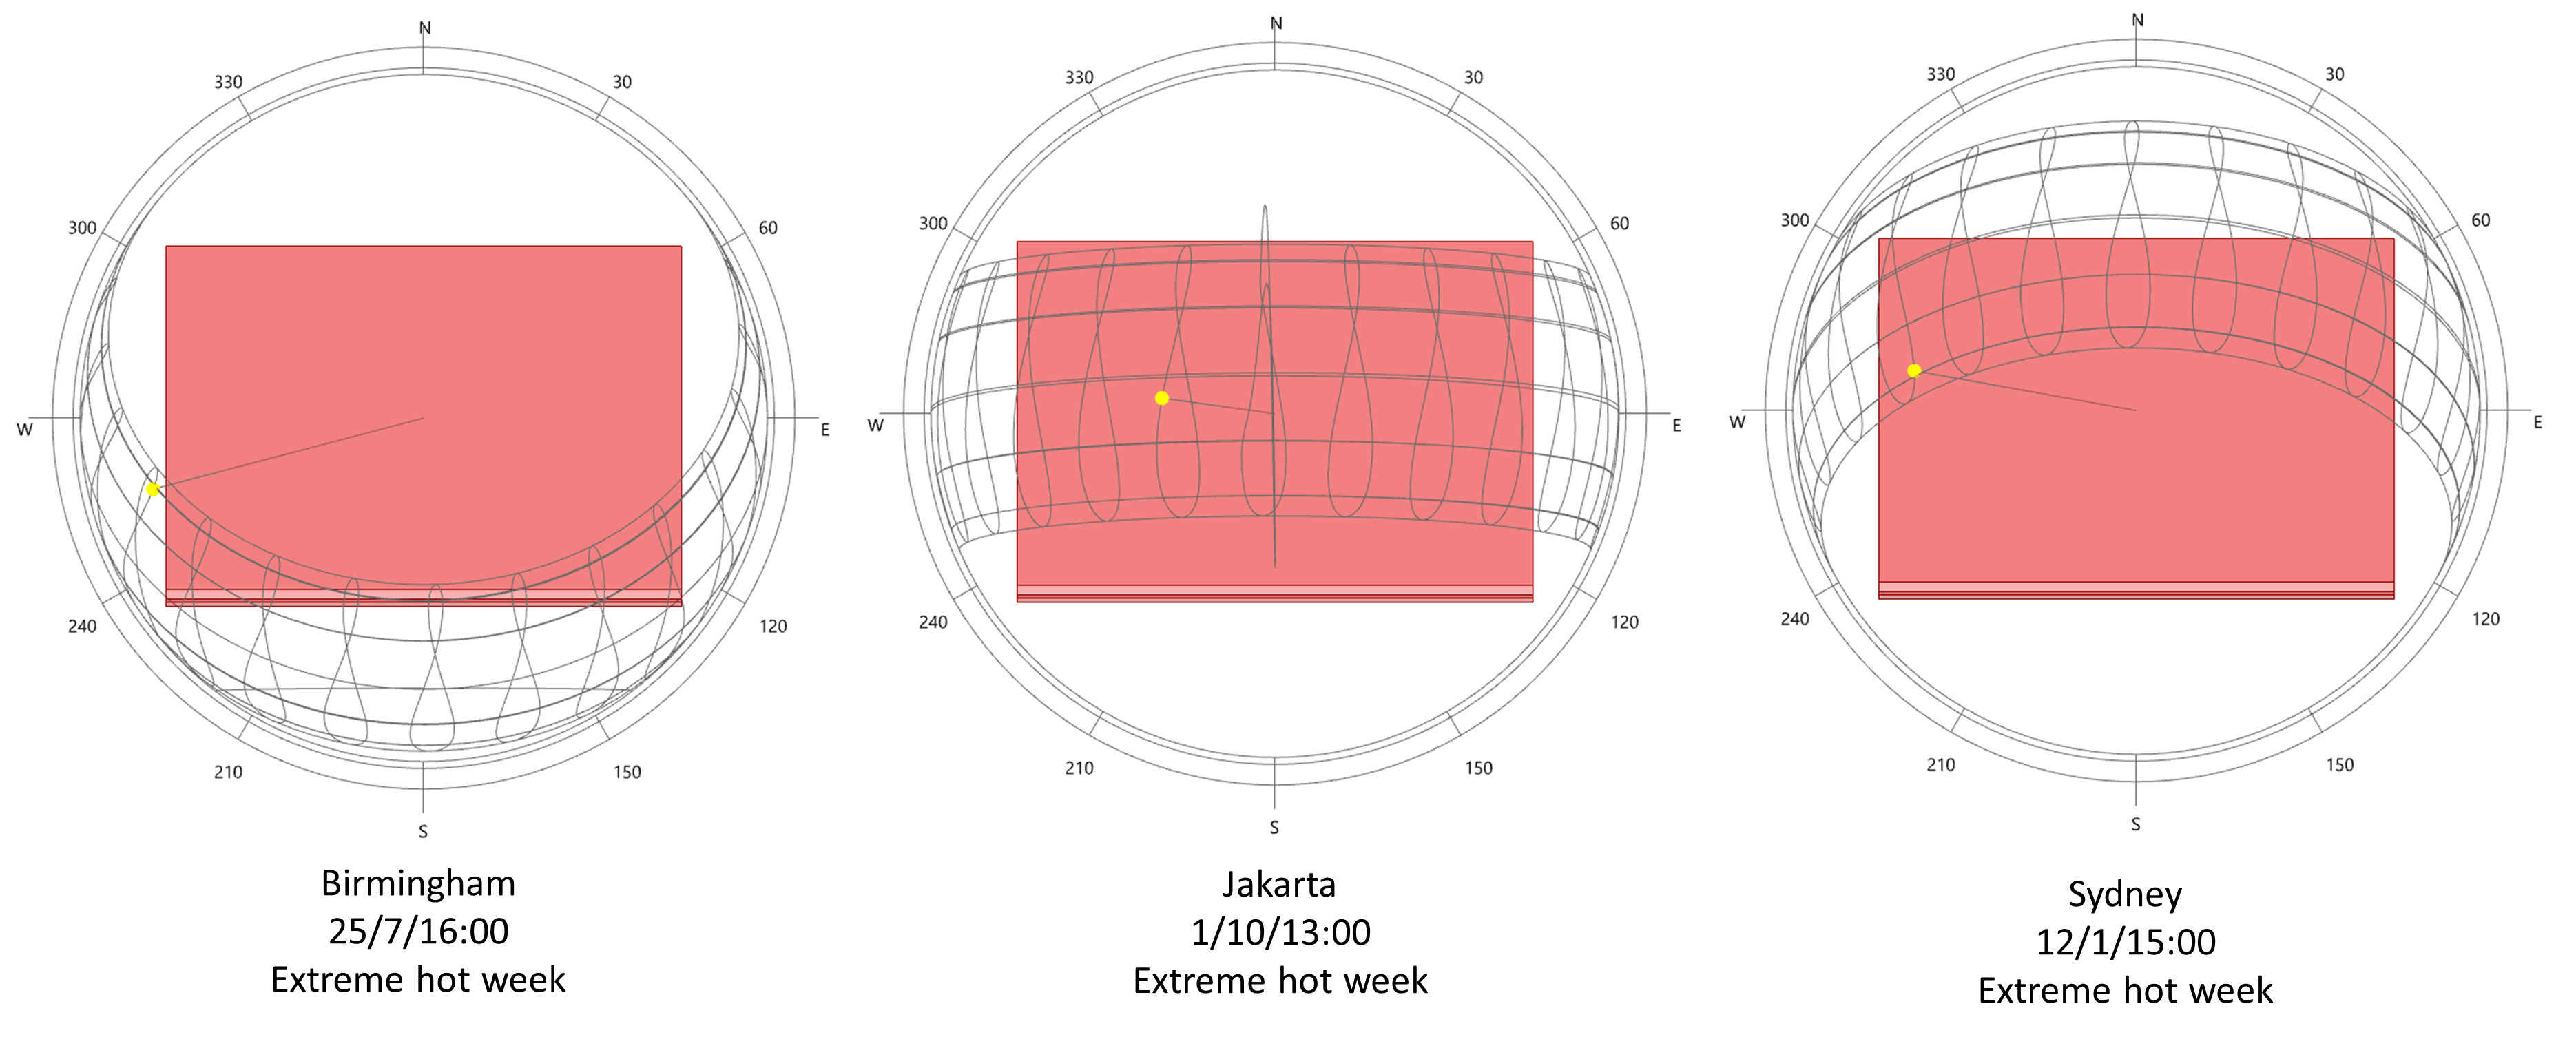
Fig. 3. Sun position and the analysis period of each city.
Figure 4
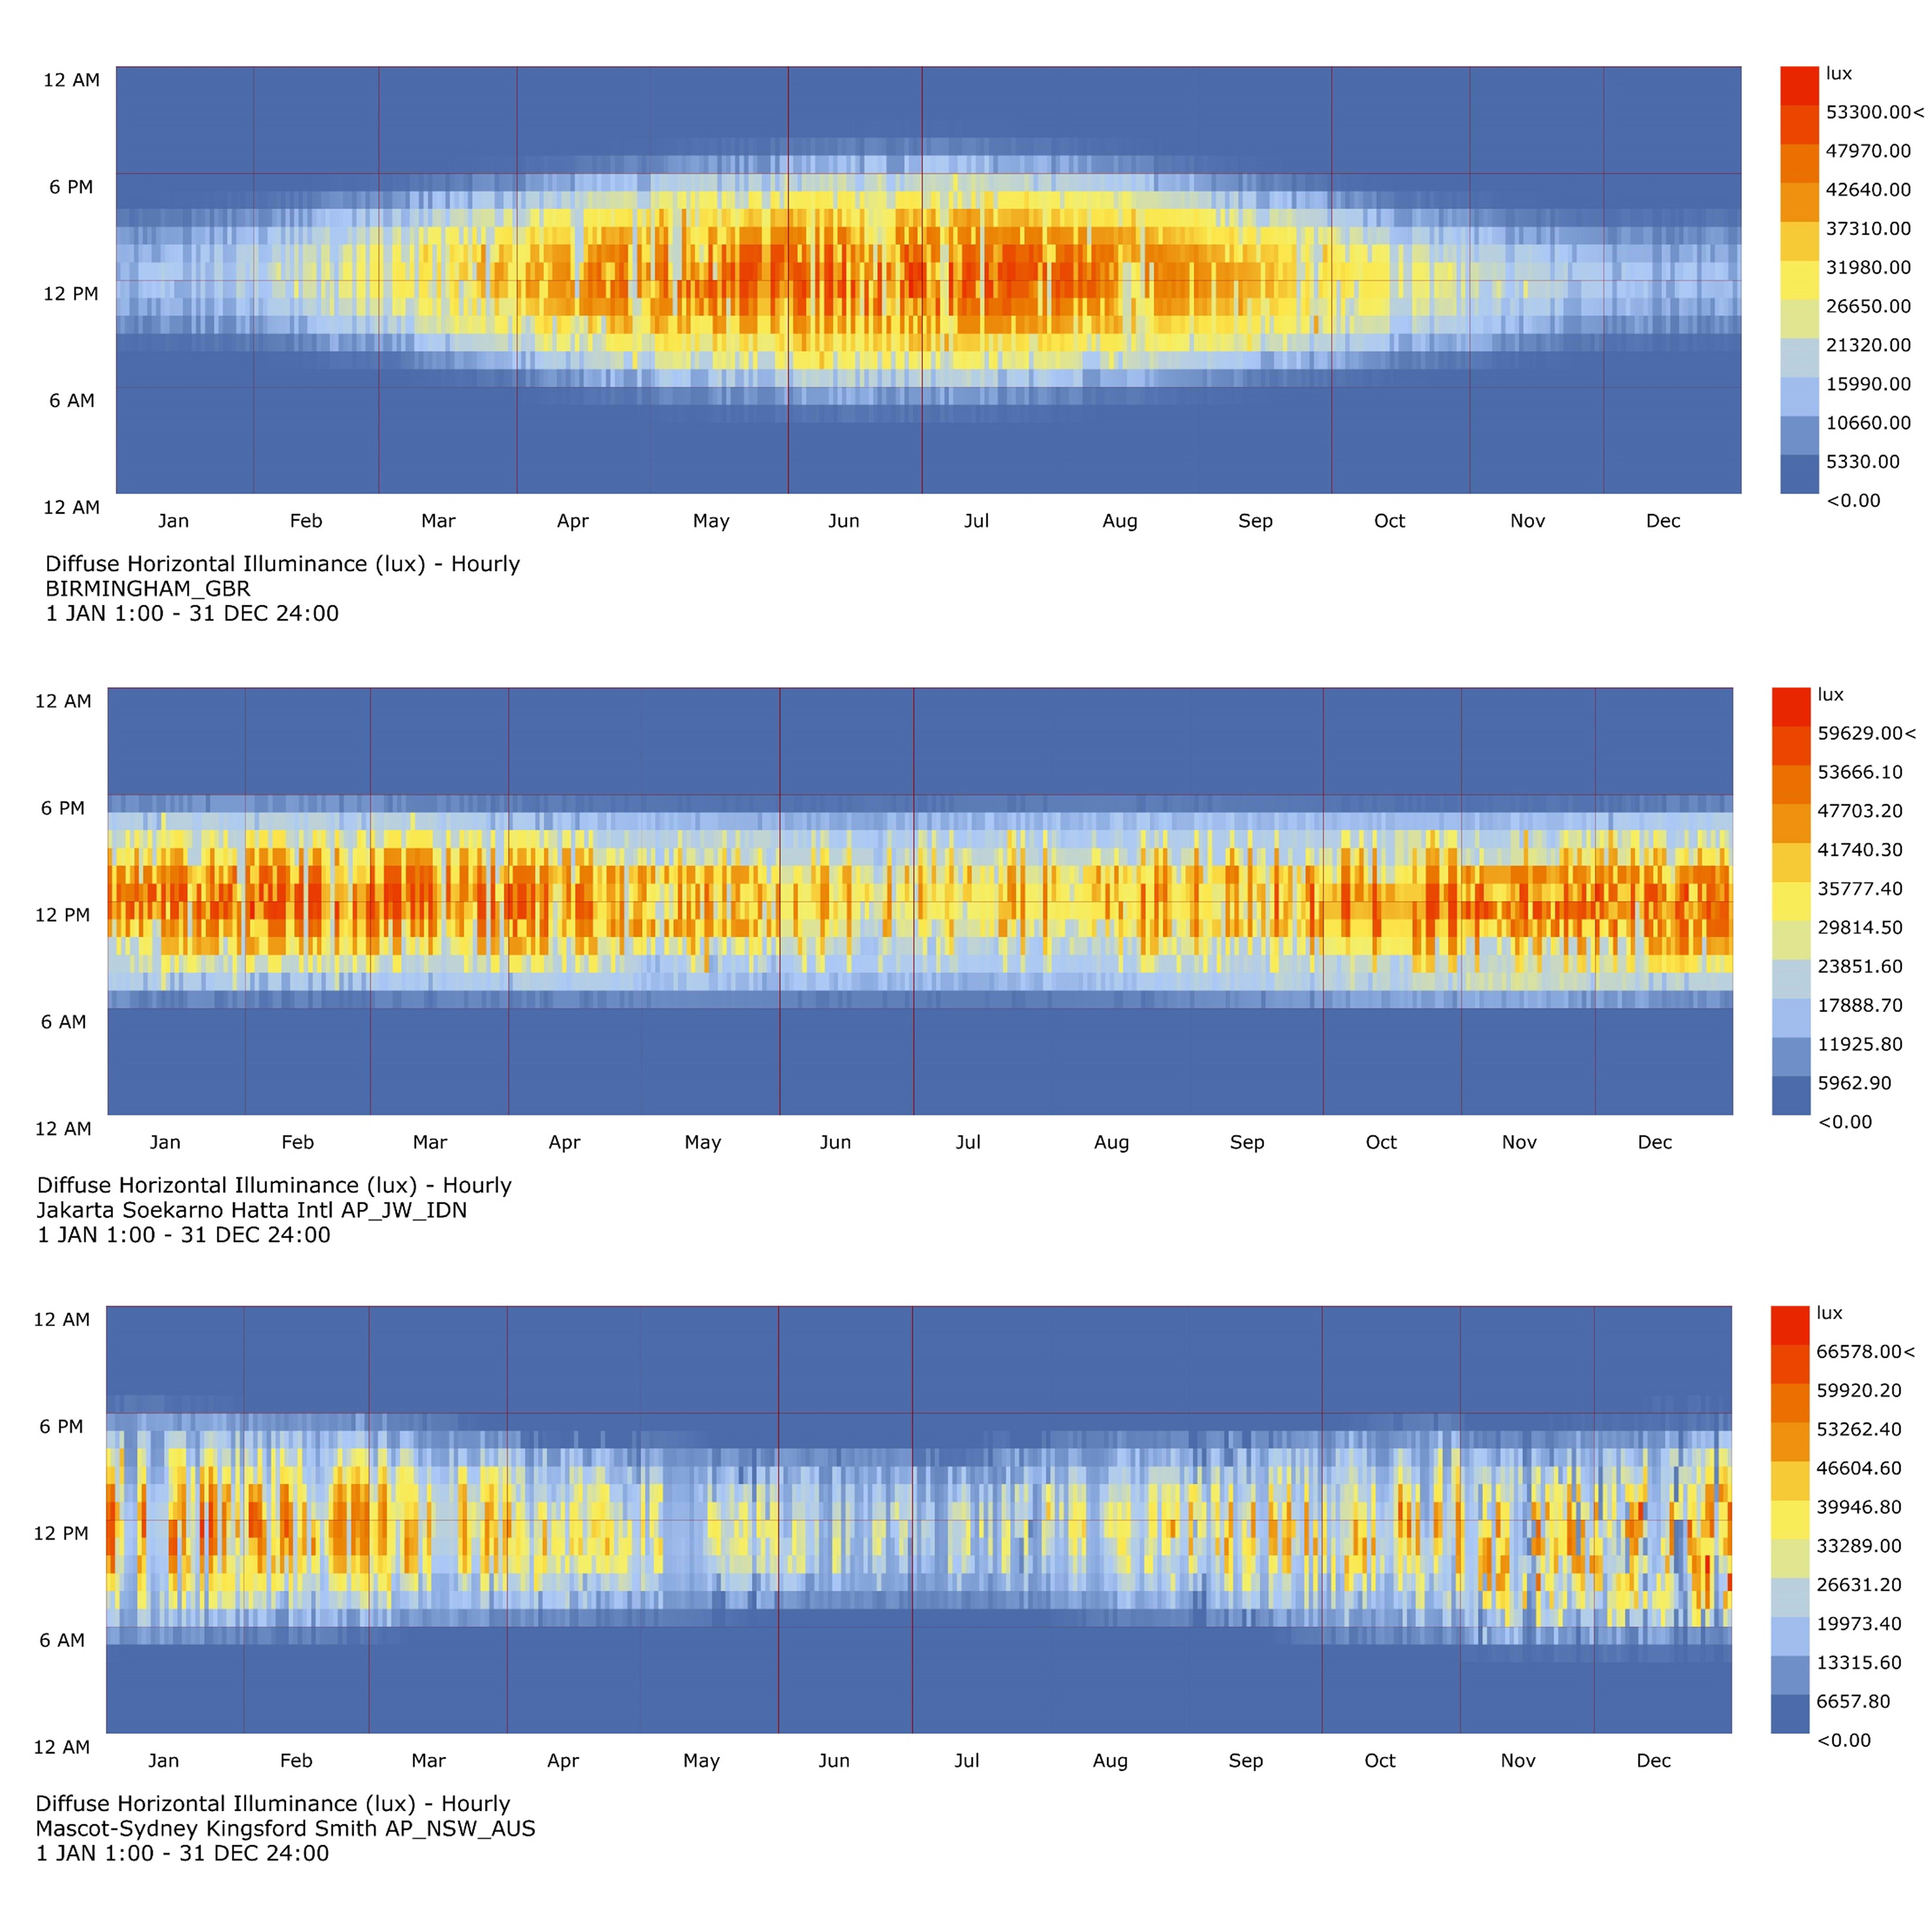
Fig. 4. Diffuse horizontal illuminance of each tested city: (top) Birmingham, (middle) Jakarta, (below) Sydney.
2.4. Daylight and energy simulation
The research considered Useful Daylight Illuminance (UDI) as a daylight metric (lux), the first performance objective. Nabil (2005) first introduced UDI as a new paradigm in assessing daylight in buildings. The UDI can be considered an annual occurrence of illuminance within the range of "useful" as considered by occupants [35,36]. The daylight illuminance of less than 100 lx is generally considered insufficient, 100–500 lx is considered effective, 500–2000 lx is considered desirable or tolerable, and a range of more than 2000 lx is considered exceeding that can lead to visual discomfort [36]. This research only focuses on and calculates the range between 300–500 lx [9]. The total cooling energy consumption (kWh) was the second performance objective. The third objective was a geometry objective in which the shading surface area was assumed to drive the ratio for the view to the outside. For the material of the simulated room, the properties of EnergyPlus (EP) construction and Radiance (RAD) material are presented in Table 2.
Table 2
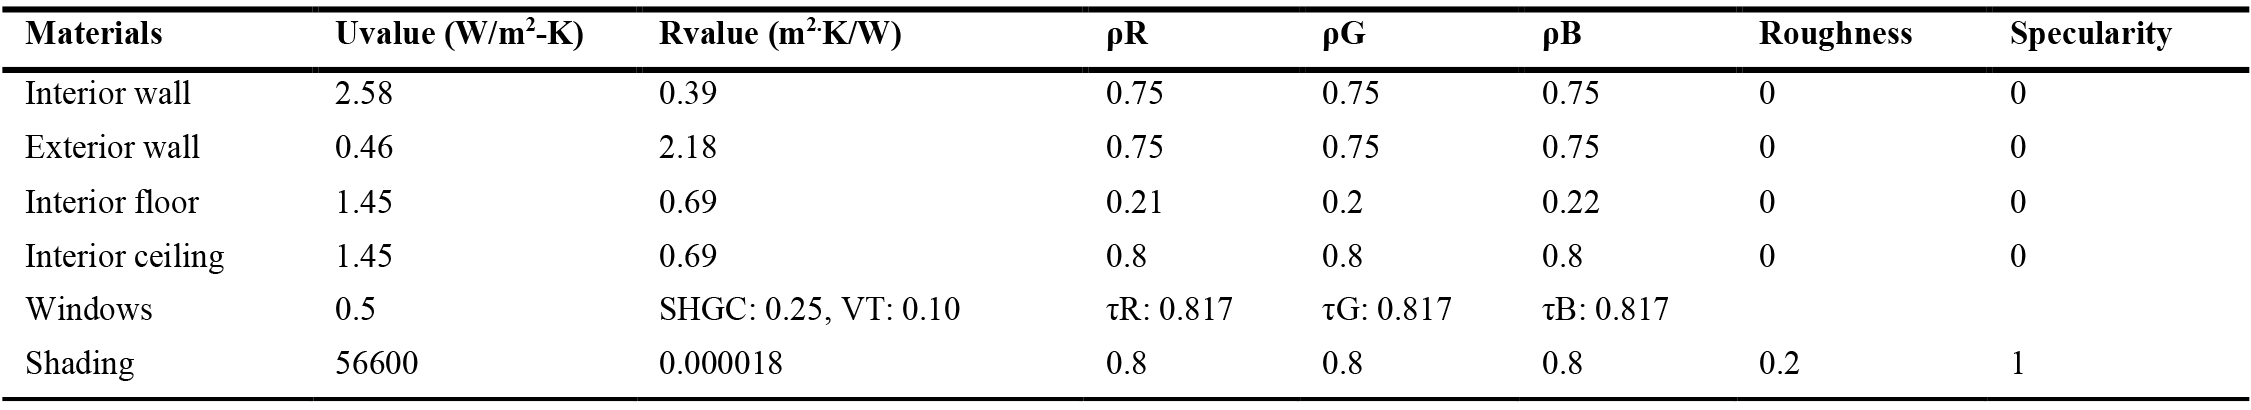
Table 2. EnergyPlus construction and Radiance material.
2.5. Multi-objective optimization (MOO)
When the design targets only a single performance objective, the calculation of optimization will be straightforward. When more than one objective set to be the objectives, the conflicting trade-offs are undeniable. This research uses Octopus, deploying An algorithm for fast hypervolume-based many-objective optimization, HypE reduction [37], to undergo the Multi-Objective Optimization (MOO) processes. The search was intended to combine multiple targets to minimize cooling energy consumption and shade surface area while maximizing UDI of 300 lx to 500 lx. The setting of the octopus is presented in Table 3. The number of generation and population size was set based on the consideration of the time consumed for the optimization process. The greater number of population size and generation is set in this stage, the more possibility the optimization process finds more optimized solutions, as well as the more time is taken for completing the multi-objective optimization process.
Table 3

Table 3. The Octopus optimization setting.
3. Results
3.1. Baseline model and the fitness function solution
A total of 8509 automated simulations have been run for the purpose of this research. The MOO yielded 2594 possible solutions for Birmingham, 2597 possible solutions for Jakarta, and 2598 possible solutions for Sydney. As previously mentioned, a baseline model has been developed for the needs of comparison and observation in efficiency. The baseline model is the room model equipped with no shading device. The baseline model in each case study was set to face the South direction means that, in terms of parameters, all three baseline models have zero-degree rotation angle. The simulations that were carried out for these models took place in the same environmental setting. To visualize, Fig. 5 illustrates the different conditions of the baseline model and the model obtained from the optimization and fitness function calculation process [25]. It can be observed in the figure that the presence of shade and the orientation had an impact on the distribution of the points. Furthermore, the fitness function calculation was applied to the pareto frontier individual yielded from MOO. Table 4 shows the characteristics and aims of various solutions, as well as their relative importance. In the general comparison chapter, each of the results will be discussed in further depth.
Table 4
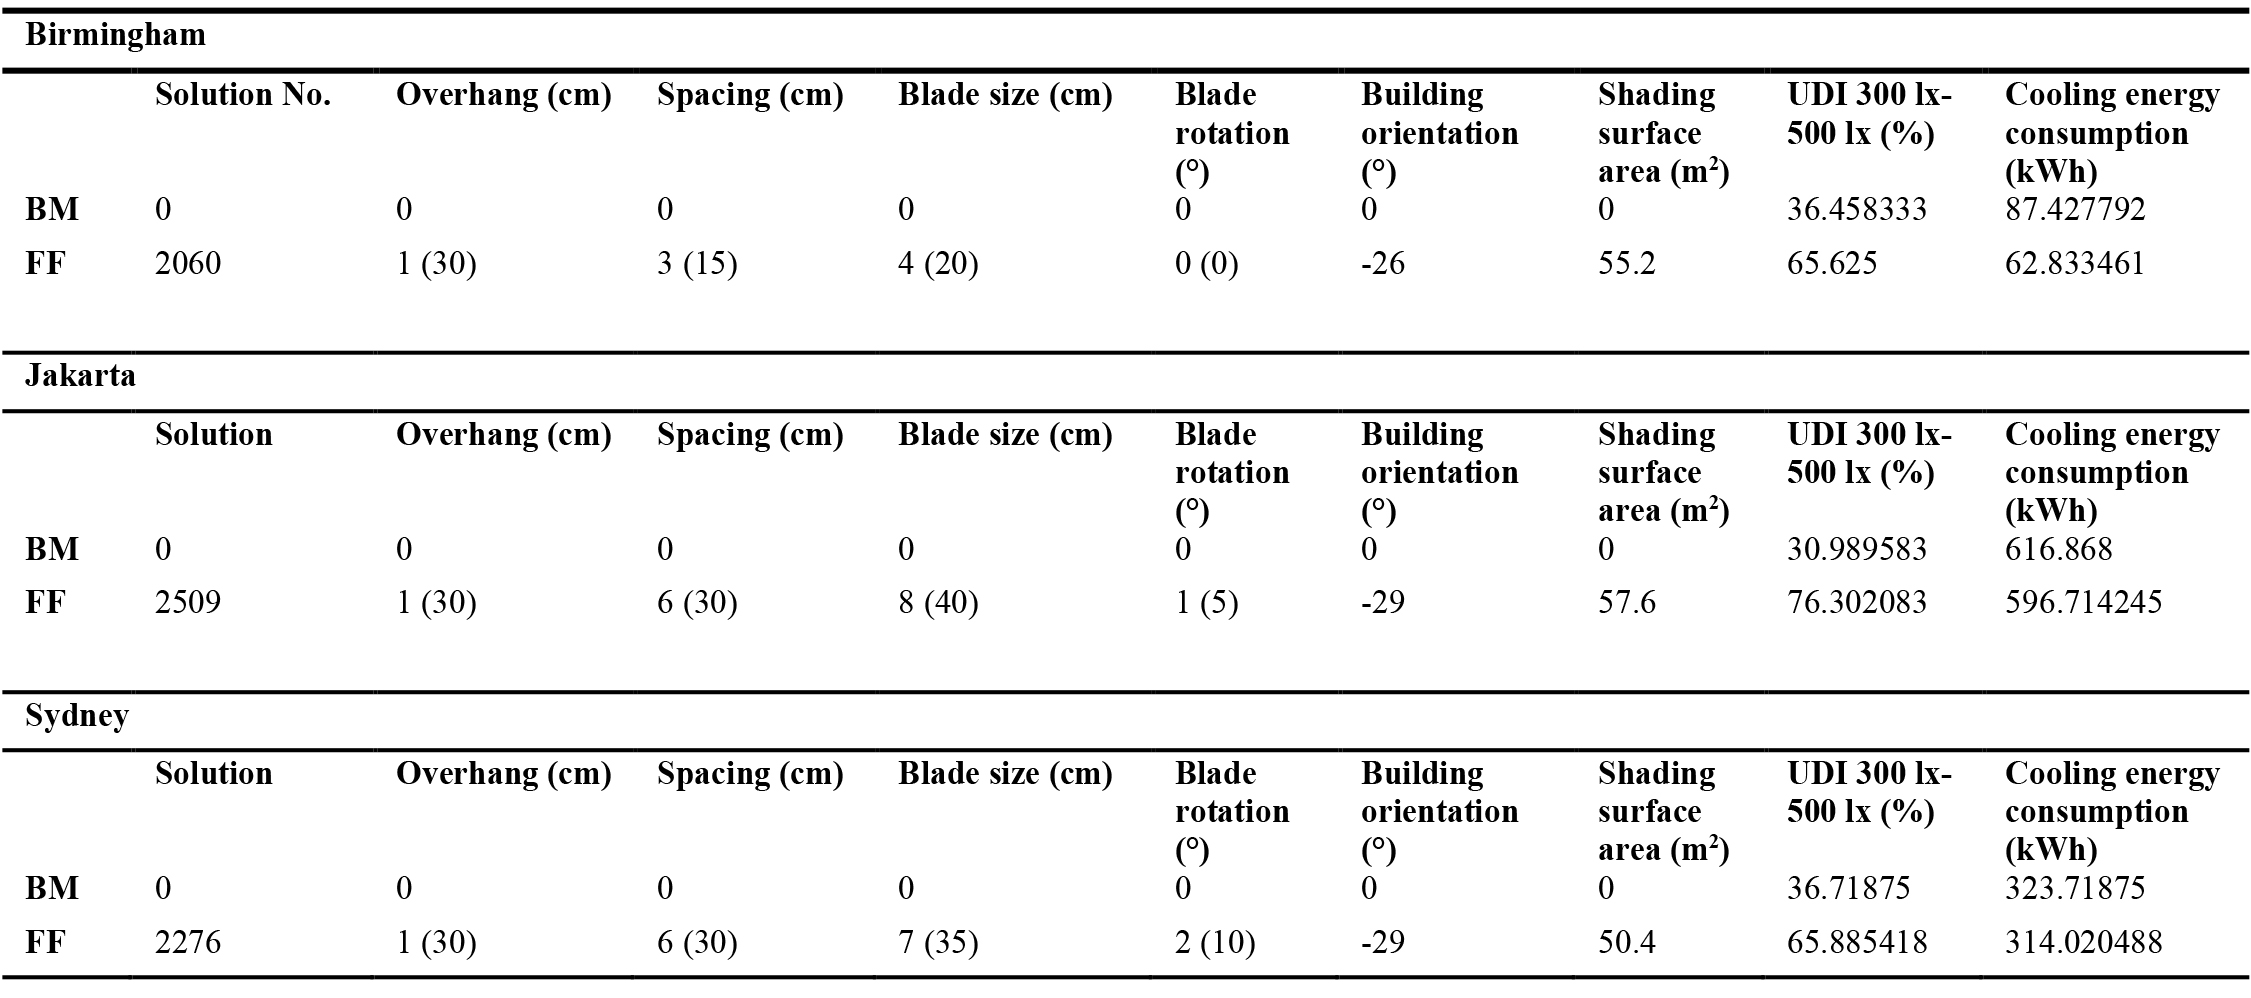
Table 4. The attributes for the best solution based on fitness function calculation.
Figure 5
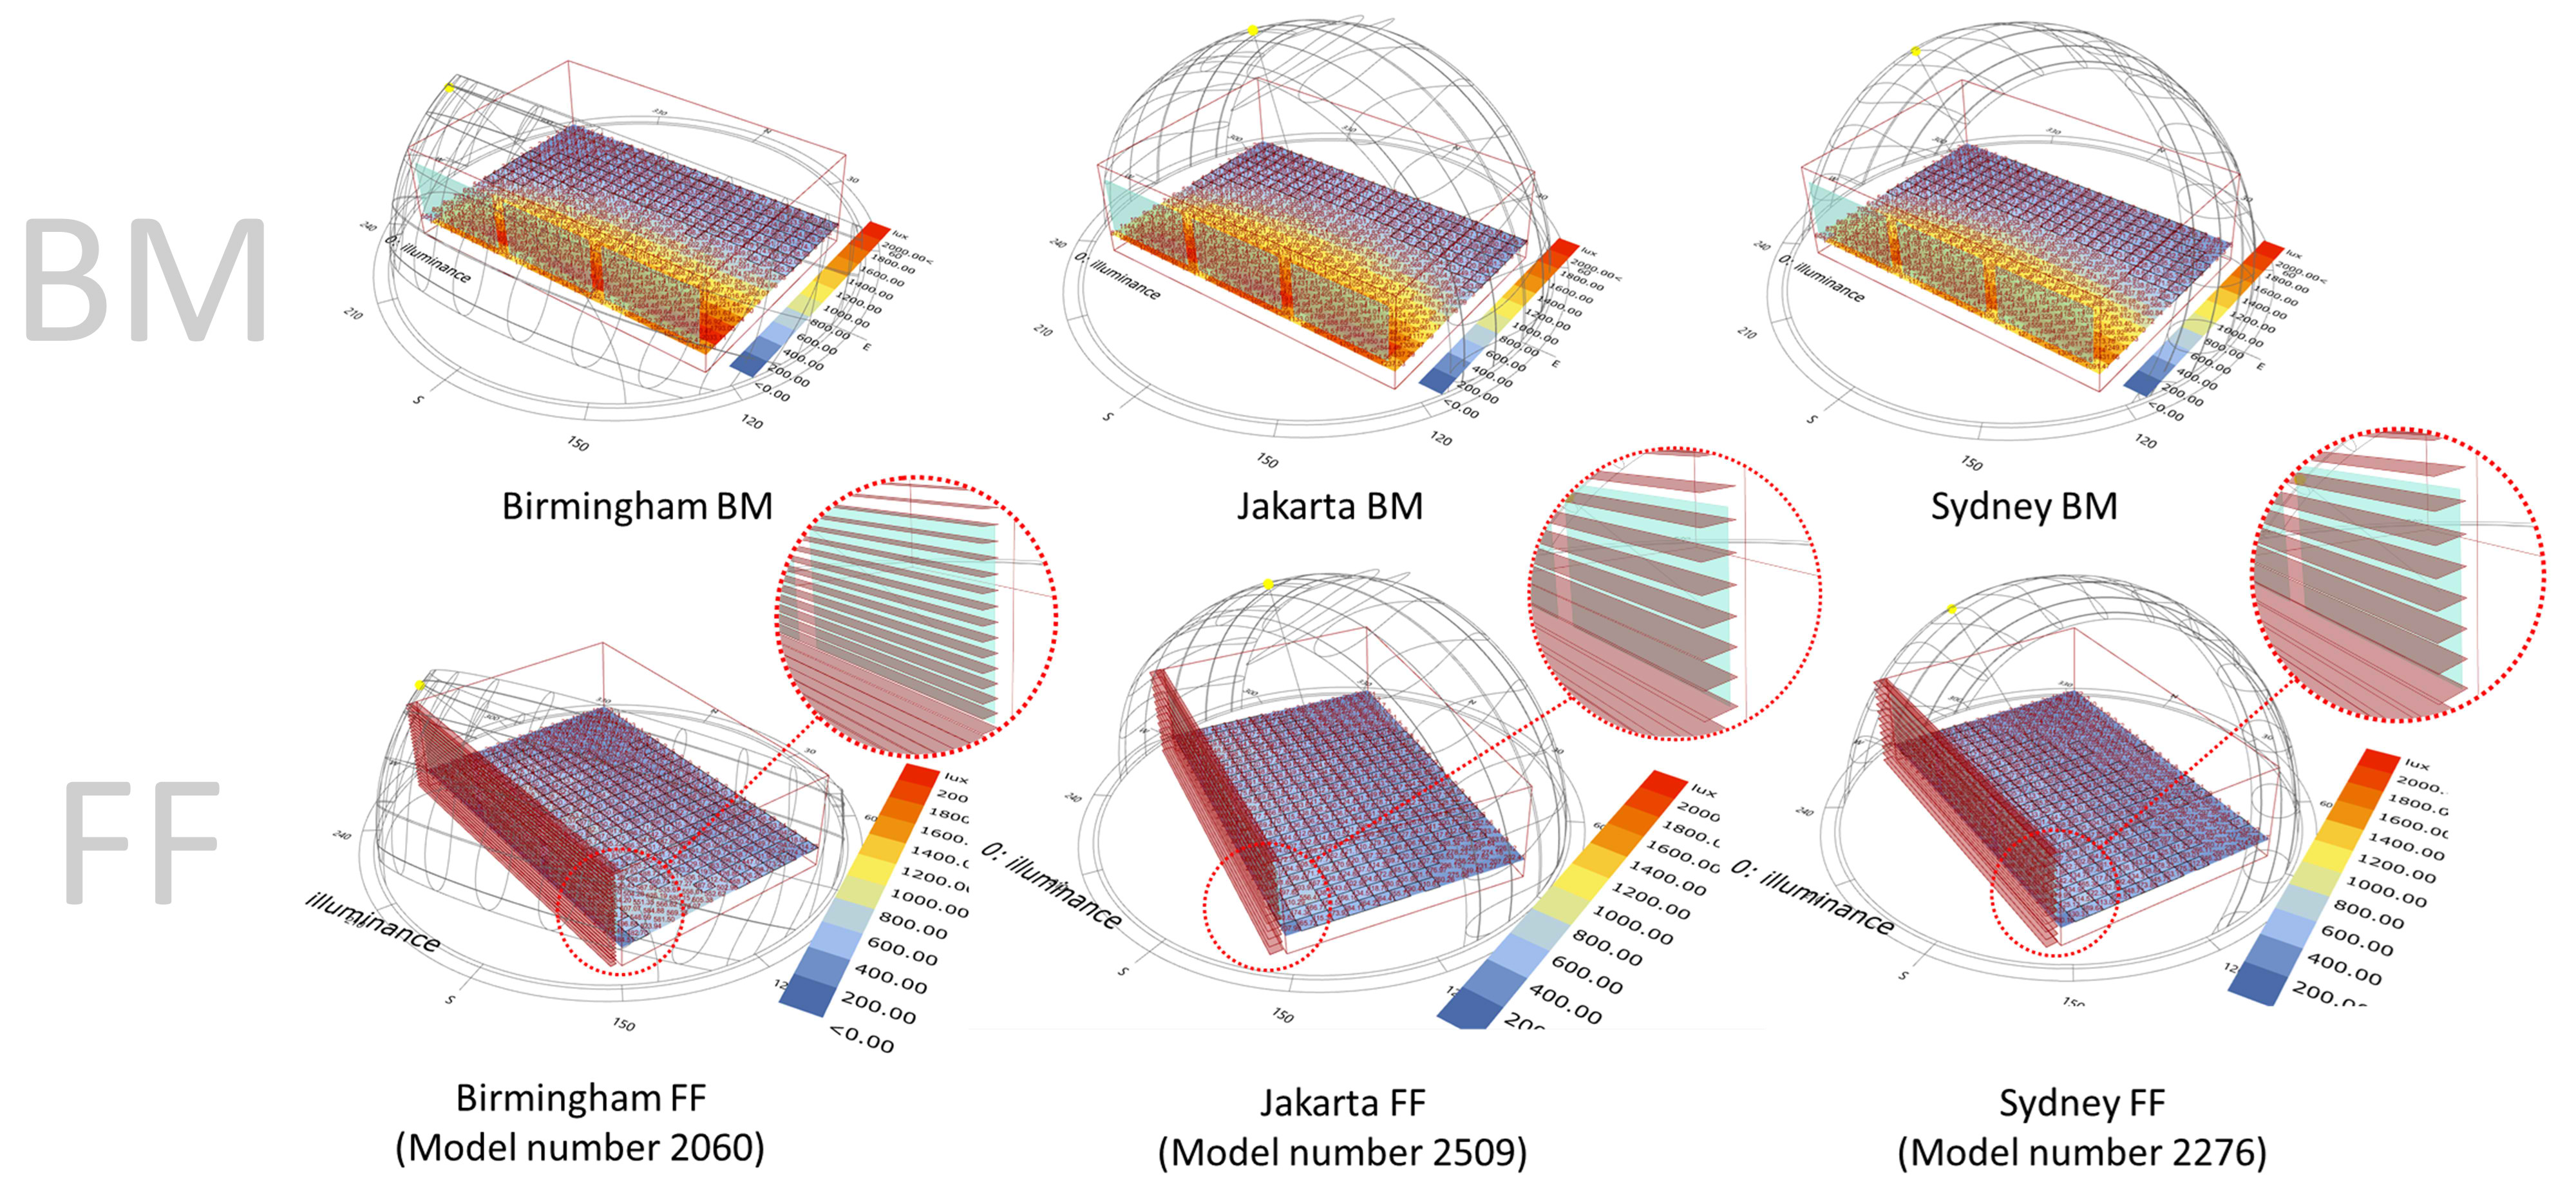
Fig. 5. Baseline model and the solution from fitness function calculation.
Figure 6 shows the four axes population field, which have the axis of the objective cooling energy consumption, UDI 300 lx–500 lx, and the shading surface area represent the view to the outside, populated by the individuals during MOO training. The dots represent the cases of Birmingham, Jakarta, and Sydney. The closest individual to the coordinates 0, 0, 0, as the default setting in Octopus, is the targeted searching area. Table 4 depicts the qualities and goals of different solutions, as well as their relative relevance in the context of the overall problem. Each of the findings will be addressed in further detail in the general comparison chapter. Considering the configuration and pattern of individual distribution, Jakarta and Sydney perform similar pattern, it was possibly because the sun position between the two cities is almost the same in different sets of analysis periods (Figs. 3 and 5).
3.2. Objective’s correlation
The total data was obtained as a result of the optimization procedures (Figs. 6-9). This indicates that throughout the training and weighting processes in MOO, they are influenced by the tendency of their goal target's genetical mating during the training and weighing procedures. As a result, the data utilized in this study may exhibit different trends than data from a study in which all of the parameters are iterated. It has been decided to use a scatter plot in order to examine the distribution between two design objectives.
Figure 6
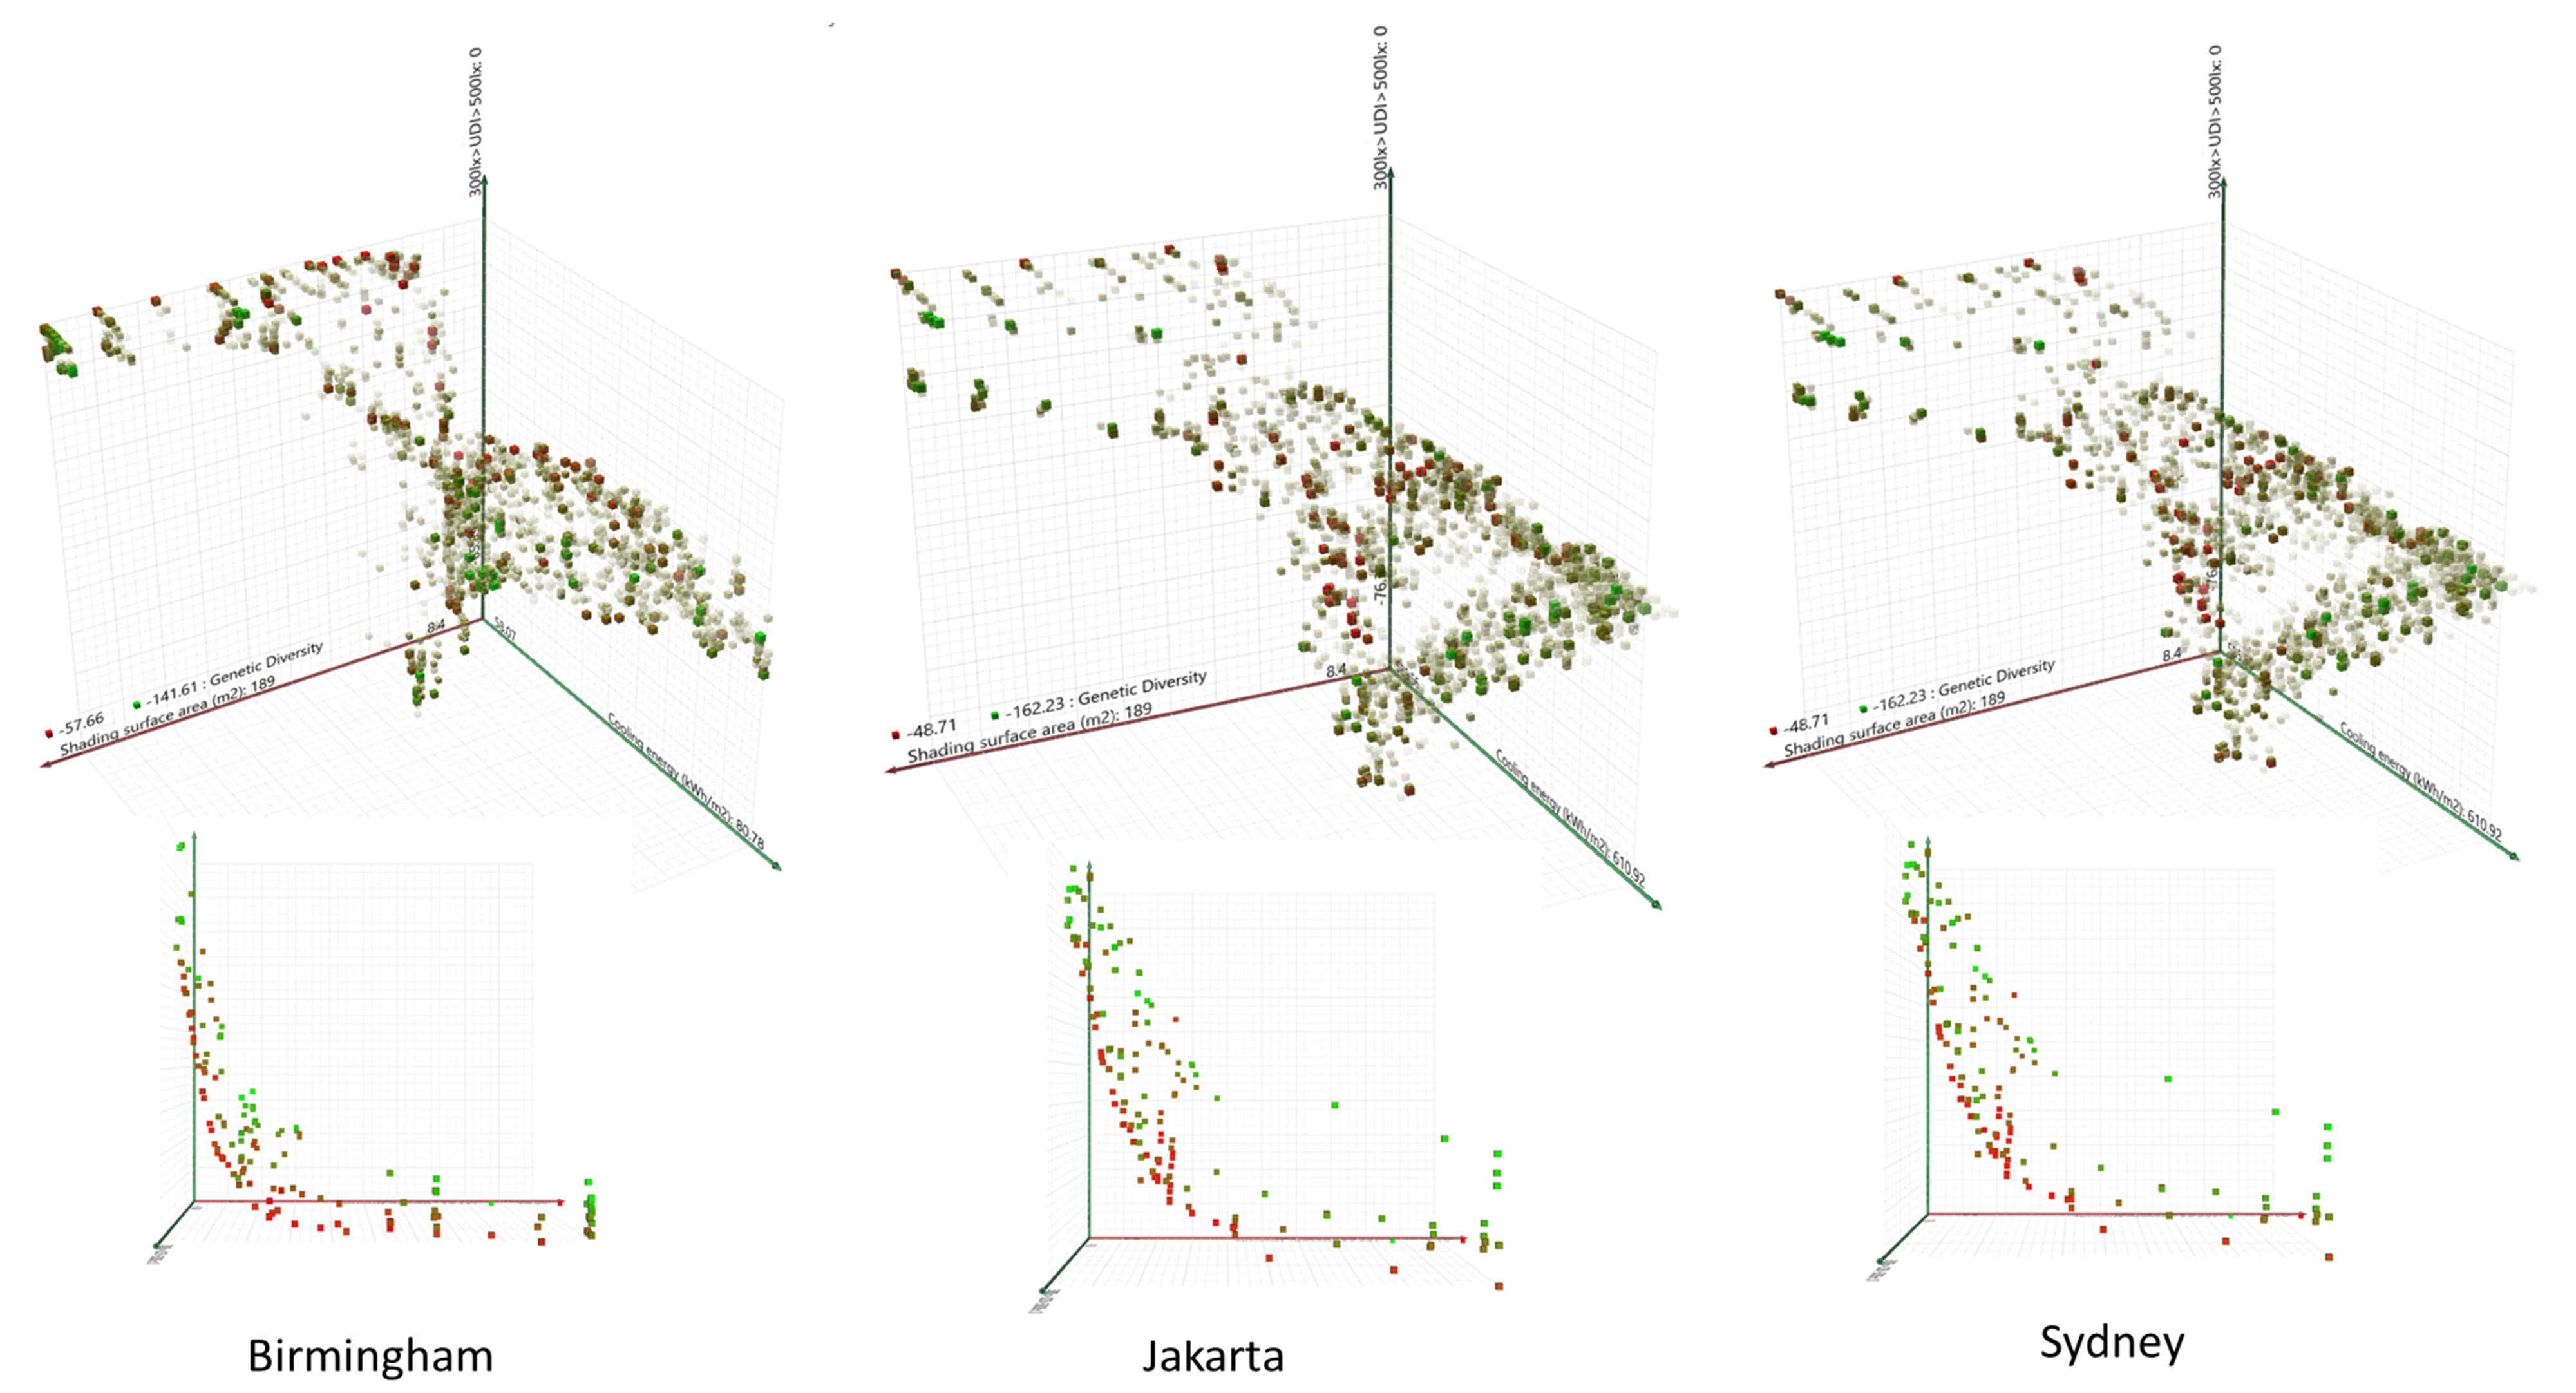
Fig. 6. Original population field of the optimization results.
Figure 7

Fig. 7. Scatterplot presenting correlation between two objectives of Birmingham.
Figure 8
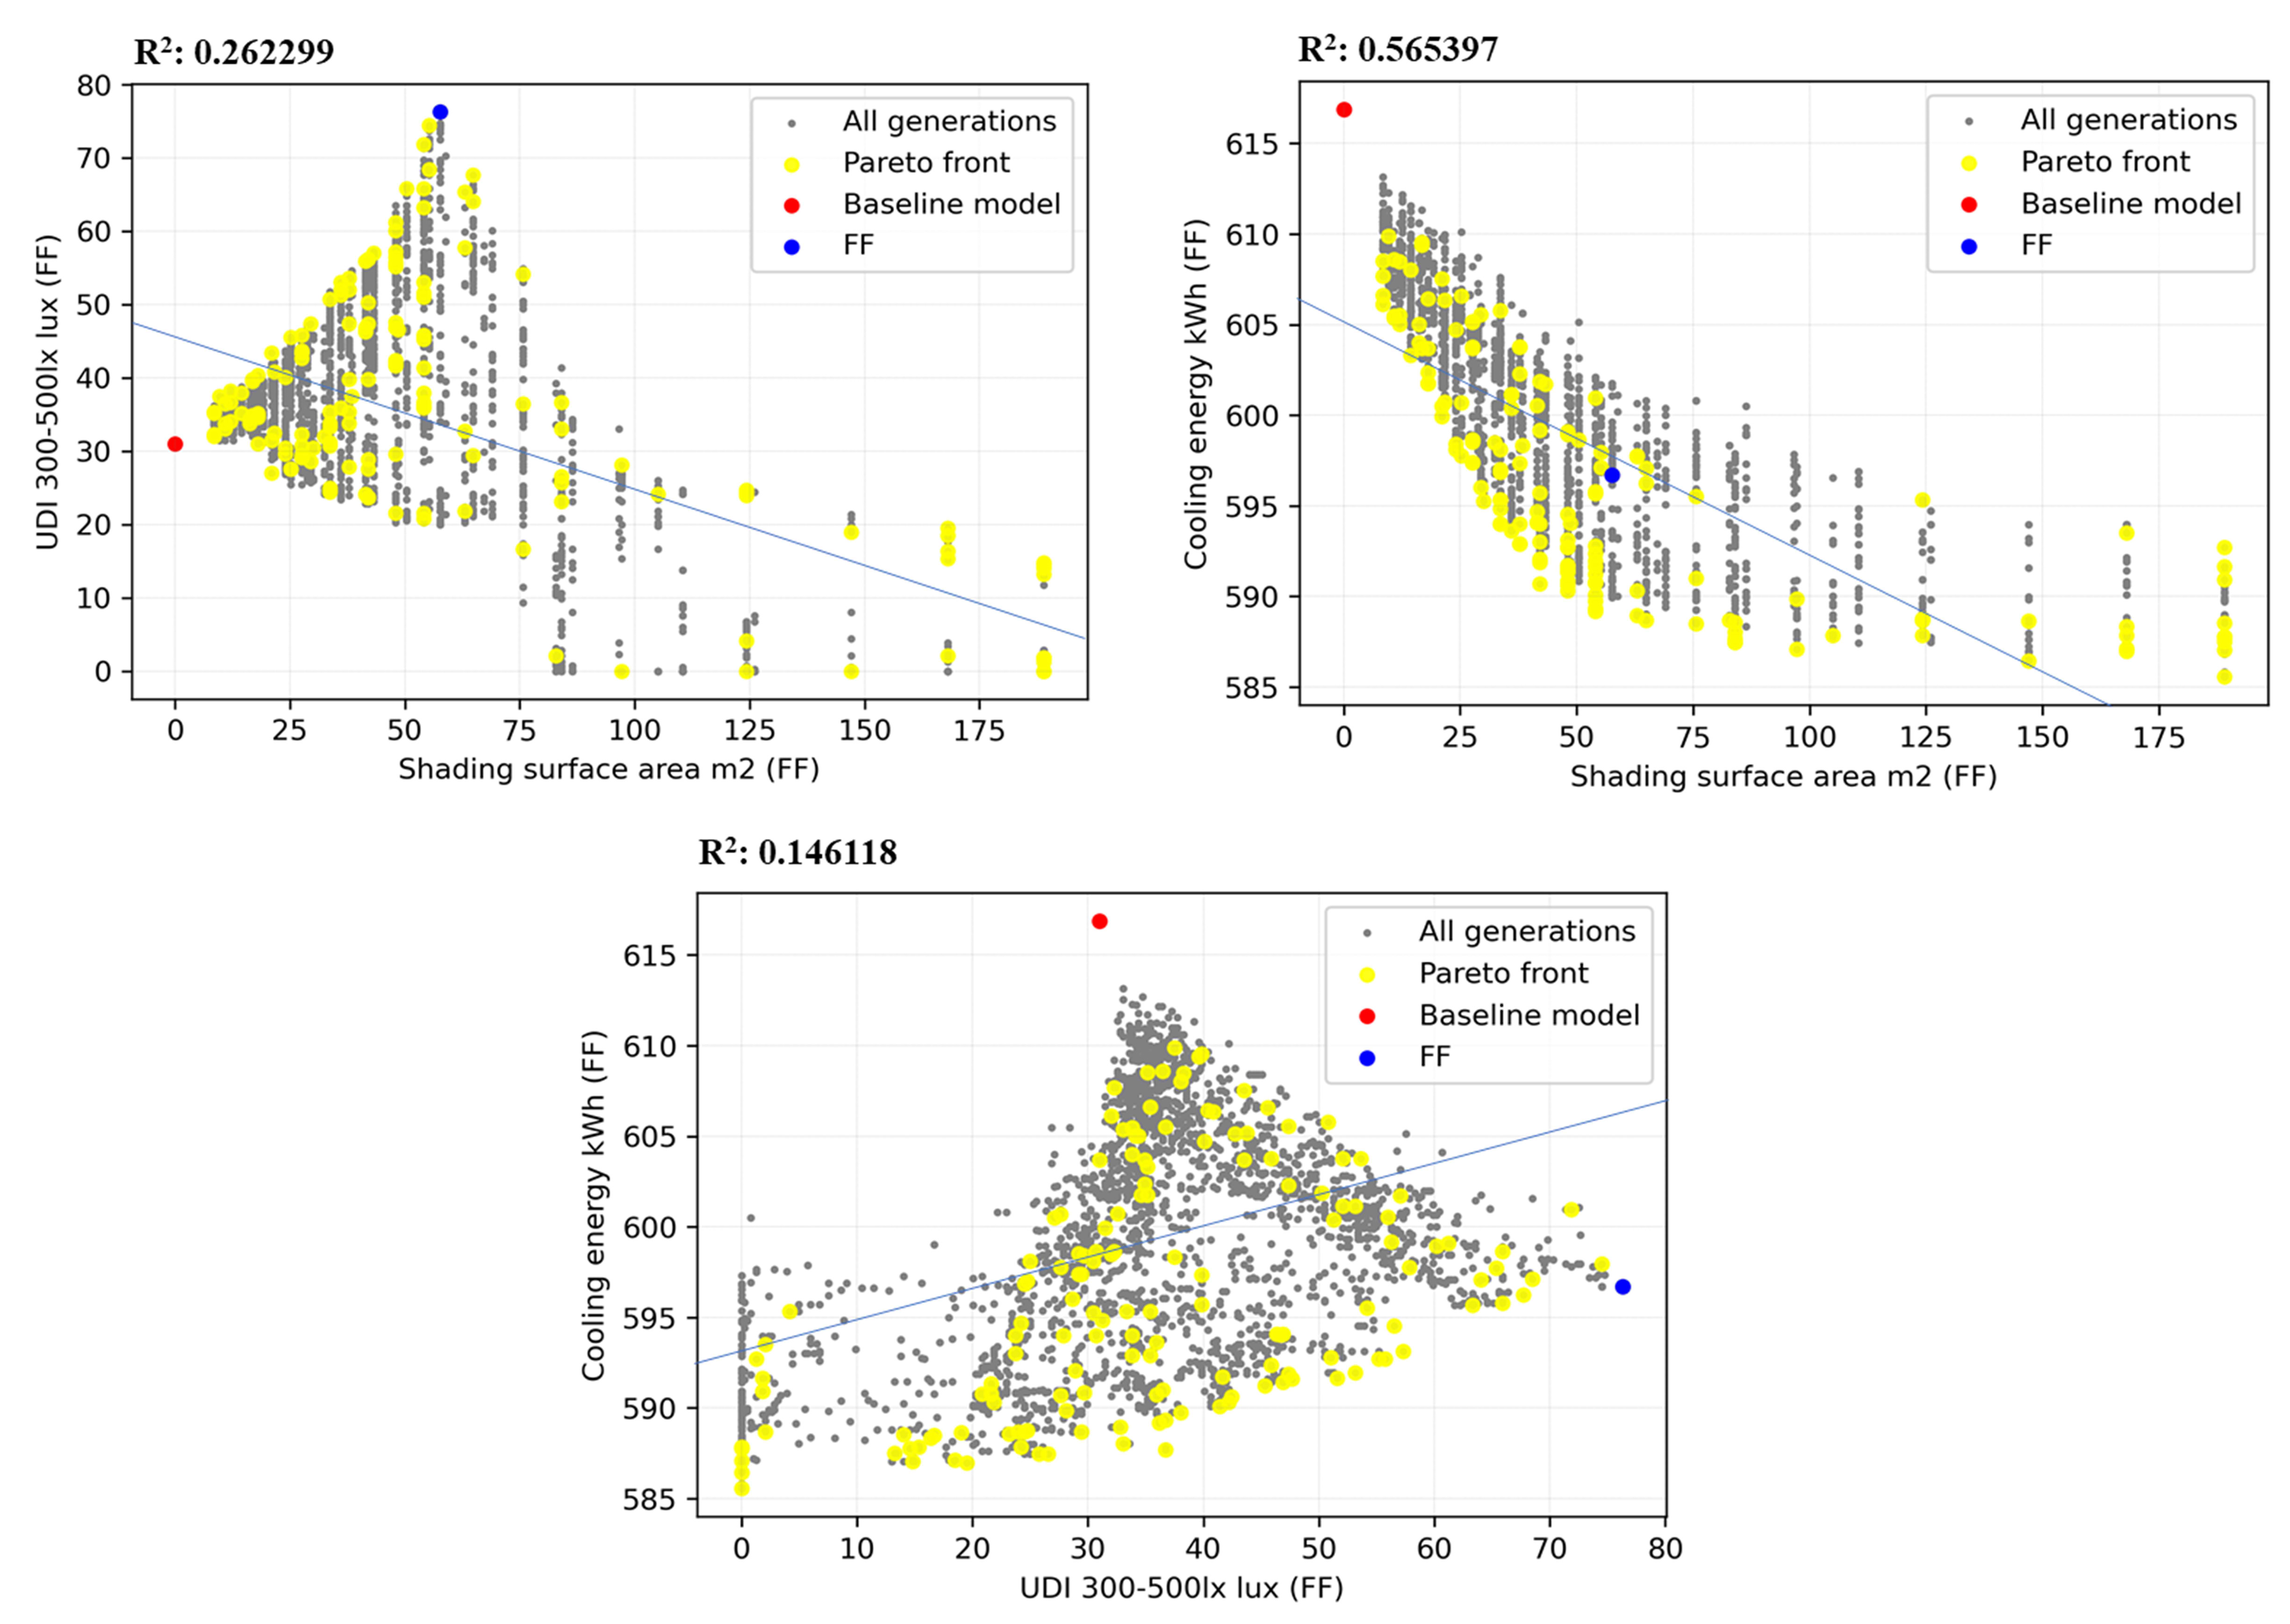
Fig. 8. Scatterplot presenting correlation between two objectives of Jakarta.
Figure 9
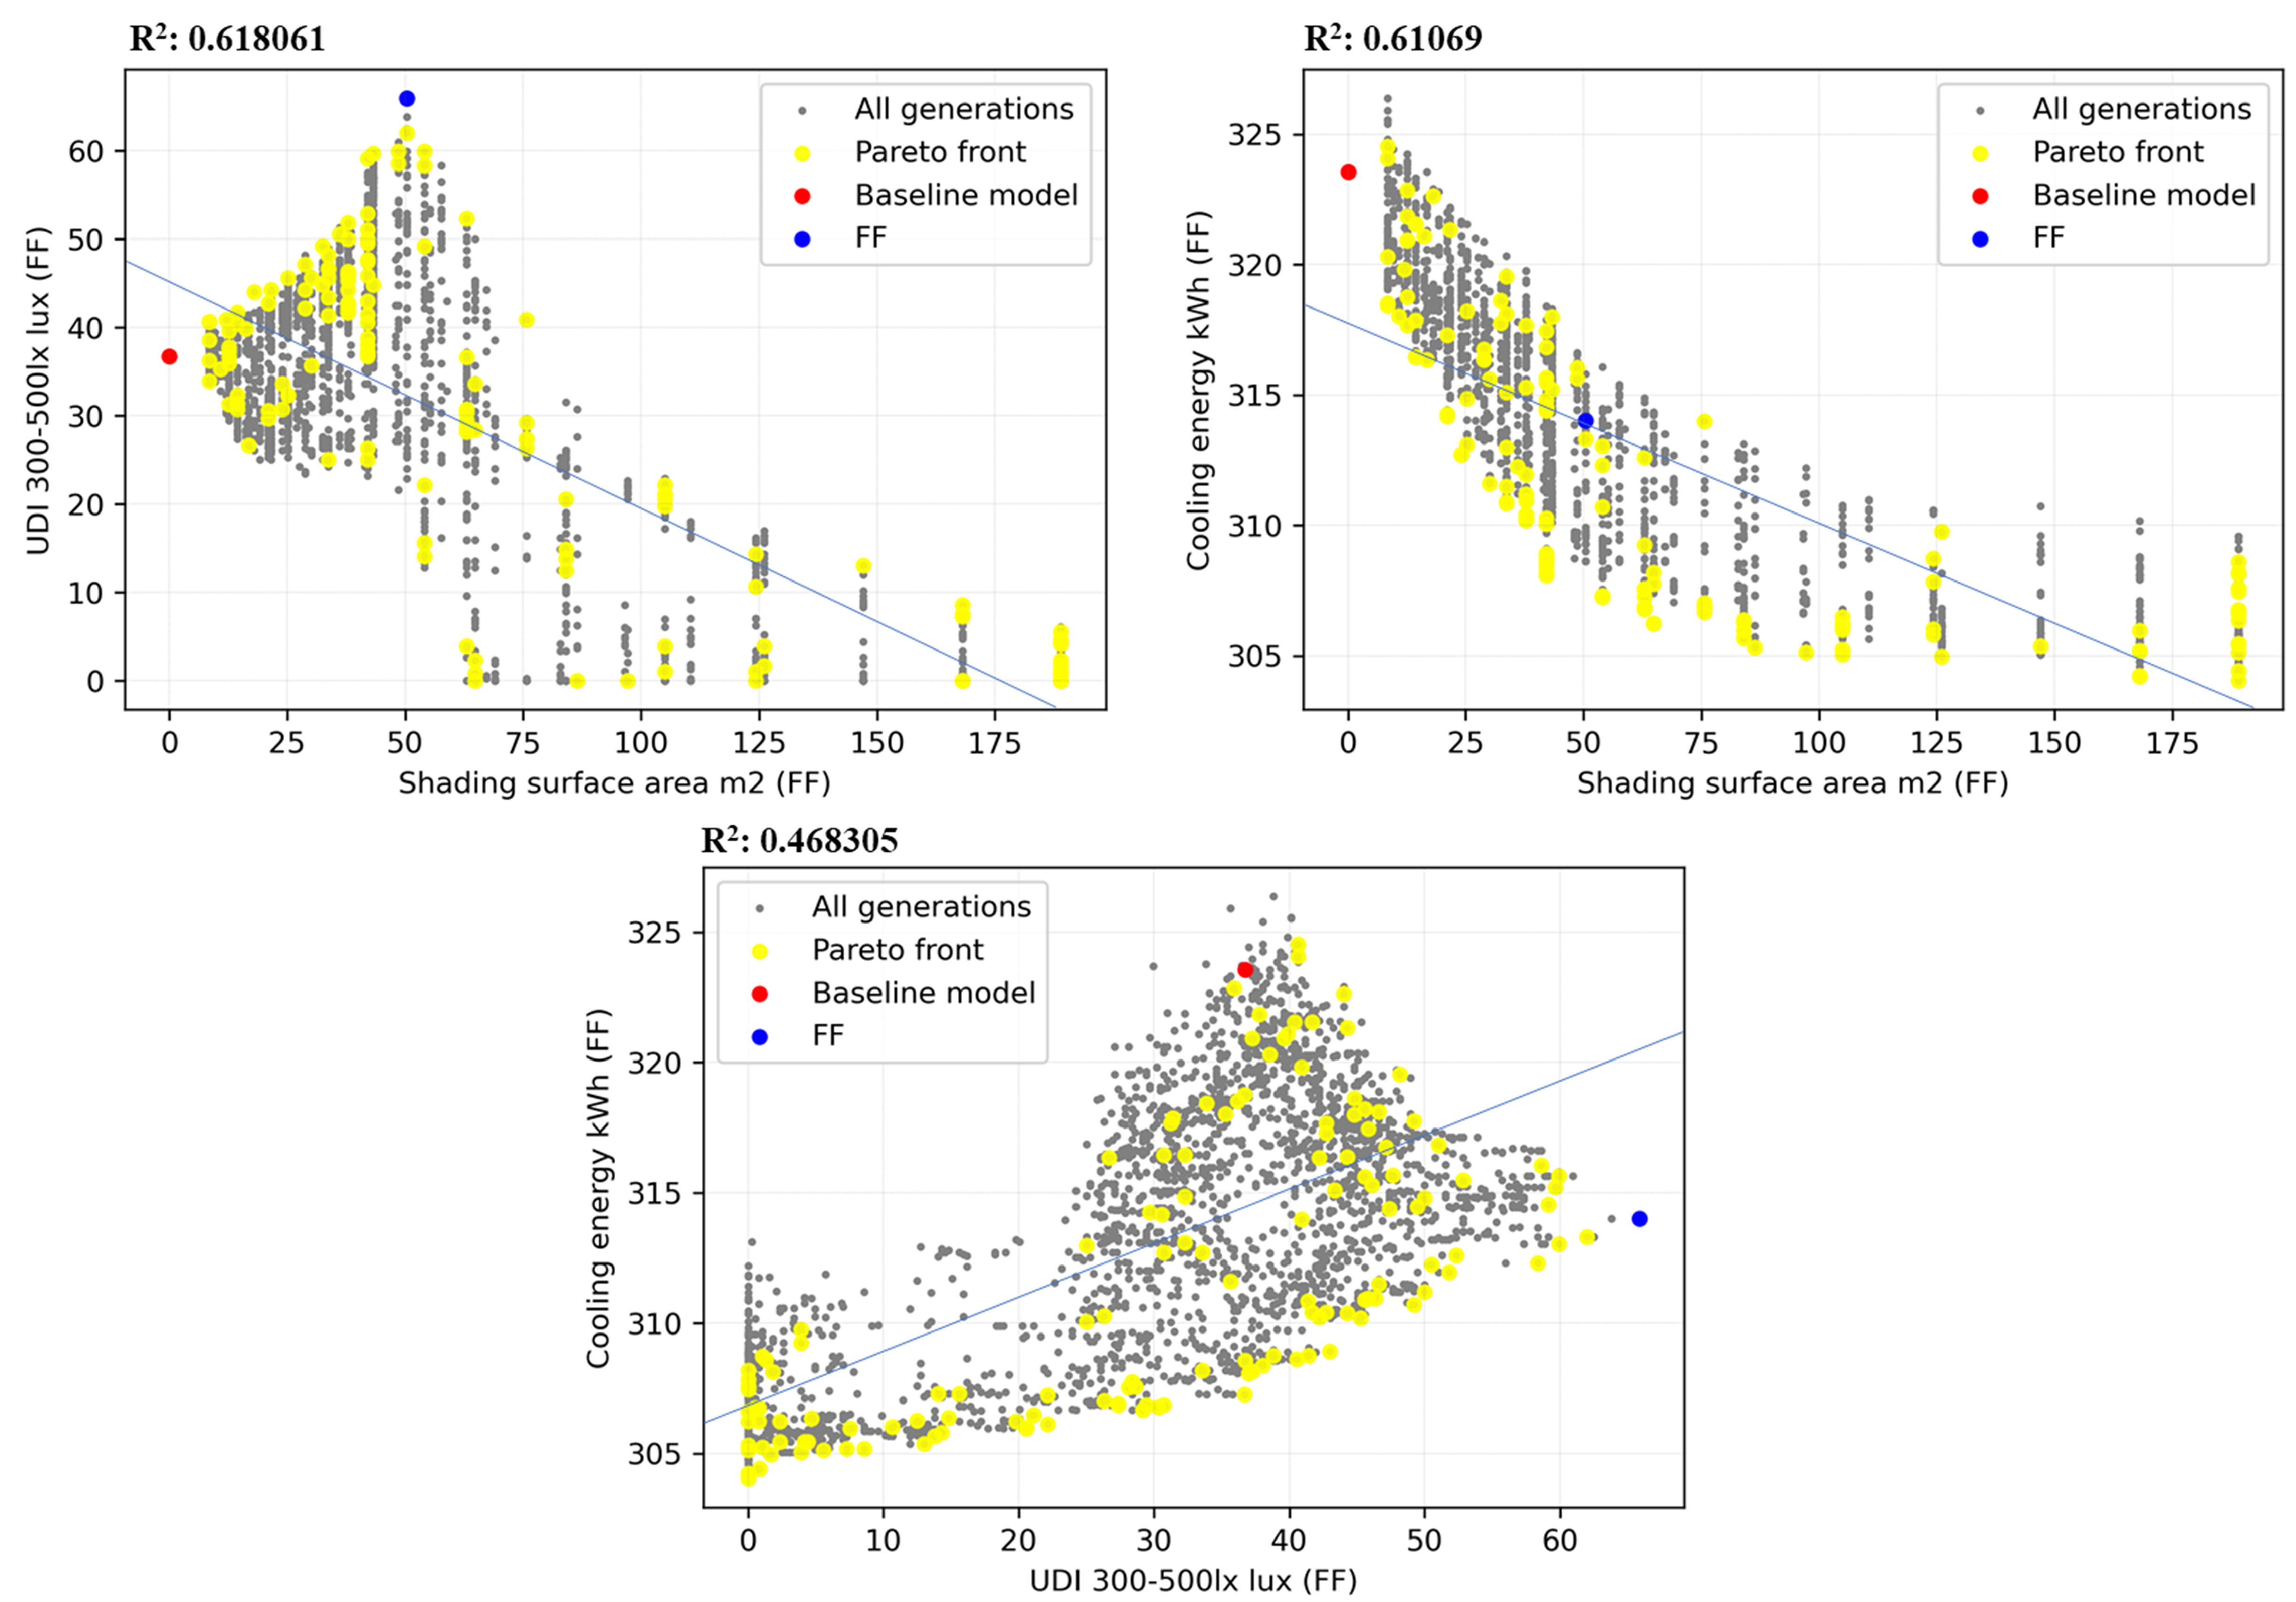
Fig. 9. Scatterplot presenting correlation between two objectives of Sydney.
Figure 7 depicts the correlation analysis and the distribution of individuals in Birmingham. From the scatterplot, it can be seen that there is an insignificant correlation between shading surface area, UDI 300 lx–500 lx, and cooling energy consumption. The distribution of pareto front solutions showed a concentration of smaller shading surfaces associated with UDI that ranged between 20% to 50%, while the largest UDI percentage was associated with a surface area between 55 m2 to 75 m2. The relation between UDI and cooling energy shows that only the range of UDI maximum of 50% to less than 70% was associated with minimum cooling energy consumption. Moreover, related to surface area, lower surface area was correlated with the highest cooling energy consumption.
Figure 8 illustrates the scatterplot of objective distributions in Jakarta. In the case of Jakarta, cooling energy consumption has a quite significant correlation with shading surface area. The highest UDI percentage was at around 50% of the shading surface area. A density of individuals was concentrated on a shading surface of less than 50 m2 with UDI of around 20% to around 55%. The lowest cooling energy consumption can be found in surface areas ranging from 125 m2 to 175 m2. Thus, the smaller surface area, is possibly positively corelated with higher cooling energy demand in the extreme hot week period. Even though the pareto fronts were distributed oddly toward these three presentations, however, the pareto front and FF individuals were inclined to swarm in the right direction (search area). The FF has been successfully located in the axis of maximum UDI, but there are trade-offs in shading surface area and cooling energy consumption.
Figure 9 shows scatterplots displaying the targets' association in a daylight sky simulation of Sydney. The distributions of Jakarta and Sydney show a high similarity in population field appearance except in their objective values and correlation. According to the Fit Y by X function in JMP fit line calculation, shading surface area has a strong negative correlation with both cooling energy consumption and UDI, while the correlation between energy consumption and daylight objective is only 0.468305. When viewed from the position of the FF solution, both Jakarta and Sydney have located the solution with the largest percentage of UDI in the middle of each objective’s range value. In general, the MOO results in Jakarta and Syndey showed similar tendencies but in shading to the UDI 300 lx to 500 lx correlation.
3.3. Parameters to objectives
It has been decided to add a parallel coordinate plot to demonstrate the relationship between the parameters and the optimization targets. The distribution of wires connecting each individual's parameters and the resulting performance in each of the circumstances are presented in Fig. 10. The parameters genome is represented by the first five vertical axes, and the goals are represented by the next three vertical axes. While color gradation employs the shading surface area for its scale.
Figure 10
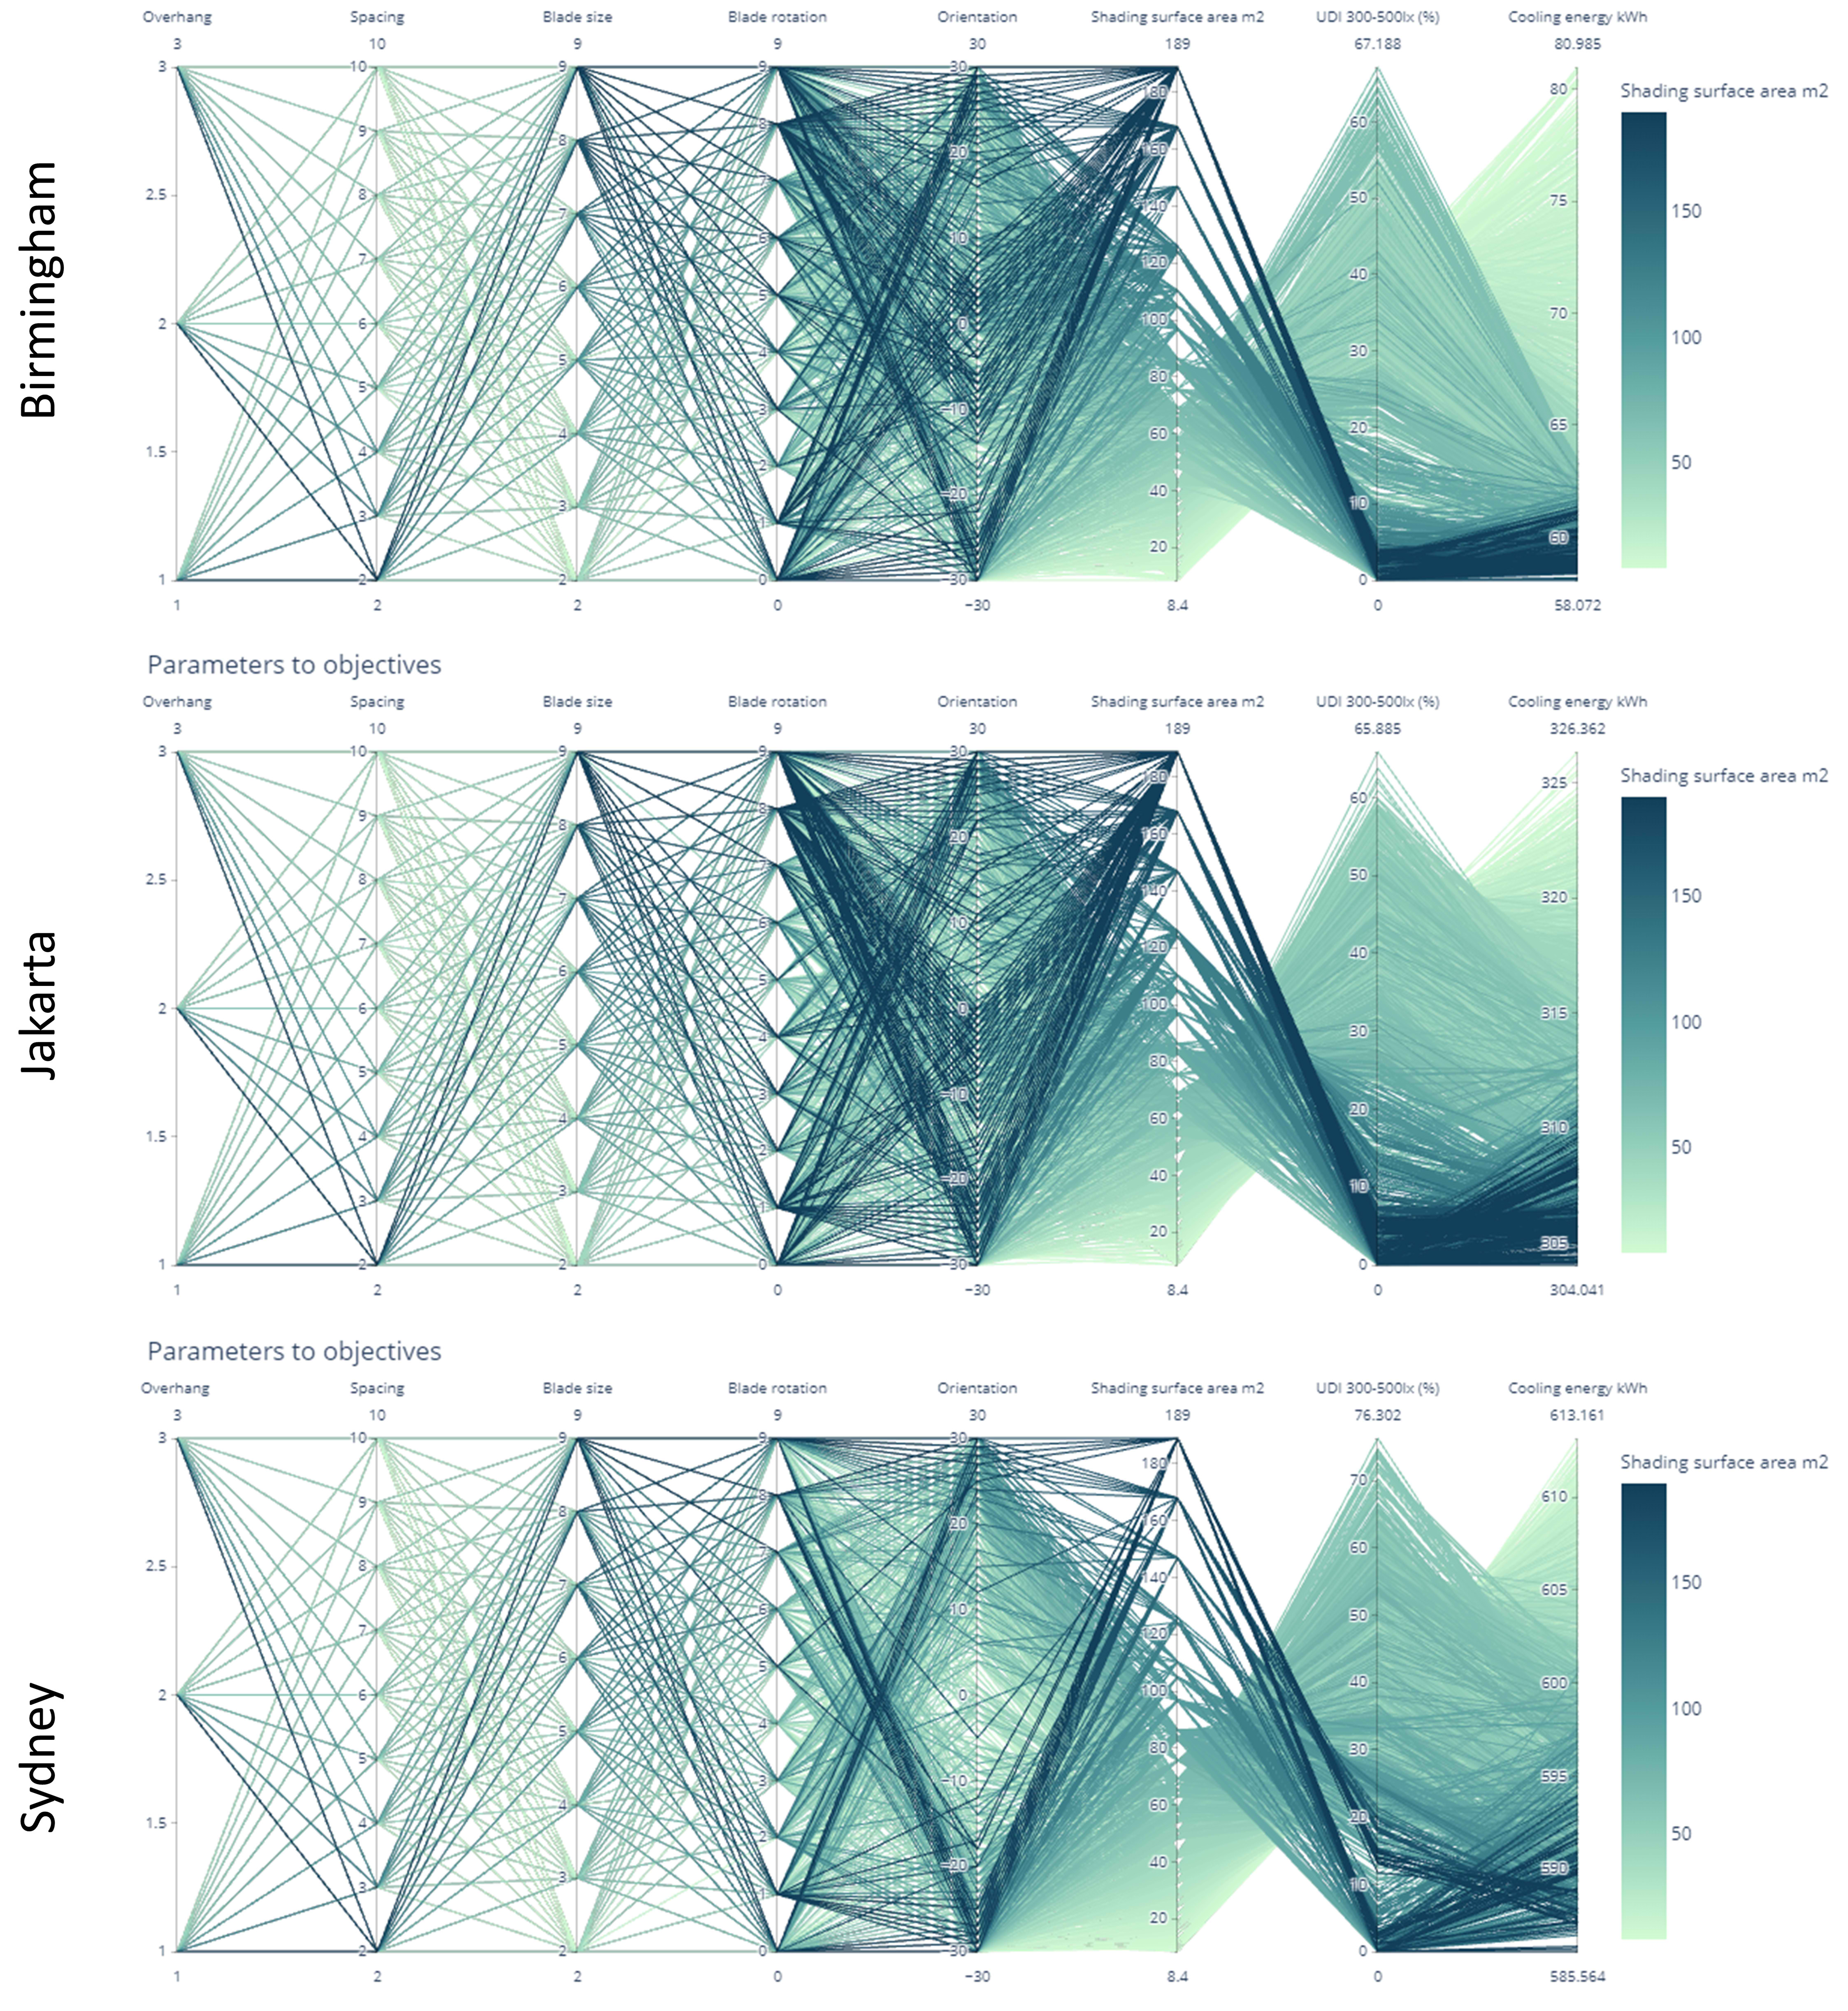
Fig. 10. Parallel coordinate plot showing the connection between parameters and objectives for all three cases.
There is a similarity between the three different locations. Firstly, a larger shading surface area is associated with the lowest UDI and energy consumption. The desirable UDI value is associated with a shading surface area ranging from 40 to 80 m2. By seeing the parallel plot, it is difficult to see the distribution tendency of overhang, blade rotation, and orientation since it shows an even distribution. Minimum energy simulation can be achieved from the combination of minimum spacing and larger blade size. However, this inclination leads to minimum UDI and vice versa. As a matter of common sense, maximum in spacing and minimum in blade size drive minimum shading surface area and directly implicate the possible middle value of UDI (between 25% and 40%) and the highest amount of energy consumption for cooling needs.
3.4. Parameters to objectives
A sensitivity analysis was performed to determine which parameter has the greatest influence on shaping the performance objectives (Fig. 11). The analysis was conducted by utilizing the Fit Model function in JMP statistical analysis software, picking the standardized targeted objective as Y or role variable, and putting all standardized parameters in the construct model effects column. The analysis was run by using Standard Least Square for Personality and emphasizing Effect Leverage. The analysis showed that spacing and blade size are the most influential parameters for almost all cases except for Jakarta cases related to UDI 300 lx – 500 lx. The difference in Jakarta cases might be caused by the inclination during the MOO process, considering that the MOO would rather direct the search according to its training process instead of iterating all the parameters. Overhang and orientation are the least influential parameters recorded in this research. The finding of influential parameters can be a main consideration in further design processes.
Figure 11
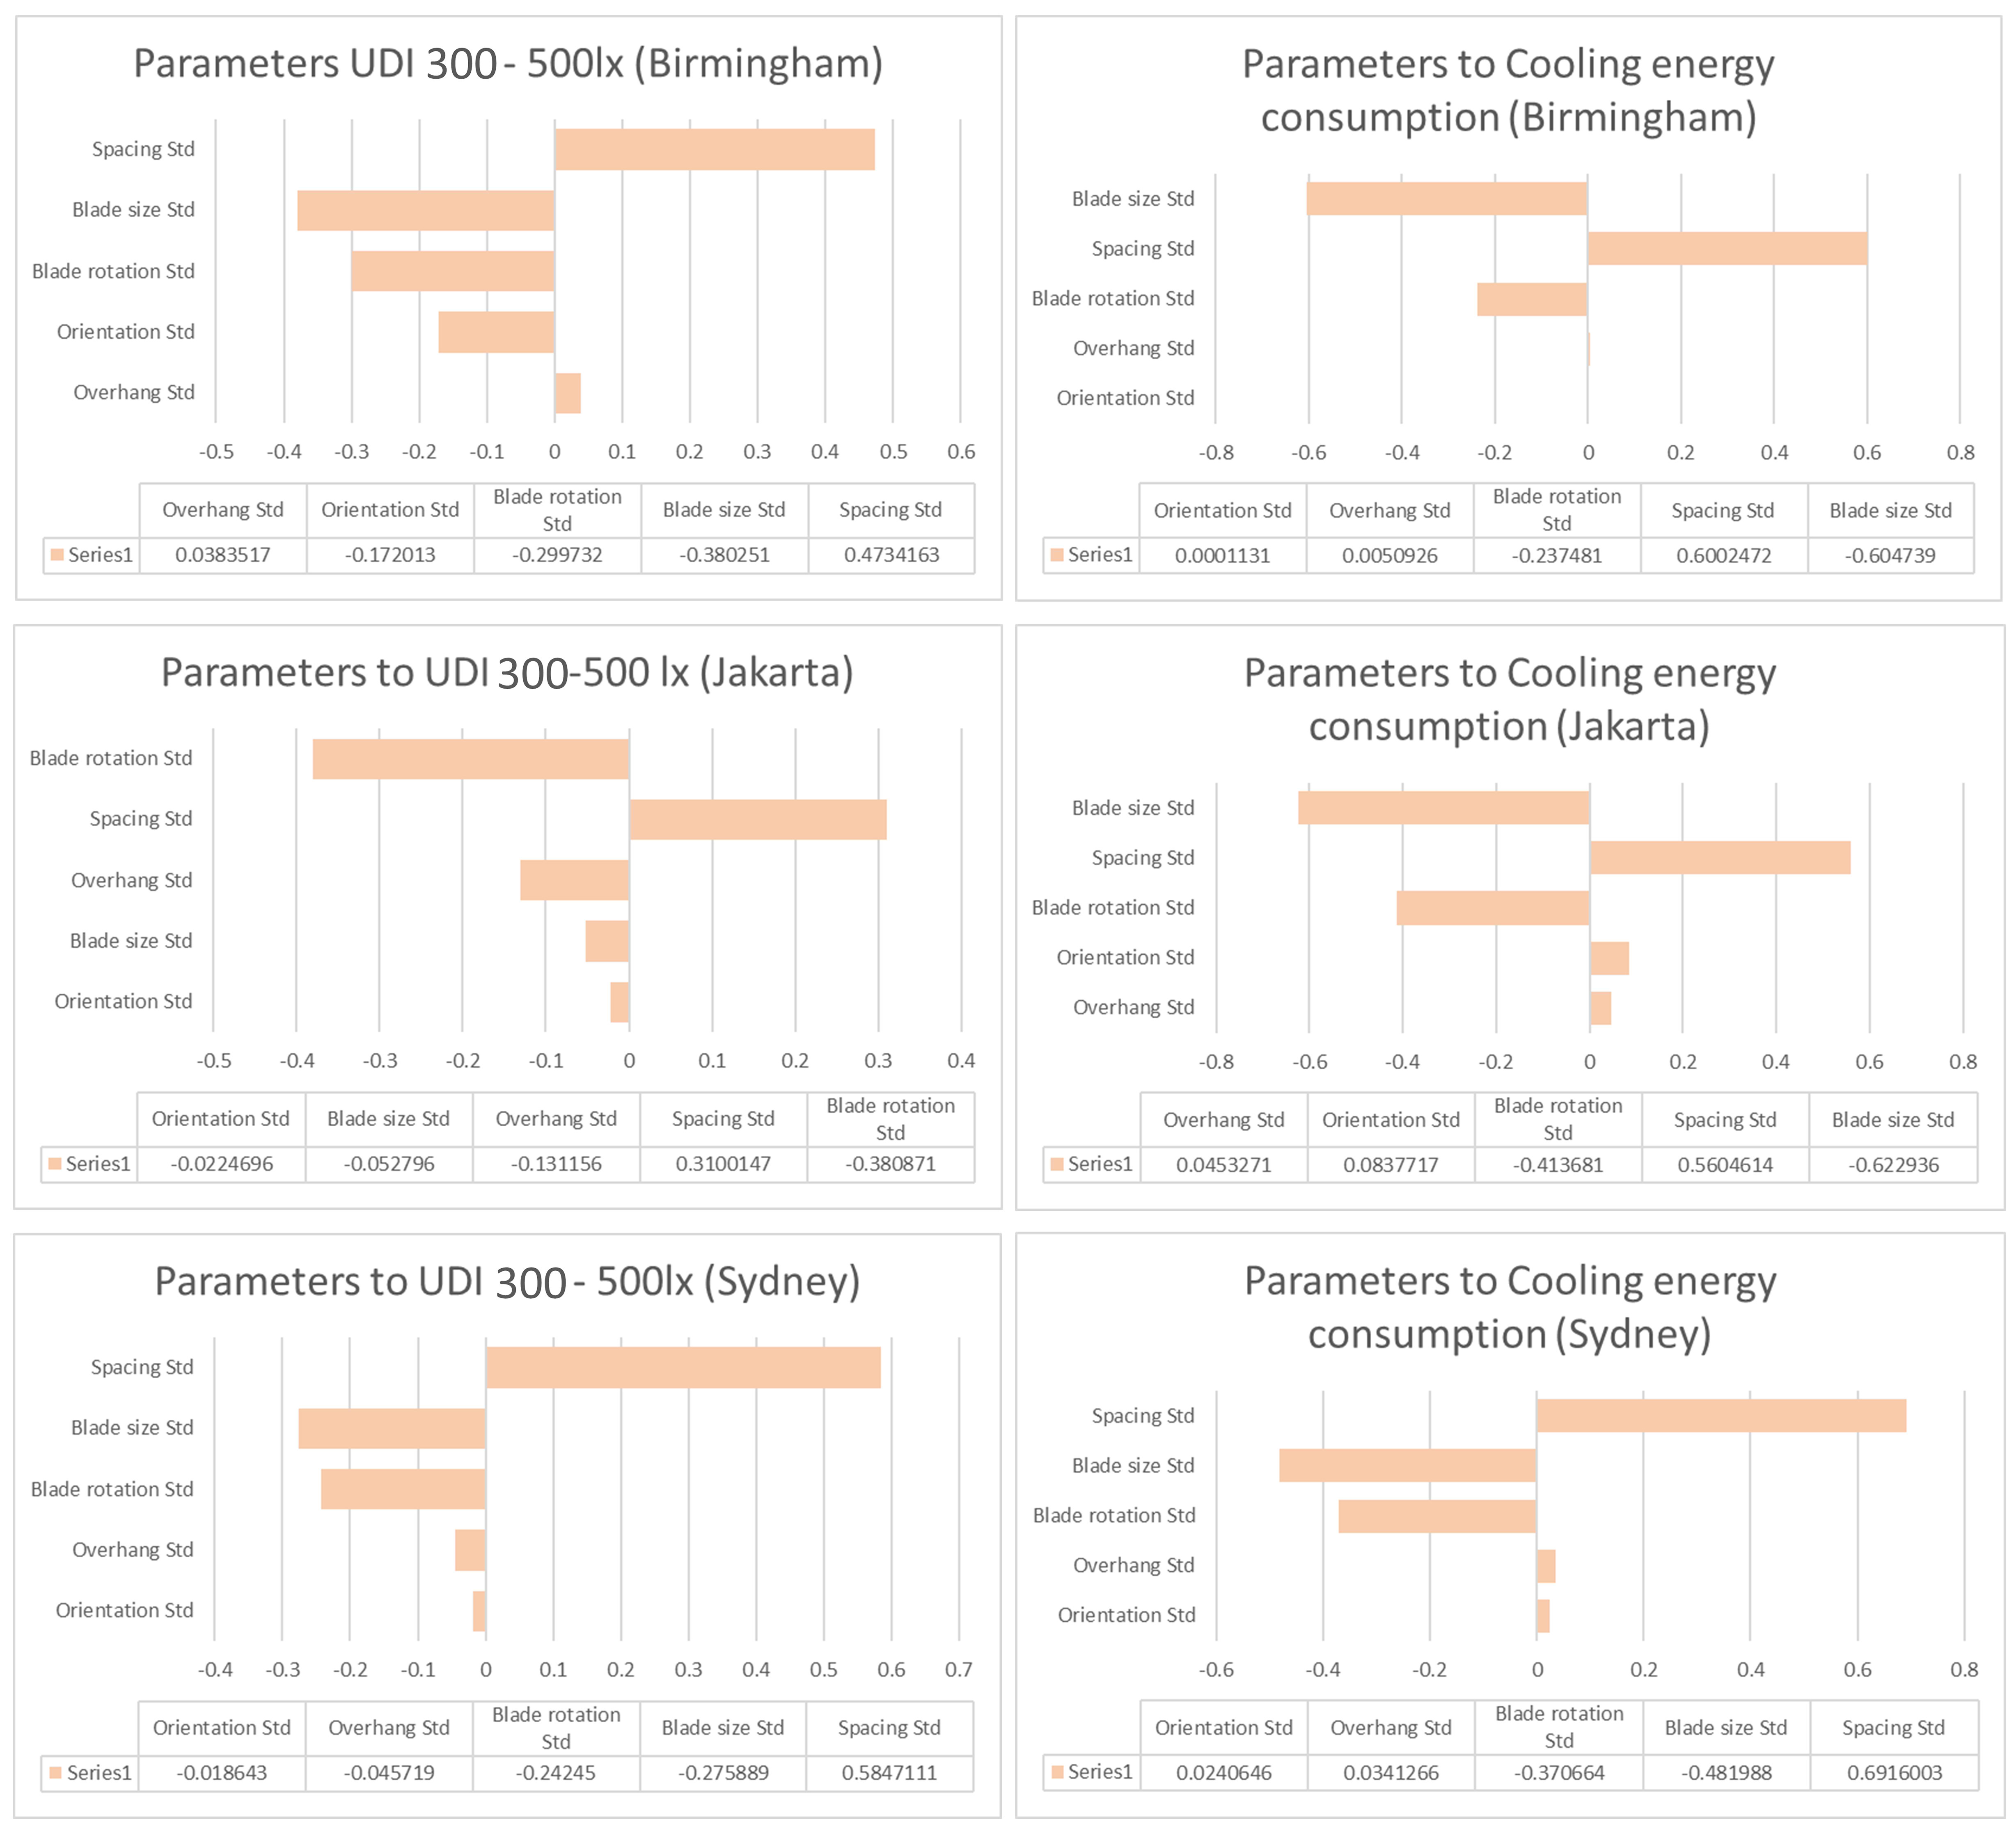
Fig. 11. Tornado plot showing the results of sensitivity analysis.
3.5. General comparison
The research's ultimate goal is to optimize and maximize the efficiency of the proposed approach. By weighing targets in evolutionary algorithm optimization, the efficiency goal is to maximize UDI while minimizing cooling energy use. The efficiency is determined by comparing the baseline model to one that has been subjected to double filtering during the optimization process and the calculation of the fitness function.
Figure 12 illustrates the comparison between the baseline model with the fitness function and the other observed solutions. In Birmingham, UDI 300 lx–500 lx has about 80% improvement. In terms of cooling energy consumption, the best solution performed at 25 kWh, or 28% lower than the baseline model. The solution finding processes have found the highest UDI and cooling energy, and the lowest solution consumed the least cooling energy consumption. In general, compare to the baseline model performance, the shading strategy in the Birmingham context provided a design solution in terms of daylight and energy consumption. In the case of Jakarta, UDI improved by 146.26% to reach a level of 76.6%. The energy consumption was optimized for about 20.2 kWh, or 3.26%. In Sydney, the UDI percentage increased by 79.48% and the energy consumption for cooling decreased by about 9.7 kWh, or 2.99%, from the baseline model performance.
Figure 12
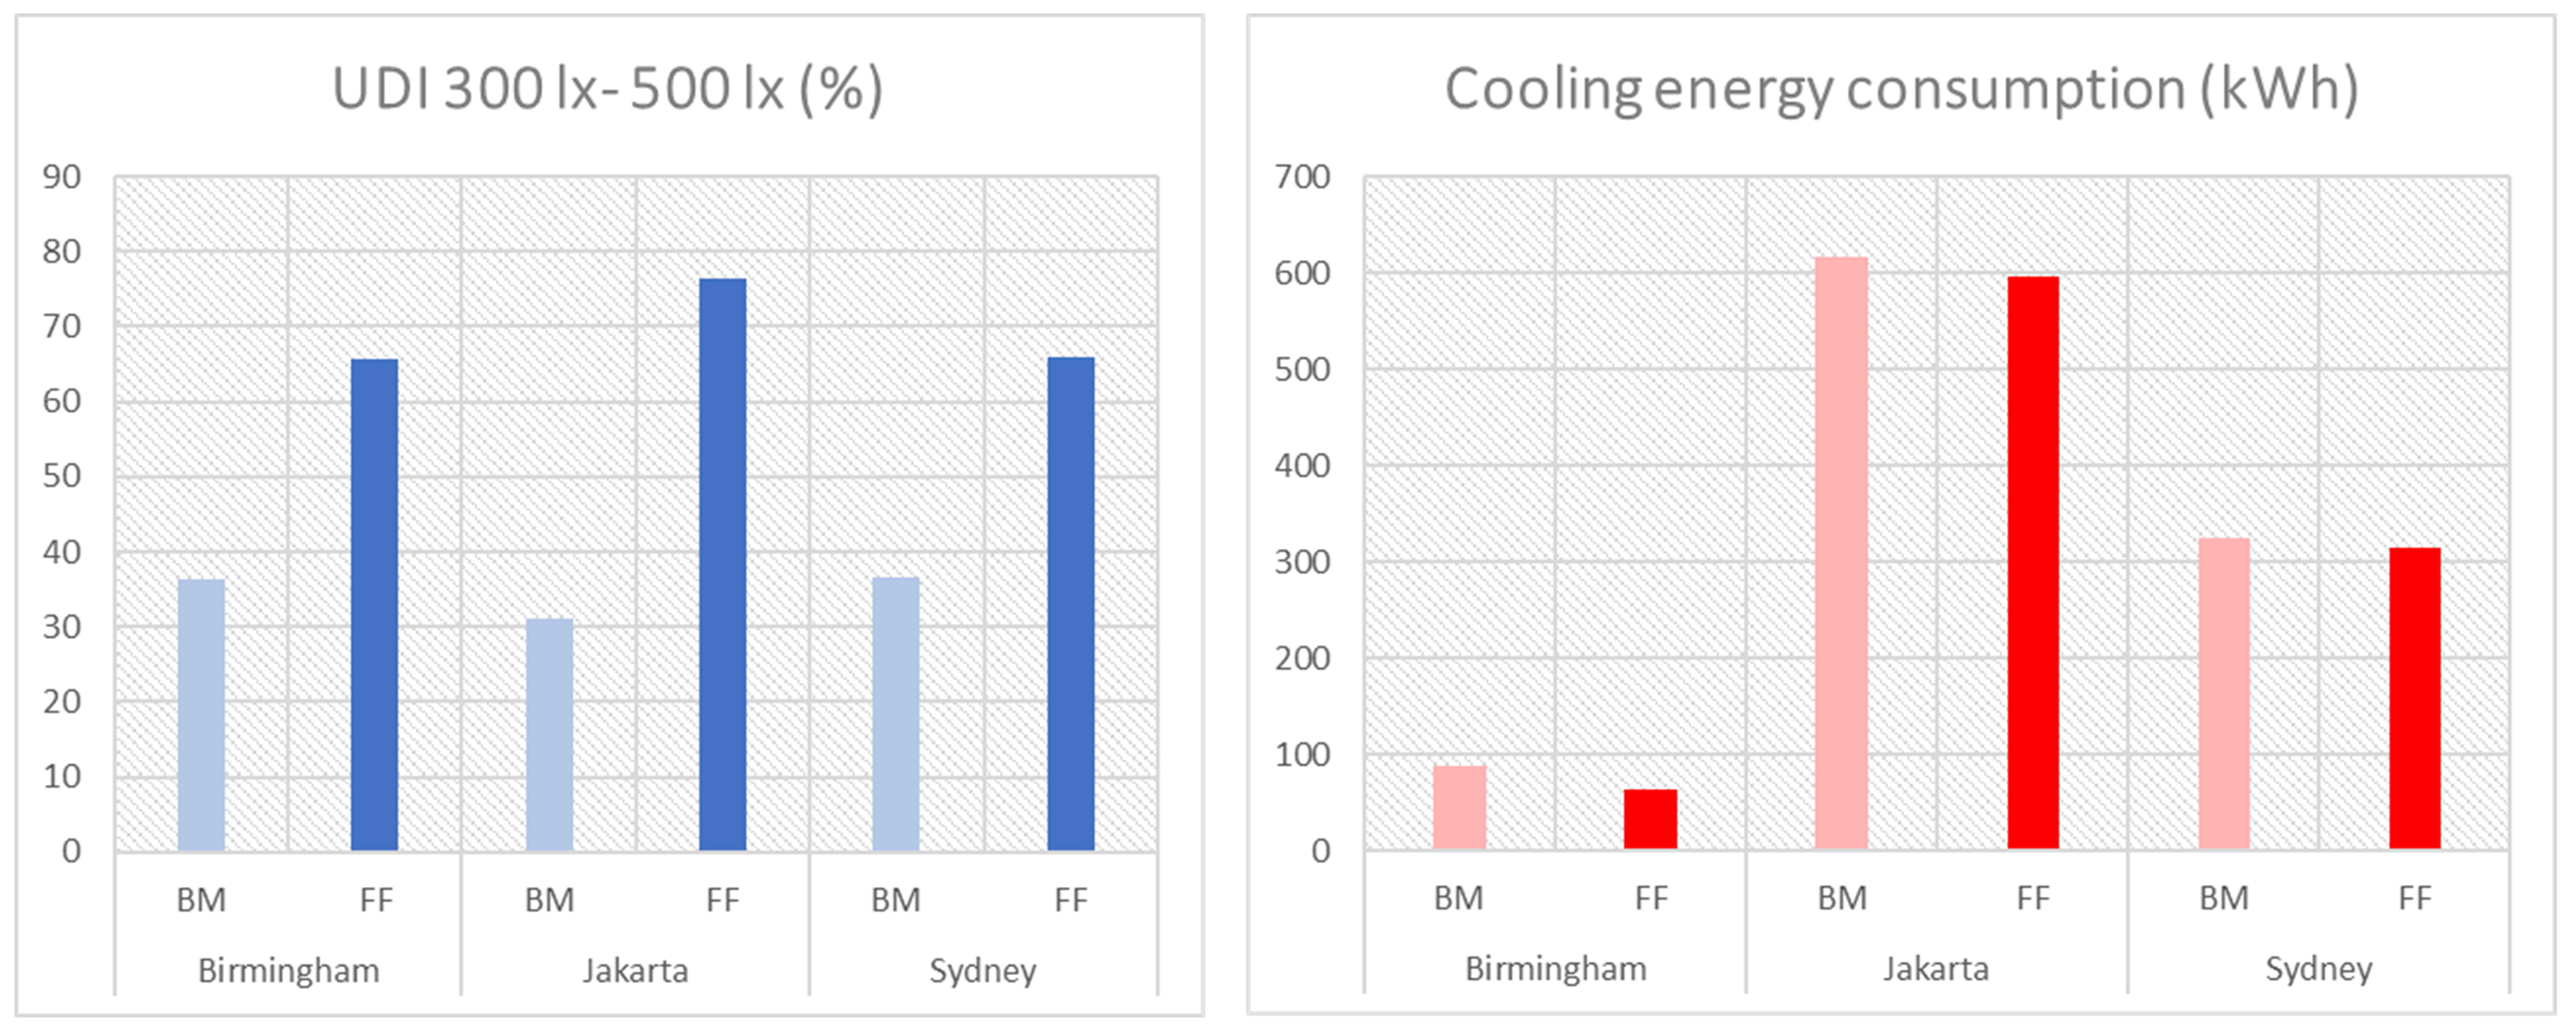
Fig. 12. General performance comparison between baseline model and the solution found.
4. Discussion
Previous study incorporating MOO and louver shading has been focusing on measuring daylighting inside the simulated room [3,7,11,12,38]. However, this paper has succeeded in providing an insight in daylight performance comparison utilizing louver shading device in three different sky condition. The methodology and platform used in this paper is in line with [32,33,39] despite different shading and weather context. The finding of this research supports the hypothesis of which the proposed system can bring optimization in terms of daylight performance and reduce energy consumption by iterating design variable to perform form-finding process instead of form making.
Comparing the results with benchmark model, the finding of this research re-confirm the finding in [3] saying that in comparison with room without shading, the proposed approach and the integration of louver as a most common shading to protect room from excessive daylight [9] can lead to a significant energy saving. What is more, the identification of the tendency among design parameter was in line with the finding in [39].
5. Conclusion
This research presented a MOO framework to investigate daylight and cooling energy consumption in Birmingham, Jakarta, and Sydney. The parameters to be used in MOO include the component that shapes the louver shading system. The objective performance was the maximization of UDI 300-500 lx and the minimization of cooling energy consumption. The simulation was conducted during the extreme hot week for each city, for energy simulation, and on the hottest day based on weather data for the daylight simulation.
The main finding of this research is that the proposed top-down approaches were proven to be able to find the optimized solution and its parameters that balance multiple design goals. This research also observes the tendency of the parameter distribution toward the objectives. Besides, the spacing of the louver and the blade size are found to be the most influential parameters driving the objective performance. The finding of the research, beside its contribution to the capability of offering efficiency, is also expected to become a design consideration, helping designers or stakeholders to have a better understanding of and immediate performance and visual feedback to support the design decision-making process during the early phase of the design process.
Acknowledgments
This work was supported by the Ministry of Research and Technology/National Research and Innovation Agency of Republic Indonesia grant numbers 458/UN40.D/PT/2020 under LPPM Universitas Pendidikan Indonesia. The author would like to thank the Ministry of Education, Culture, Sports, Science and Technology of Japan (MEXT) for the scholarship.
Contributions
R. P. K.: Ideation and concept, parametric definition, methodology, writing original — draft. H. F.: supervision, editing original — draft. B. P.: supervision, funding acquisition. M. D. K.: Ideation and concept, editing. K.: Parametric definition, methodology, writing original — draft. The authors read and approved the final manuscript.
Declaration of competing interest
The authors declare no conflict of interest.
References
- E.D. Giouri, M. Tenpierik, M. Turrin, Zero energy potential of a high-rise office building in a Mediterranean climate: Using multi-objective optimization to understand the impact of design decisions towards zero-energy high-rise buildings, Energy Build. 209 (2020). https://doi.org/10.1016/j.enbuild.2019.109666
- J. Natanian, O. Aleksandrowicz, T. Auer, A parametric approach to optimizing urban form, energy balance and environmental quality: The case of Mediterranean districts, Appl. Energy. 254 (2019) 113637. https://doi.org/10.1016/j.apenergy.2019.113637
- A.I. Palmero-Marrero, A.C. Oliveira, Effect of louver shading devices on building energy requirements, Appl. Energy. 87 (2010) 2040-2049. https://doi.org/10.1016/j.apenergy.2009.11.020
- K. Konis, E.S. Lee, Measured daylighting potential of a static optical louver system under real sun and sky conditions, Build. Environ. 92 (2015) 347-359. https://doi.org/10.1016/j.buildenv.2015.04.024
- S. Vera, D. Uribe, W. Bustamante, G. Molina, Optimization of a fixed exterior complex fenestration system considering visual comfort and energy performance criteria, Build. Environ. 113 (2017) 163-174. https://doi.org/10.1016/j.buildenv.2016.07.027
- H. Yi, Y. Kim, Self-shaping building skin: Comparative environmental performance investigation of shape-memory-alloy (SMA) response and artificial-intelligence (AI) kinetic control, J. Build. Eng. 35 (2021) 102113. https://doi.org/10.1016/j.jobe.2020.102113
- A. Eltaweel, Y. Su, Evaluation of suitability of a parametrically controlled louvers for various orientations throughout a year comparing to an existing case, Buildings. 7 (2017). https://doi.org/10.3390/buildings7040109
- A. Eltaweel, Y. Su, Parametric design and daylighting : A literature review, 73 (2017) 1086-1103. https://doi.org/10.1016/j.rser.2017.02.011
- A. Eltaweel, S. Yuehong, Y. Su, Using integrated parametric control to achieve better daylighting uniformity in an office room: A multi-Step comparison study, Energy Build. 152 (2017) 137-148. https://doi.org/10.1016/j.enbuild.2017.07.033
- A. Eltaweel, Y. Su, Controlling venetian blinds based on parametric design; via implementing Grasshopper's plugins: A case study of an office building in Cairo, Energy Build. 139 (2017) 31-43. https://doi.org/10.1016/j.enbuild.2016.12.075
- K.S. Lee, K.J. Han, J.W. Lee, The impact of shading type and azimuth orientation on the daylighting in a classroom-focusing on effectiveness of façade shading, comparing the results of da and udi, Energies. 10 (2017). https://doi.org/10.3390/en10050635
- Y.J. Grobman, G. Austern, Y. Hatiel, I.G. Capeluto, Evaluating the Influence of Varied External Shading Elements on Internal Daylight Illuminances, Buildings. 10 (2020) 22. https://doi.org/10.3390/buildings10020022
- J. Nembrini, S. Samberger, G. Labelle, Parametric scripting for early design performance simulation, Energy Build. 68 (2014) 786-798. https://doi.org/10.1016/j.enbuild.2013.09.044
- S. Wang, Y.K. Yi, N. Liu, Multi-objective optimization (MOO) for high-rise residential buildings' layout centered on daylight, visual, and outdoor thermal metrics in China, Build. Environ. 205 (2021) 108263. https://doi.org/10.1016/j.buildenv.2021.108263
- D. Yang, D. Di Stefano, M. Turrin, S. Sariyildiz, Y. Sun, Dynamic and interactive re-formulation of multi-objective optimization problems for conceptual architectural design exploration, Autom. Constr. 118 (2020) 103251. https://doi.org/10.1016/j.autcon.2020.103251
- D. Mohammad, A. Hamdan, F.L. De Oliveira, D.M.A. Hamdan, F.L. de Oliveira, The impact of urban design elements on microclimate in hot arid climatic conditions: Al Ain City, UAE, Energy Build. 200 (2019) 86-103. https://doi.org/10.1016/j.enbuild.2019.07.028
- R.C. Grifoni, S. Tascini, E. Cesario, G.E. Marchesani, Cool façade optimization: A new parametric methodology for the urban heat island phenomenon (UHI), Conf. Proc. - 2017 17th IEEE Int. Conf. Environ. Electr. Eng. 2017 1st IEEE Ind. Commer. Power Syst. Eur. EEEIC / I CPS Eur. 2017. (2017). https://doi.org/10.1109/EEEIC.2017.7977677
- A. Toutou, M. Fikry, W. Mohamed, The parametric based optimization framework daylighting and energy performance in residential buildings in hot arid zone, Alexandria Eng. J. 57 (2018) 3595-3608 https://doi.org/10.1016/j.aej.2018.04.006
- K. Lakhdari, L. Sriti, B. Painter, Parametric optimization of daylight, thermal and energy performance of middle school classrooms, case of hot and dry regions, Build. Environ. 204 (2021) 108173. https://doi.org/10.1016/j.buildenv.2021.108173
- Grasshopper 3D, (n.d.). https://www.grasshopper3d.com/ (accessed October 8, 2020).
- M.S. Roudsari, M. Pak, Ladybug: A parametric environmental plugin for grasshopper to help designers create an environmentally-conscious design, Proc. BS 2013 13th Conf. Int. Build. Perform. Simul. Assoc. (2013) 3128-3135.
- R. Vierlinger, D IPLOMARBEIT Master Thesis Multi Objective Design Interface, (2015).
- A. Eltaweel, Y. Su, M.A. Mandour, O.O. Elrawy, A novel automated louver with parametrically-angled reflective slats; design evaluation for better practicality and daylighting uniformity, J. Build. Eng. 42 (2021) 102438. https://doi.org/10.1016/j.jobe.2021.102438
- H. Kim, M.J. Clayton, A multi-objective optimization approach for climate-adaptive building envelope design using parametric behavior maps, Build. Environ. 185 (2020) 107292. https://doi.org/10.1016/j.buildenv.2020.107292
- K. Konis, A. Gamas, K. Kensek, Passive performance and building form: An optimization framework for early-stage design support, Sol. Energy. 125 (2016) 161-179. https://doi.org/10.1016/j.solener.2015.12.020
- E. Taveres-cachat, G. Lobaccaro, F. Goia, G. Chaudhary, A methodology to improve the performance of PV integrated shading devices using multi-objective optimization, Appl. Energy. 247 (2019) 731-744. https://doi.org/10.1016/j.apenergy.2019.04.033
- P. Pilechiha, M. Mahdavinejad, F. Pour Rahimian, P. Carnemolla, S. Seyedzadeh, F. Pour, Multi-objective optimisation framework for designing office windows: quality of view, daylight and energy efficiency, Appl. Energy. 261 (2020) 114356. https://doi.org/10.1016/j.apenergy.2019.114356
- R.A. Rizi, A. Eltaweel, A user detective adaptive facade towards improving visual and thermal comfort, J. Build. Eng. 33 (2021) 101554. https://doi.org/10.1016/j.jobe.2020.101554
- A. Zani, M. Andaloro, L. Deblasio, P. Ruttico, A.G. Mainini, Computational Design and Parametric Optimization Approach with Genetic Algorithms of an Innovative Concrete Shading Device System, Procedia Eng. 180 (2017) 1473-1483. https://doi.org/10.1016/j.proeng.2017.04.310
- A. Zhang, R. Bokel, A. Van Den Dobbelsteen, Y. Sun, Q. Huang, Q. Zhang, Optimization of thermal and daylight performance of school buildings based on a multi-objective genetic algorithm in the cold climate of China, Energy Build. 139 (2017) 371-384. https://doi.org/10.1016/j.enbuild.2017.01.048
- R.P. Khidmat, H. Fukuda, R. Widayati, Expanded metal daylight performance based on the standard type JIS G3351 Expanded metal daylight performance based on the standard type JIS G3351, (2021).
- R.P. Khidmat, H. Fukuda, Kustiani, B. Paramita, M. Qingsong, A. Hariyadi, Investigation into the daylight performance of expanded-metal shading through parametric design and multi-objective optimisation in Japan, J. Build. Eng. 51 (2022) 104241. https://doi.org/10.1016/j.jobe.2022.104241
- R.P. Khidmat, M.S. Ulum, A.D.E. Lestari, Facade Components Optimization of Naturally Ventilated Building in Tropical Climates through Generative Processes. Case study: Sumatera Institute of Technology (ITERA), Lampung, Indonesia, IOP Conf. Ser. Earth Environ. Sci. 537 (2020). https://doi.org/10.1088/1755-1315/537/1/012015
- Weatherspark, (n.d.). https://weatherspark.com/ (accessed November 12, 2021).
- A. Nabil, J. Mardaljevic, Useful daylight illuminance: A new paradigm for assessing daylight in buildings, Light. Res. Technol. 37 (2005) 41-59. https://doi.org/10.1191/1365782805li128oa
- A. Nabil, J. Mardaljevic, Useful daylight illuminances: A replacement for daylight factors, Energy Build. 38 (2006) 905-913. https://doi.org/10.1016/j.enbuild.2006.03.013
- J. Bader, E. Zitzler, HypE : An algorithm for fast optimization, Evol. Comput. 19 (2011) 45-76. https://doi.org/10.1162/EVCO_a_00009
- A. Wagdy, F. Fathy, A parametric approach for achieving optimum daylighting performance through solar screens in desert climates, J. Build. Eng. 3 (2015) 155-170. https://doi.org/10.1016/j.jobe.2015.07.007
- Y.K. Yi, Building facade multi-objective optimization for daylight and aesthetical perception, Build. Environ. 156 (2019) 178-190. https://doi.org/10.1016/j.buildenv.2019.04.002
Copyright © 2022 The Author(s). Published by solarlits.com.

4497
Total views
Citations
SHARE ON


