Article Outline
5. Appendix A. Supplementary material
Declaration of competing interest
Figures and tables
Volume 9 Issue 2 pp. 177-196 • doi: 10.15627/jd.2022.14
Lighting Quality Self-assessment in Italian Home Offices
Laura Bellia, Francesca Diglio, Francesca Fragliasso*
Author affiliations
University of Naples Federico II, Naples, Italy
*Corresponding author.
bellia@unina.it (L. Bellia)
francesca.diglio@unina.it (F. Diglio)
francesca.fragliasso@unina.it (F. Fragliasso)
History: Received 8 July 2022 | Revised 9 August 2022 | Accepted 19 August 2022 | Published online 7 September 2022
Copyright: © 2022 The Author(s). Published by solarlits.com. This is an open access article under the CC BY license (http://creativecommons.org/licenses/by/4.0/).
Citation: Laura Bellia, Francesca Diglio, Francesca Fragliasso, Lighting Quality Self-assessment in Italian Home Offices, Journal of Daylighting 9 (2022) 177-196. https://dx.doi.org/10.15627/jd.2022.14
Figures and tables
Abstract
The spread of information technology and the improvement of telecommunicating systems have changed the way to conceive work. People performing typical office activities provided with a laptop and an internet connection can work in whatever place: a coffee house, a waiting room of a train station, an airport, or their own home. The habit to work at home has amazingly spread due to the Covid-19 pandemic, arising crucial questions. Are home work-stations comfortable enough to work? Are lighting conditions of residential spaces proper to perform typical office activities? This paper presents a survey investigating the typical characteristics of the luminous environment in home working spaces (considering both daylight and electric light) and people’s average awareness about light and lighting-connected themes. The research has been carried out through an online questionnaire addressed to home workers and students forced to stay home because of the Covid-19 spread. The results demonstrated that many interviewees have difficulties in managing light and are not completely aware of the right actions to take to improve lighting quality of home workplaces. Moreover, a complete lack of knowledge about electric light has emerged. So, popularizing more knowledge about light and lighting-connected themes is prominent. Indeed, now and even more in the future, people will work in places other than the traditional workplaces, for which standards regulating lighting characteristics do not exist. In this context, the definition of ad hoc guidelines and the spread of best practices should be a crucial goal for researchers and experts in lighting.
Keywords
Home working, Residential lighting, Lighting quality, Covid-19
1. Introduction
In recent years, the way to conceive work is being revolutionised. The development of information technology (IT) and the improvement of telecommunicating systems have changed the way people perform daily common activities and, consequently, work tasks. Everyone now owns a laptop, a tablet, or a smartphone, connecting people to the rest of the world through the Internet and providing the possibility to phone, send e-mails, arrange web meetings, read, and modify text documents, spreadsheets and so on. Thanks to the portability of IT devices, the workplace can be each place in which people bring their working tools, i.e., for some activities, everywhere: a coffee house, a waiting room of a train station, an airport, workers’ own home. Despite the benefits connected to this revolution (higher flexibility and efficiency in work organization, balance between private and working life) a question arises: are these unconventional workplaces appropriate enough to allow people to perform their work tasks?
The design of comfortable workspaces should put together issues connected with ergonomics and control of environmental conditions, for example, to guarantee a proper microclimate or adequate soundproofing to promote concentration. Among all the space characteristics, lighting has certainly a fundamental role in defining workers’ well-being. It is by now commonly accepted that it not only enables us to see and perform activities, to sense and perceive our surroundings, but also influences our physiological and psychological health in many direct and indirect ways. It influences physiological and psychological processes, alertness, cognition, mood, and the regulation of the circadian system [1–4]. Especially for workers, light can improve cognitive performance and productivity [5].
For traditional workplaces, standards prescribe good practices to design lighting systems properly. Currently, in Europe, this role is played by the EN 12464-1 “Light and lighting - Lighting of workplaces - Part 1: Indoor workplaces” [6]. It gives all the recommendations about parameters determining the luminous environment such as luminance distribution, illuminance, directionality of light, variability of light (levels and colour of light), colour rendering, colour appearance of the light, glare, and flicker effects. As for the non-visual effect of light, research is too far from completely understanding the impact of light on the overall well-being of humans. For this reason, there are no specific design indications, but some references to the topic are starting to appear in building certification protocols, like WELL [7]. As concerns spaces like coffee houses or waiting rooms, they are designed to host other activities. However, it is not so uncommon to find in places like airports or train stations specifically designed areas where people can seat, recharge the batteries of their electronic devices, and use their laptops. In these cases, light is ad hoc studied and designed, and this habit is likely to get more spread in the next years. The situation is completely different for home environments. There are no specific standards containing prescriptions for residential lighting, even when considering only visual aspects. Moreover, very often the intervention of an expert in lighting is not required and the definition of lighting conditions is completely up to the homeowners, who make their choices based on their tastes and knowledge. This is true for all the spaces of a house, but, when dealing with home workstations, another problem must be faced. Not all the houses are provided with rooms that can be specifically devoted to work. Therefore, people work in spaces where other activities are generally performed and the lighting system has been set to fulfil requirements completely different from those of an office (kitchens, bedrooms, living rooms).
The Covid-19 spread has strengthened the interest about lighting in unconventional workplaces and especially in residential ones. The pandemic has made the home working phenomenon more widespread than could have been imagined before and the necessity to stay home long has demonstrated that the traditional way to design houses is not respondent to the new urgent requirements. Residential buildings are strictly planned for housing needs, the spaces are too narrow, and the number of rooms is too little [8]. People complained the lack of some spaces previously considered secondary and now got fundamental: proper doorways to organize with a built-in shoe cabinet or a wardrobe where stocking clothes used outside, open spaces such as balconies, terraces and courtyards and of course a specific space to adapt as a workstation [9], i.e. a space to have peace, confidentiality and efficiency, equipped with proper technology (pc and internet connection) [8] and a dedicated table and comfortable seat [10].
Despite all the connected difficulties, the tendency to work from home is likely to be the new normal, especially in mixed organizing forms of work coupling the use of standard and unconventional workplaces.
For this reason, workers must be made aware of the issues connected to the correct setting of the workplace and, especially, of those aspects that can affect their well-being, and, if not controlled, can determine negative effects on their health (visual systems problems, consequences due to incorrect posture, etc). Guidelines should be given, good practices should be spread and, when necessary, the employees should be provided with all the resources to guarantee a safe and comfortable working time [11].
Confirming the centrality of this theme, during the CIE Division 3 plenary meeting on June 29th, 2021, “Recommendations for home and smart working lighting” has been proposed as one of the topics to be analysed in future research activities.
In this context, it is really interesting the work by Ticleanu [12]. It discusses the main areas of concern related to home lighting and outlines general recommendations for a good set-up of residential lighting conditions, to limit detrimental effects and contribute to good health. To define effective guidelines and promote a culture of residential lighting, it is essential to know typical conditions inside housing buildings and the usual problems people face in setting home workstations. This is not an easy task, due to the extreme assortment of the possible configurations available for residential lighting systems. As previously mentioned, spaces in which workstations are set are different: ad hoc rooms, bedrooms, kitchens, and even corridors. Moreover, there is a wide variety of luminaires for domestic settings (ceiling-mounted, pendants, ceiling recessed, wall-mounted, floor and table luminaires or track-mounted spotlights) and used lamps vary a lot in terms of power, luminous flux, CCT and colour rendering [12].
For this reason, different research groups are focusing their efforts on collecting data referred to typical residential conditions, useful to understand people’s problems with lighting systems set up, evaluate their grade of consciousness about lighting themes, and then find strategies to spread a culture of residential lighting. Aslanoğlu et al. [13] administrated an internet-based survey in July-August 2020 through Google Survey across Poland, Turkey, the U.K., and Sweden, asking for information about daylighting and electric lighting conditions. Amorim et al. [14] collected data in Brazil and Colombia, to investigate occupants’ perception of the luminous environment in home offices and the influence of regional and personal characteristics. They found that professionals having a dedicated room for the home office are more satisfied with the visual environment; higher satisfaction is achieved with high lighting levels; strong reflections are associated with disturbing glare situations; daylight is more appreciated than electric light, but participants located between 20°S and 34°S latitude are less satisfied with the visual environment in the home office. Sarsak [15] spread an online survey, answered by 146 employees and computer users from different countries. Then they were provided with the ‘Computer Workstation Set-up: Self-Assessment Checklist’, a tool to help them maintain comfort, well-being, safety, and maximized performance. It included useful tips related to key computer workstation areas, such as the chair, the keyboard and mouse, the monitor, the computer table, the work surface size, and lighting. Cuerdo-Vilches et al. [11] launched two online questionnaires, one quantitative and the other qualitative among Spanish households during the spring 2020 lockdown. Through a survey, photographs, and narratives, the study evaluated the perceived adequacy of telework spaces and their specific characteristics (among which daylighting and electric lighting), the availability of digital resources and the internet. They also proposed an index to evaluate the overall adequacy of the telework stations called the Telework Space Adequacy Index (TSAI).
The repetition of similar studies in different countries is essential, for two reasons: 1) daylight is crucial to define the quality of the luminous environment and its availability depends on the geographical location; 2) the building culture differs around the world, so the typical lighting conditions can change according to the analysed place. For example, in [13] it was found that the most common type of used shading system is different depending on the country (curtains for Poland, U.K. and Sweden and blinds in Turkey).
Based on all these premises, the goal of the study is to investigate lighting conditions in home workplaces in the authors’ country (Italy), to investigate the typical characteristics of the luminous environment in private houses and to test people’s average awareness about their choices regarding lighting conditions setting. It must be underlined that Italy is an exemplary case of the recent spread of home working, indeed, more than 40% of people worked at home in 2020 [16], compared with a percentage lower than 5% in 2019 [17].
An online survey was spread among students and employees during the pandemic from April 2020 to January 2021. It contained questions about the characteristics of workstations, considering both daylight and electric light.
The paper is divided into the following sections: Section 2, reporting an overview of the smart-working phenomenon spread and furtherly underlining how crucial and timing is the treated topic, Section 3, describing the method, Section 4, showing the results and Section 5, reporting the conclusions.
2. The smart working phenomenon before and during the pandemic and the future possible developments – Focus on the European situation
2.1. The scenario before the pandemic
Already in the early 60s the American scientists Joseph C. R. Licklider e Welden E. Clarck theorized a public access worldwide computer network helping people in doing their job [18]. Then, in 1976 Jack Nilles coined the words “telecommuting” and “telework”, referring to the possibility of working from different places thanks to digital devices and internet connections. In the mid-90s, USA state governments started to implement telework policies specifically concerning state employees.
Despite this way of working spread in the United States since the ‘80s [19], it later expanded all over the world and in Europe as well [20]. Especially in recent years, promotion policies in this sense have been actuated in several European countries. In the United Kingdom the “Flexible Working Regulation” was issued in 2014 [21]. In France, the “Loi du Travail”, issued in 2016, focuses on workers’ right to disconnection [22]. In Italy telework was first introduced by the law n°191 of June 16, 1998 [23] for public administration employees, in 2004 for private employees by the “Accordo interconfederale” [24], but the modern meaning of smart working was introduced by Law n°81 of May 22, 2017 [25] for both public and private employees. Although different terminology and legislations in each country, the same main themes are flexibility, agility, and the possibility of working without time and/or place constraints for employees.
In Europe, home working has had a different spread depending on the specific country and has been increasing in the last decade [17]. It is practised in a double form: on one hand, it almost completely substitutes the traditional work, on the other hand, it is considered an opportunity to be sized only occasionally. According to Eurostat [17] in Europe it is mostly spread in this latter form (data referred to employed citizens, both self-employed and employees, and between the ages of 15 and 64). Only for some countries the percentage of people working at home is usually higher than the percentage of people who work at home only occasionally (Romania, Cyprus, Lithuania, Italy, Latvia, Spain and Malta). The five countries in which the home working growth has been higher from 2011 to 2019 are Sweden (+11.60%), Luxembourg (+10.70%), Finland (+9.50%), Estonia (+8.80%) and Malta (+8.20%) and the average European increase is equal to +3.25%. Eurostat [17] reports that in 2019, before the pandemic, the country for which the number of home workers is the highest is Sweden (37.20%), immediately followed by the Netherlands (37.10%). On the contrary, the percentage is really low, and far below the European average (16.50%), for Romania (1.40%) and Bulgaria (1.10%).
The diverse spread of the phenomenon in the different countries depends on several aspects. For example, the percentage of those working from home increases with the level of instruction [26]. Moreover, there are jobs amenable to be performed from home such as professional services, public sector activities, and finance. The opposite can be said for jobs in hotels and restaurants, agriculture, construction, and commerce [27,28]. So, the home working phenomenon is more prone to develop in a country mainly based on the tertiary sector.
Surely, working from home shows pros and cons; the pros concern a better work-life balance, savings in time and money for moving to traditional workplaces for workers, less pollution for the environment, and savings in money for office maintenance for employers [29]. The cons concern more stress for those who find it hard to divide time between work and personal life, for those who must care about babies at home [30], less sharing skills and experiences among co-workers, and more difficulties in communicating with colleagues [31]. A correct balance between working from home and a physical meeting among colleagues allows to benefit the pro and minimize the cons.
2.2. The scenario during the pandemic
All these previous observations became irrelevant with the spread of Covid-19. Since World Health Organization declared Covid-19 a pandemic on March 11 2020, all over the world governments prescribed physical distancing, imposed lockdowns, stay-at-home orders, travel restrictions, and office and school closures [32]. Therefore, home working transformed from a voluntary choice into a duty, suddenly spreading all over the world, obliging to work from home even people who have never considered home working as an option. In Europe, according to Eurofound research, 36.3% of those currently working in the EU began to work from home because of the pandemic [33]. The lowest percentage was observed in Romania (19.4%) and the highest in Finland (60.5%). As the United Kingdom left European Union in January 2020, home workers’ percentage is not included in Eurofound research, however, it has been estimated that the share reached 60% in 2020 [34].
This forced change of the working activities would seem to represent an epochal turning point in the way to conceive work. The number of those working from home is likely to stay high after the pandemic. Employees may request a continuance of this arrangement and employers may view working from home as a viable option to reduce costs associated with physical space [35].
On one hand, people have experienced a new way to organize their private and work activities, and it is not obvious that they will want to come back to their old life. In June 2020, Deloitte [36] conducted an online survey, that reached more than 10000 employees across seven European countries (France, Germany, Italy, Portugal, Poland, Spain, and the United Kingdom) aiming at evaluating in which way the Covid-19 pandemic has changed the way to conceive job. 34% of the interviewees answered that they expect more flexibility and autonomy to decide when and how to perform their work in the new normal and 32% of them declared to foresee an increased digitalization of their workplace. Data acquired by Eurofound [16] during February and March 2021 show a similar trend. They were obtained by interviewing people in EU 27. One of the questions was: “If you had the choice, how often would you like to work from home if there were no restrictions due to COVID-19?”. The 15.7% of the sample answered daily, the 30.6% answered several times a week, the 18.4% several time a month and the 24.3% never (the other respondent were divided between the answers Less often, I prefer not to answer and Due to the nature of my work I cannot work at home). So, people considering home working a good option, at least as an occasional opportunity, are higher (64.7%) than those preferring traditional work forms.
On the other hand, from the point of view of employers, the costs connected to the rent of offices are not negligible and according to [10] the Covid-19 has affected also the office market. The need to have bigger spaces to guarantee social distancing could bring to move offices to suburban areas where big buildings are more affordable or opt for renting desks in co-working spaces located in the suburbs near residential areas where employees live. Considering these obstacles, home working seems a possible solution even from the employers’ point of view.
All these observations confirm the criticalness of the home-working-connected themes, underlining the need to carry out specific studies.
3. Method of research
The research has been carried out on a survey sample made up of home workers and students. A clarification is needed. Worldwide in normal employment settings, there are many diverse types of flexible working arrangements, involving options related to where to work, when to work, and/or how to work, and different expressions are used to identify these flexible ways of working depending on their specific characteristics [37]. Despite the several definitions, a specific distinction between home working and smart working must be done. On one hand, it’s called smart working the practice of working in places other than the offices, only if there is a written agreement between the employed and the employer. On the other hand, when talking about home working, we refer to all people simply working at home, both smart workers and not. For example, self-employed can exercise their work at home because of their independence in choosing the place and time to work, but in this case, it is not a smart working practice. The research is referred to home workers in general, irrespective of the specific job contract since the goal is to investigate lighting conditions of the residential workplaces. Among the workers, also students were considered. Indeed, in Italy, students’ habits during the pandemic have strongly changed. Before the Covid 19, they used to follow the lessons in classrooms and often also the homework was done at the university, in specific spaces as libraries or students’ common rooms. So, only part of the studying activities was performed at home. On the contrary, during the pandemic, all the activities were transferred to residential spaces. Specifically, the most significant problem was to follow the lessons, that suddenly were all orgawornized in on-line format. For this reason, also students’ experience is relevant in this context.
The method applied in this study consists in analysing the answers to a questionnaire provided by people voluntarily participating in the research. Potential participants were all Italian homeworkers and students attending lessons from home. For this reason, only people in the age range from adulthood to retirement (i.e., from 18 to 67 years old) were involved; students under the age of 18 were excluded being minors.
A link to the online version of the questionnaire, made with Microsoft Office Forms, was randomly sent to people. Some potential participants were directly reached by the authors, such as students attending their classes, friends, colleagues, and family members. In addition, the questionnaire was further spread thanks to word of mouth and publications on socials. In this way, people living in different Italian regions were involved and took part in the research. Survey responses were collected between April 2020 and January 2021. During this period different seasons and weather conditions alternated. In this way information with different natural light scenarios was gathered.
The survey consisted of 7 parts. Part 1 regarded interviewees’ personal information such as gender, age and home place usually occupied for home working. There were not questions about educational level, social background, and basic knowledge about light and lighting-connected themes, since one of the goals of the research was to investigate the habits about light of not-expert people. The next three parts are about natural light, particularly regarding natural light’s characterization (part 2), control (part 3) and overall evaluation (part 4). The last three parts concern artificial light’s characterization (part 5), control (part 6) and overall evaluation (part 7). Finally, after these 7 parts, a final question was asked: “Do you consider it useful to acquire further information concerning lighting features, its right use and its influences on humans and the natural environment?”. Structuring the survey in this way, information about both daylight and electric light are obtained, investigating the overall aspects connected to the topic, and also acquiring data about people’s consciousness and interest in lighting-connected themes. Details about the structure of the questionnaire are reported in Table 1.
Table 1
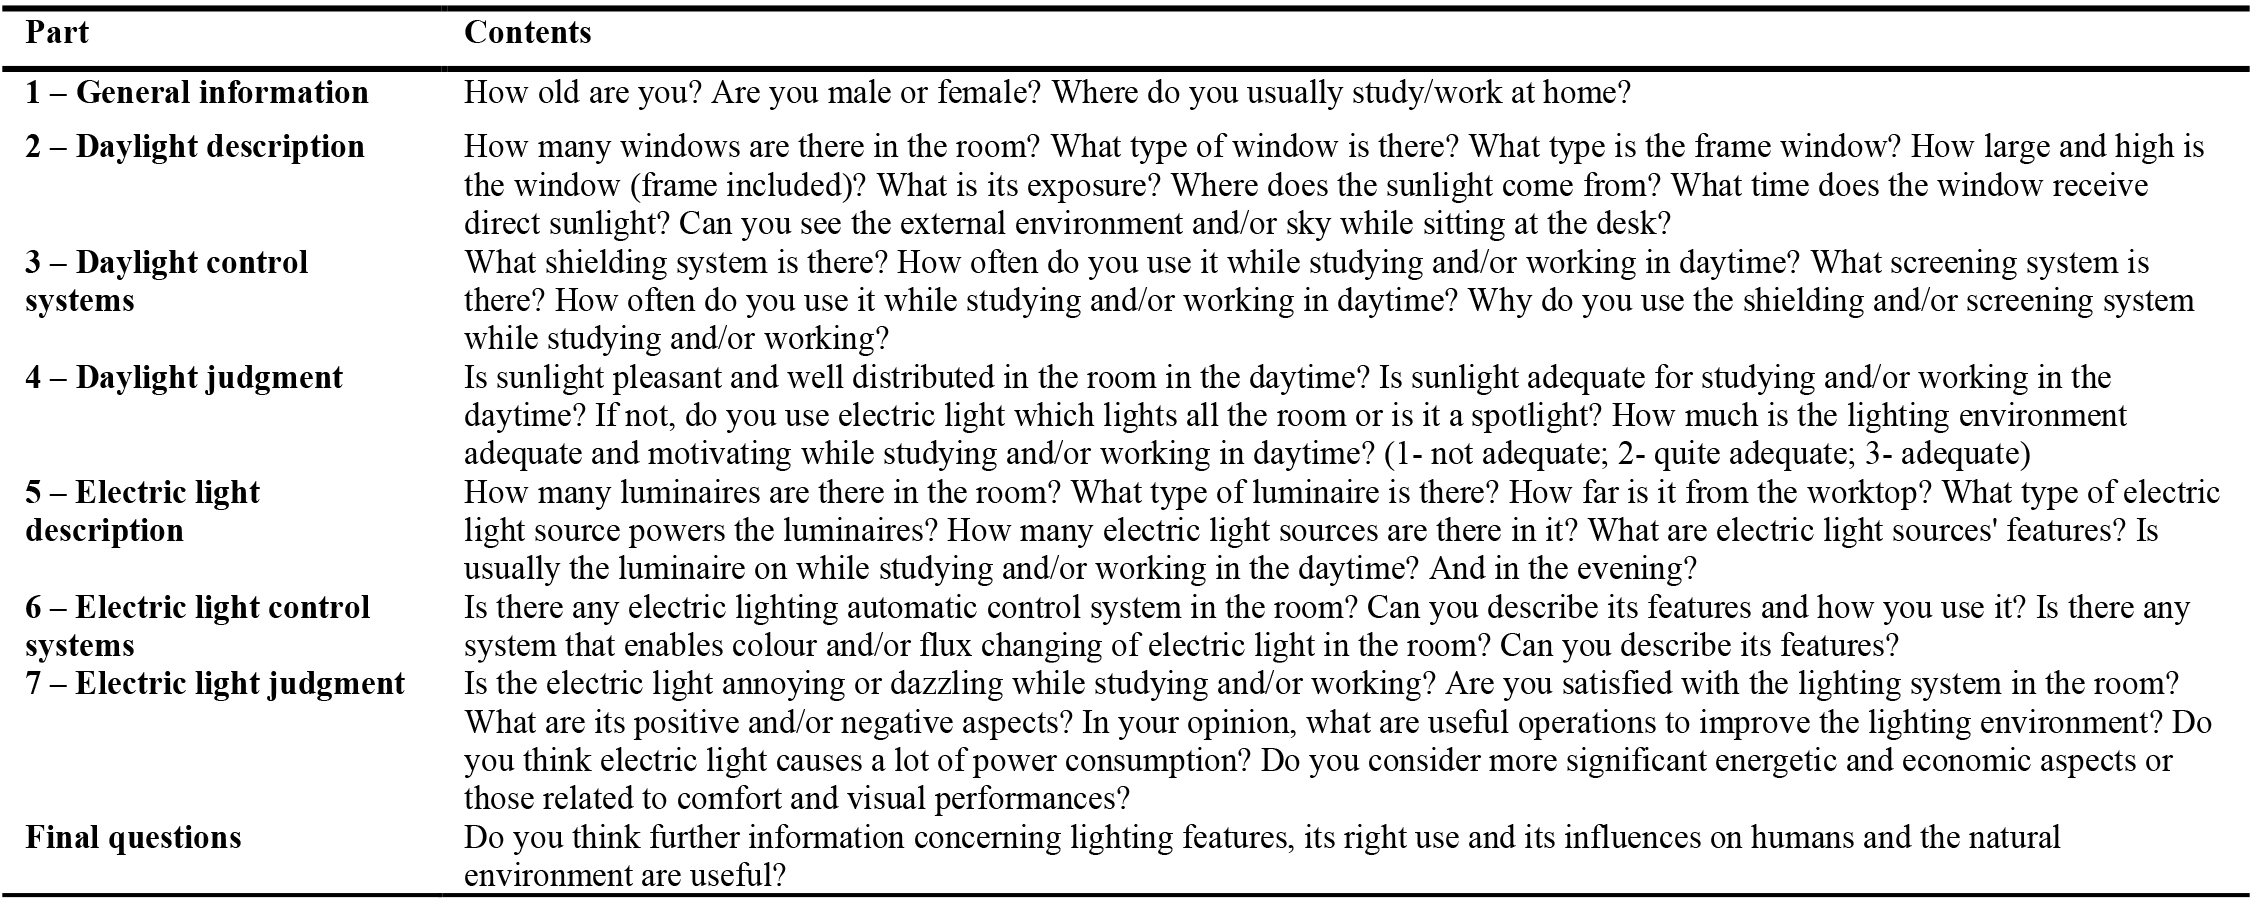
Table 1. Scheme of the survey.
The test was mainly made of closed-ended questions. In some cases, also the option “other” was available and people can type freely a customized answer. For example, this happened for questions about the typologies of the windows (Part 2). In this case, the alternatives provided by the authors represented the most common typologies used in Italy, however, to be sure to not exclude other typologies, the answer “other” was included in the list of options as well. The same approach was used also for the questions about the typologies of screening and shading systems (Part 3), and the typologies of the luminaires (Part 5).
Sometimes brief or extend open-ended answers were required. On the one hand, the brief ones were used when the possible options were extremely various, for example in the case of the dimensions of the windows (Part 2) or of the characteristics of the sources (their number, luminous flux, and power – Part 5). On the other hand, extended open-ended questions were used to obtain information about the frequency and the reason for the use of screening and shading systems (Part 3), the characteristics of the automatic control systems of electric light if present (Part 6), and the satisfaction with the lighting system and possible operations to improve it (Part 7).
Results were exported to Excel and analysed. The questionnaire was answered by 351 people in total. Before starting the analysis of the sample, 5 participants were excluded, 2 of them because of their age (one was a minor, aged 13, and the other was retired, aged 82) and 3 because the answers they had provided were conflicting and/or inadequate. Therefore, a total of 346 tests were analysed.
The choice of the number of interviewees was based on the following considerations. In similar previous studies, the extension of the analysis sample differed considerably. For example, Aslanoğlu et al. [13] analysed a sample of 60 people, 15 for each considered country (Poland, Turkey, UK and Sweden). The small number was justified, since the interviewees were expert in lighting. In [15] 146 people coming from different countries were interviewed, whereas in [11] 1271 people living in Spain were involved in the questionnaire. Considering these discrepancies, it was decided to establish the number of interviewees in order to obtain a high confidence interval and a low margin of error. Given that at the moment of the survey the reference population made of people working and studying from home in Italy is composed of about two and a half million people (homeworkers [38] plus students [39]), the analysed sample of 346 subjects can be considered representative and adequate for the complexity of the problem. Indeed, it provides a confidence interval equal to 95%, with a margin of error of 5.3% (data calculated according to [40]). Moreover, as it will be shown in the Results section, the sample was selected so that the ratio between the number of homeworkers and students was similar to that of the national population.
4. Results
In the following paragraphs, results will be presented and divided into sections according to the original structure of the survey (see Table 1). A clarification about the structure of the survey must be done as concerns parts 2 and 3 (description and control of daylight) and parts 5 and 6 (description and control of electric light). In parts 2 and 3, questions about windows characteristics are reported. If in a room more than one window was present, people had to answer the same questions two or three times, depending on the specific number of the windows. The same approach is applied in parts 5 and 6 regarding the characteristics of luminaires. If in a room more than one device was present, people had to answer the same questions two or three times, depending on the specific number of the devices.
As can be seen in Table 2, the 346 rooms described are divided into rooms without windows, rooms with one window (79.2%), rooms with two windows (6.0% with windows having the same exposure and 9.0% with the windows on different sides) and rooms with three windows (0.9% with all the windows on the same side and 3.2% with windows on different sides). Considering that the one window case is the most recurrent, recovering almost 80% of the collected data, the results are discussed in detail. For the other cases (two or more windows) results are described in general in the following paragraphs, but the details are in-depth represented in graphs reported in the Appendix. As for the electric light, a similar approach is followed. As can be seen in Table 3, the 346 rooms described are divided into rooms with one, two and three electric luminaires respectively. In this case, the percentage referred to one and two luminaires is almost the same. So, these two cases are analysed in detail and the case of the three luminaires is reported in the Appendix.
Table 2
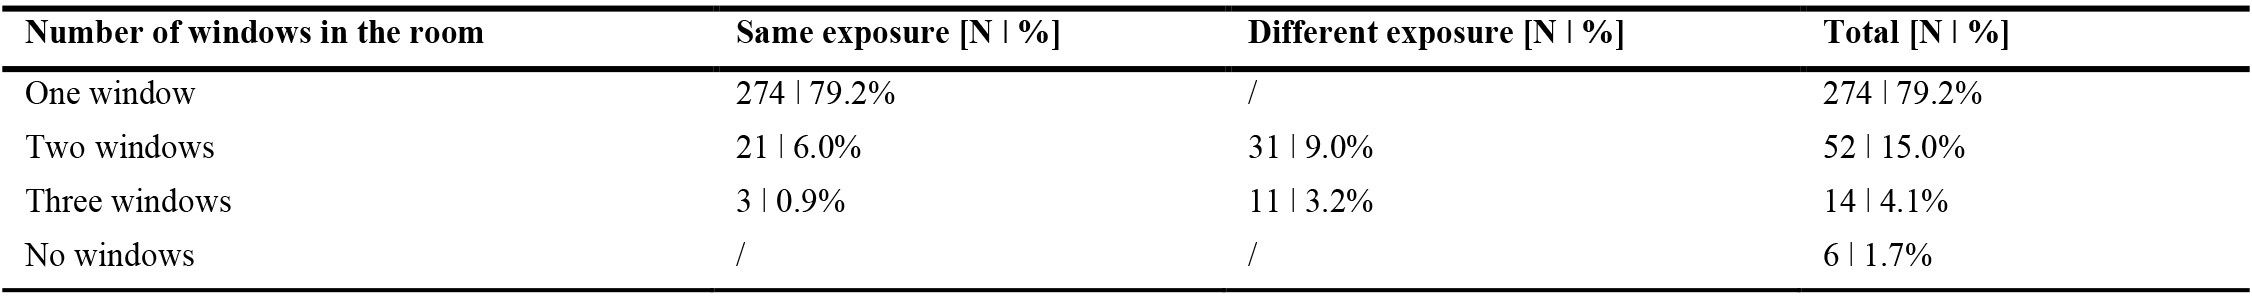
Table 2. Scheme of the survey.
Table 3
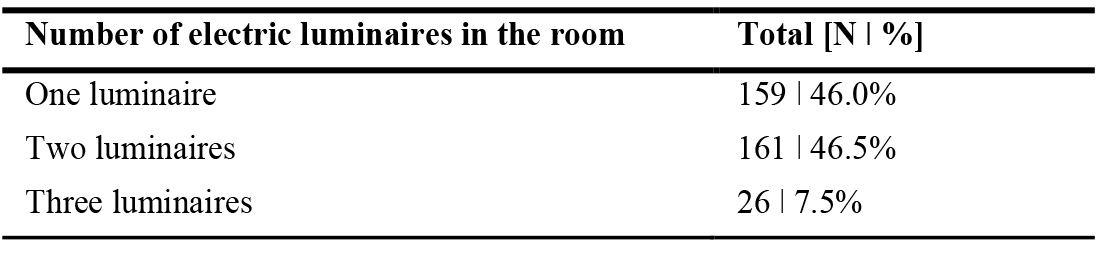
Table 3. Rooms divided according to the number of luminaires; percentages refer to the total number of rooms analysed (346).
4.1. Part 1: General information
As previously mentioned, the survey sample is made up of 346 people, 182 females and 164 males, aged between 20 and 67 as reported in Fig. 1(a), in which the table shows, for each age range, the percentage of the interviewees, the average age, and the standard deviation. All the considered age ranges are well distributed between men and women. Moreover, the most populated age range is the 20-30 one, due to the big presence of students.
Figure 1
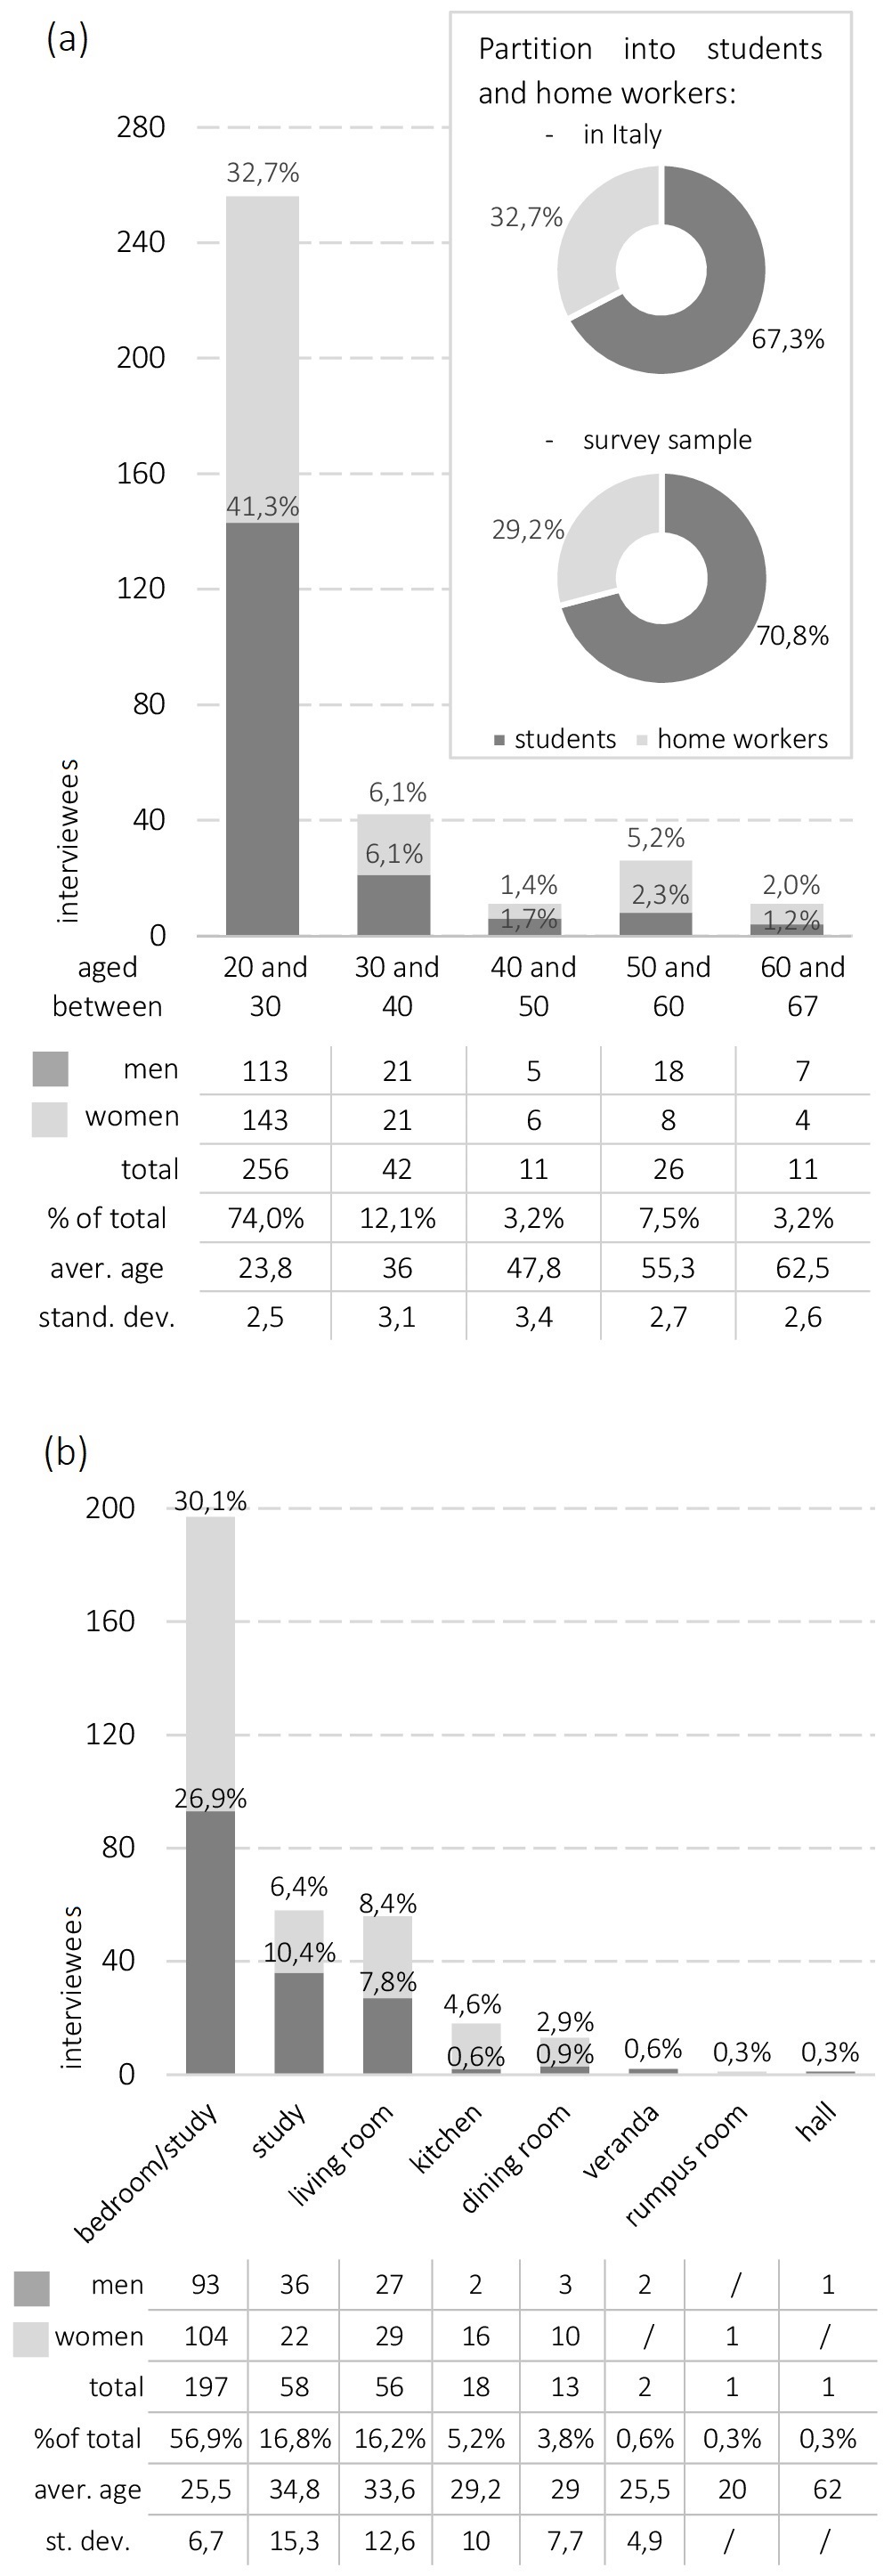
Fig. 1. Survey sample distribution according to the age and sex (a), and the room used for home working (b); percentages refer to the total number of interviewees (346).
However, as shown in Fig. 1(a) the survey sample’s partition into students and home workers is representative of the Italian population. Indeed, according to [38] the total number of Italian home workers is 841 896, and as reported by [39] university students are 1 730 563. The ratio between them is 0.486. According to Almalaurea’s research, the average age of graduation is 27.8 [41]. It was assumed that over the age of 28 interviewees are not students anymore. In the survey sample people aged between 20 and 28 are 245 while those aged between 29 and 67 are 101. The ratio between them is 0.412.
In Fig. 1(b) the survey sample is distributed according to the space where people perform home working activities. It must be underlined that, if more than one space of the home was used for home working activities, the interviewee had to answer by indicating the room which is mostly occupied during the day. Only 16.8% of people can work in a study, whereas the others perform their activities in different spaces of the house, arranged for home working. The space characterized by the highest percentage was bedroom/study (57% of the sample) probably because young people’s rooms (i.e., students) are planned as multifunctional spaces and are designed for both rest and study. Moreover, as shown in the graph, almost all rooms are occupied by both women and men equally, except for kitchens and dining rooms occupied by women predominantly.
4.2. Part 2: Daylight description
Figure 2 shows windows’ characteristics in rooms with one opening, specifically describing the typology of window (Fig. 2(a)), the material of the frame (Fig. 2(b)), area (Fig. 2(c)), exposure (Fig. 2(d)), the position of the desk referring to the window (Fig. 2(e)) and view out (Fig. 2(f)).
Figure 2
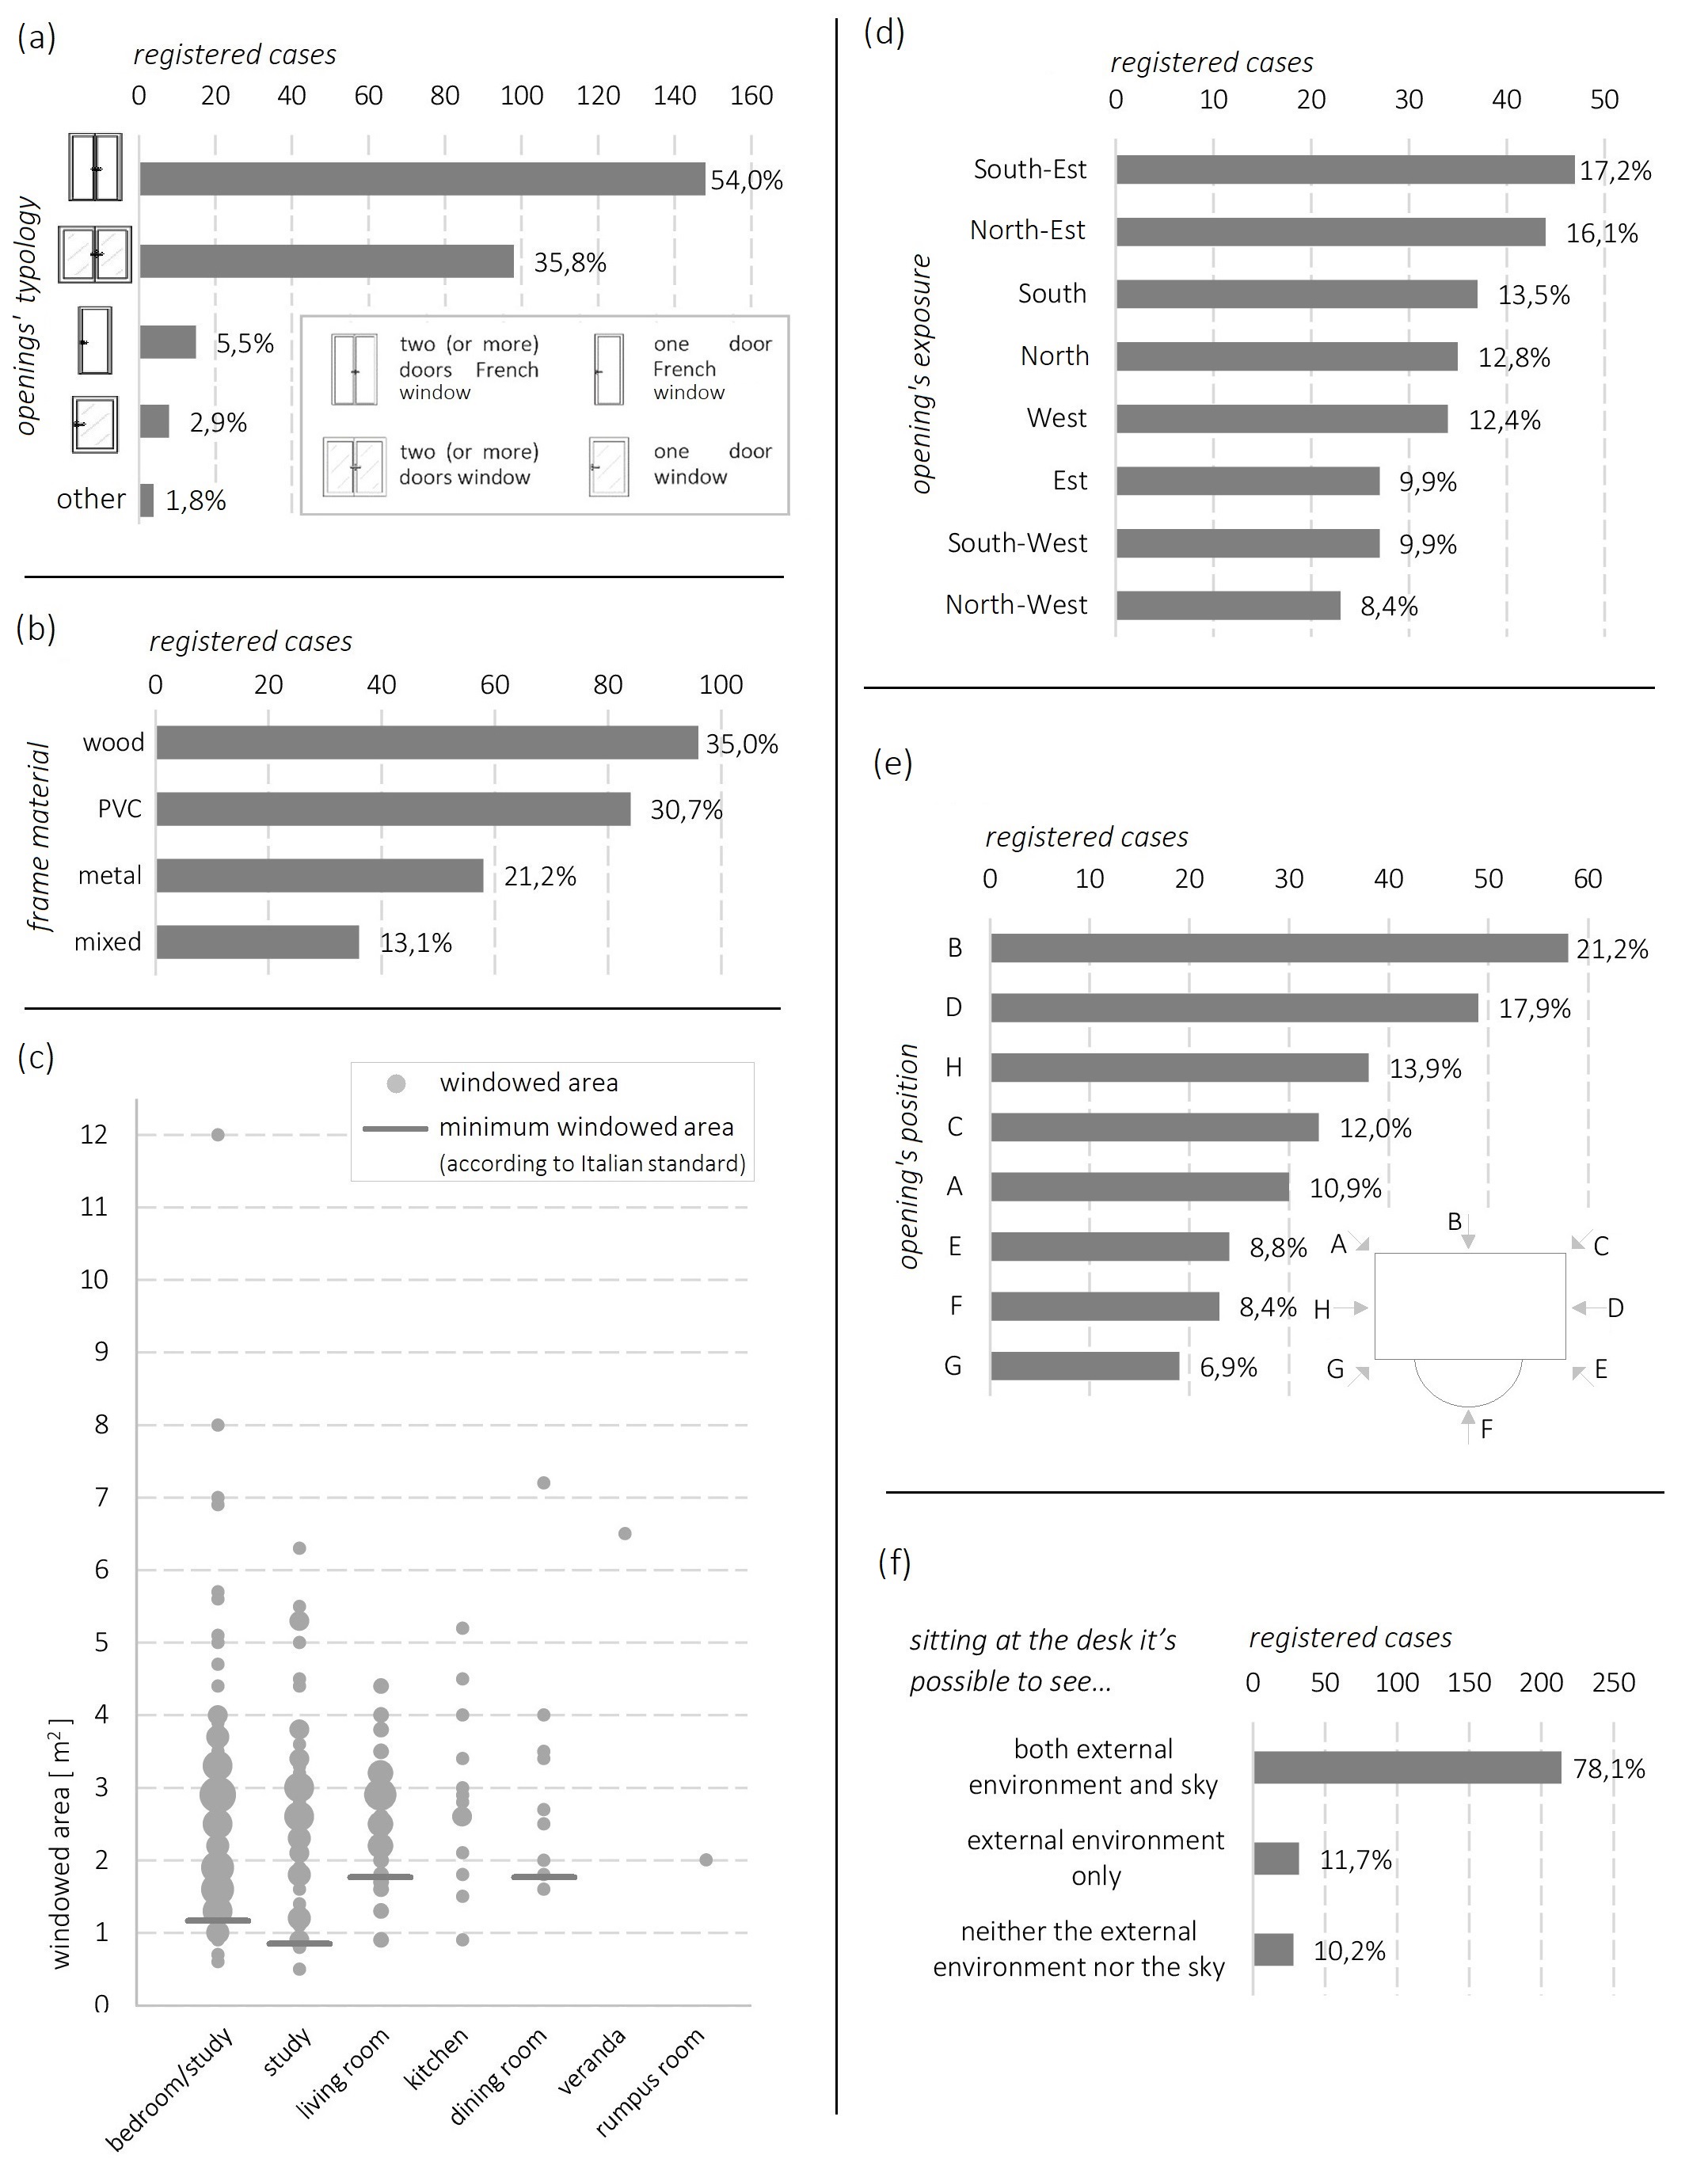
Fig. 2. Windows’ characteristics in rooms with one opening: typology of window (a), material of the frame (b), area (c), exposure (d), position of the desk referring to the window (e) and view out (f); percentages refer to the number of rooms with one opening (274).
The most common opening types are two (or more) doors French windows and two (or more) doors windows, followed by one door French windows and one door windows. The most common frame is a wooden frame, followed by PVC, metal and mixed frames (see Fig. 2(b)). Windowed areas can widely vary between 1.8 m2 and 4.0 m2, few rooms have a bigger or smaller surface. In Italy, regulations [42] prescribe a minimum floor area for the different home spaces and it is also prescribed that the windowed area should be at least 1/8 of the floor area. This minimum windowed area for each function is indicated in Fig. 2(c) and as it is shown in the graph. Quite in all the rooms it is respected and, in most cases, is significantly higher than the minimum limit. As for the exposure (see Fig. 2(d)), it doesn’t emerge a predominant one, even according to rooms type: bedrooms, studies, living rooms, kitchens and dining rooms are divided quite equally between all the exposures, while verandas and rumpus rooms are only a few cases so it is impossible to make considerations on them. Generally, the desk is positioned in a way such to receive daylight from the front or by the side, someone receives daylight from behind (see Fig. 2(e)). While sitting at the desk, most interviewees can see both the external environment and the sky through the window (78.1 %), or the external environment at least (11.7%). Only someone (10.2%) can see neither the external environment nor the sky (see Fig. 2(f)).
As for rooms with two openings (see Appendix for in-depth data), the most common configurations are the couple of one “two (or more) doors French windows” and one “two (or more) doors windows”, or two “two (or more) doors French windows” or two “two (or more) doors windows”. Quite in all cases both the openings have the same frame material (in that order, wooden, metal, PVC and mixed). The windowed areas can widely vary between 2.0 m2 and 6.0 m2. Few rooms have a smaller one, while often a bigger one is reported. Only for one bedroom the minimum windowed area is not respected. Also, in this case, a predominant exposure does not emerge, even according to room type, nor a preferential positioning of the workstation relative to the windows. While sitting at the desk, most interviewees (80.8%) can see both the external environment and the sky through one window at least, 9.6% can see the external environment only through one window at least, and to the same extent 9.6% people can see neither the external environment nor the sky. More details are reported in the Appendix.
Only 14 cases with three windows are observed, so it is difficult to infer general considerations. In any case, the recorded results are reported in the Appendix for completeness.
4.3. Part 3: Daylight control
Figure 3 shows results related to shielding and screening systems in rooms with one opening (systems filtering or redirecting light are defined as shielding systems, while those completely excluding daylight entrance are defined as screening systems). Specifically, Fig. 3 reports if these systems are installed or not in the analysed rooms (Fig. 3(a)), the typology and the frequency of use (Fig. 3(b)) and the reason why they are used (Fig. 3(c)).
Figure 3
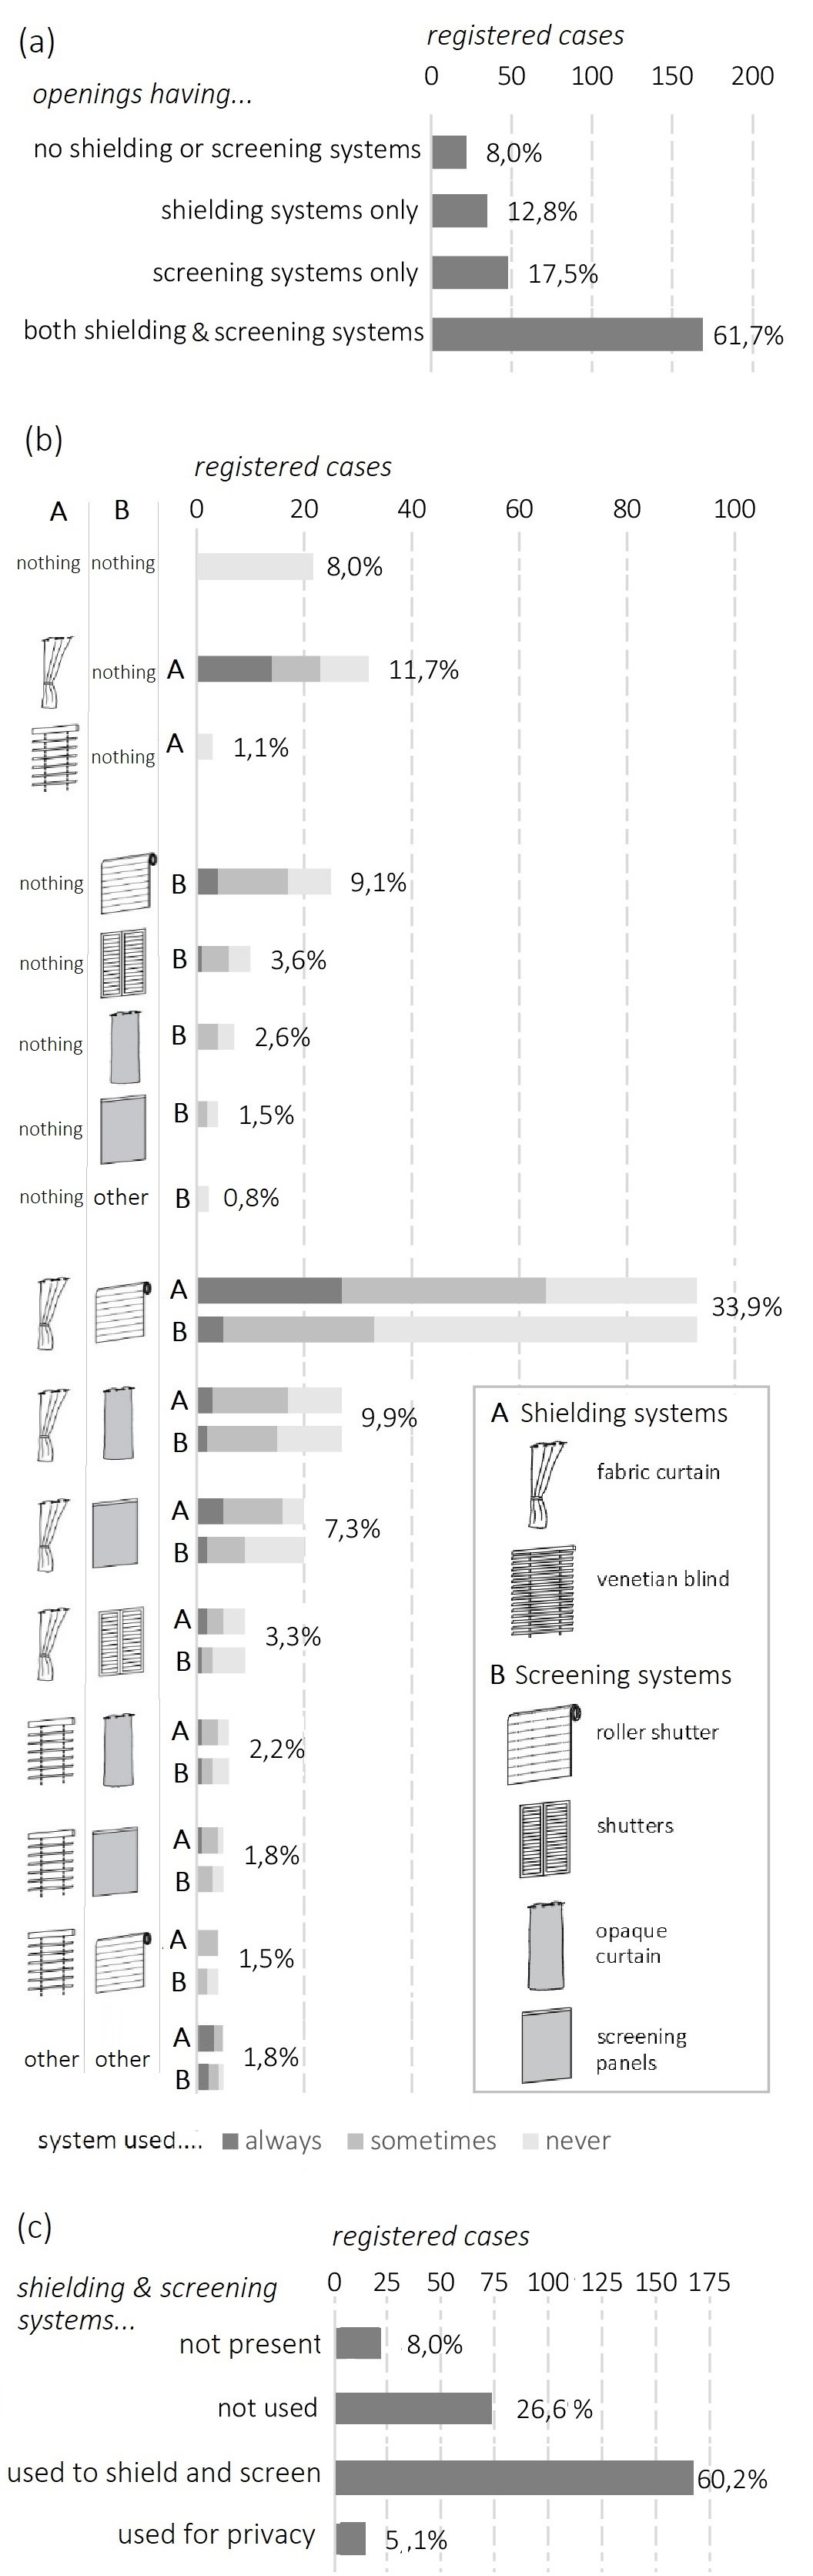
Fig. 3. Shading and screening systems in rooms with one opening: presence of the systems (a), typology and frequency of use (b), reason why they are used (c); percentages refer to the number of rooms with one opening (274).
For more than half of the rooms (61.7%) both shielding and screening systems are present, sometimes shielding systems only (12.8%) or screening systems only (12.8%), while in the 8.0% of the cases there are neither shielding nor screening systems. Fabric curtains and roller shutters are the most common shielding and screening systems respectively. Indeed, fabric curtains are used in 32 cases on the 35 openings with shielding systems only, roller shutters are used in 25 cases on the 48 openings with screening systems only, while when both systems are present, their combination is used in 33.9% of the total cases. Note that shielding systems are more used than the screening ones. In most cases (60.2%) shielding and screening systems are used to control daylight, sometimes they are used because of privacy reasons (5.1%) and often they are never used (26.6%).
As for rooms with two openings, in more than half of the cases (59.6%) both shielding and screening systems are present. In most cases (63.5%) shielding and screening systems are used to shield or screen daylight, sometimes are used because of privacy reasons (5.8%) and often are never used (21.2%). The combined use is more complex to describe since in the same room the two windows are often equipped with different systems and several diverse configurations are present. In any case, all the details are reported in the Appendix together with information related to the case of rooms equipped with three windows.
4.4. Part 4: Overall daylight evaluation
Figure 4 shows results related to overall daylight evaluation expressed by people occupying rooms with one window.
Figure 4
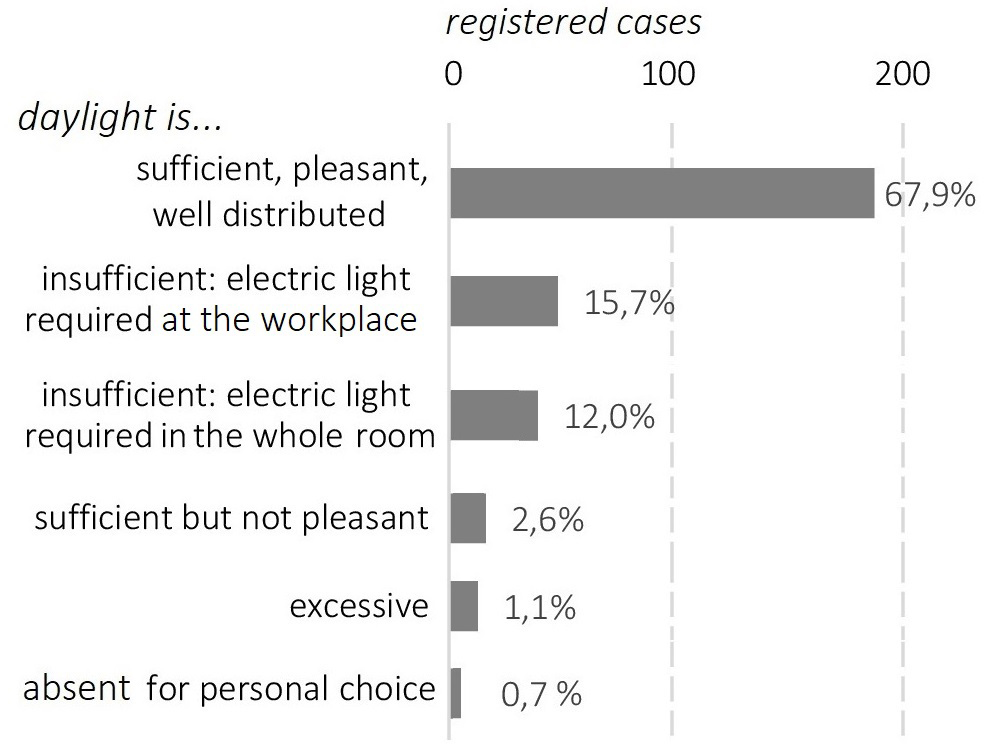
Fig. 4. Daylight overall evaluation in the case of rooms equipped with one opening; percentages refer to the number of rooms with one opening (274).
Almost all the interviewees consider daylight as sufficient, pleasant, and well distributed during the day; in three cases (1.1%) people complain about excessive daylight levels. However, cross-checking the data with those referred to the windowed area and screening and shielding systems, it has been found that in these cases there are not shielding systems and for two of them the windowed area is very wide (4.0 m2 and 7.2 m2). Often people consider daylight as insufficient, but it was verified that 53.9% of the interviewees who expressed this judgment use always screening or shading systems both for shading daylight and for privacy issues (the percentage is the same in both the cases of rooms with one and two openings). In this part of the test, people can freely describe the problems connected with daylighting. Many people have difficulties in managing the incoming light and screening it, but very frequently interviewees complain about nearby buildings or protruding upper balconies which block daylight, or about openings’ inadequate exposure. As for the people occupying rooms with two and three openings, the major of them judge daylight as pleasant and well distributed during the day (75.0% and 92.9% in the case of people occupying rooms with two or three openings respectively) as it can be seen in the Appendix.
4.5. Part 5: Electric light description
Figure 5 shows characteristics of the electric light in the case of rooms equipped with only one luminaire, its type and distance from the worktop (Fig. 5(a)), the number of sources for each luminaire and the type of source (Fig. 5(b)), CRI (Fig. 5(c)), colour tone (Fig. 5(d)), luminous flux (Fig. 5(e)) and power (Fig. 5(f)) are reported.
Figure 5
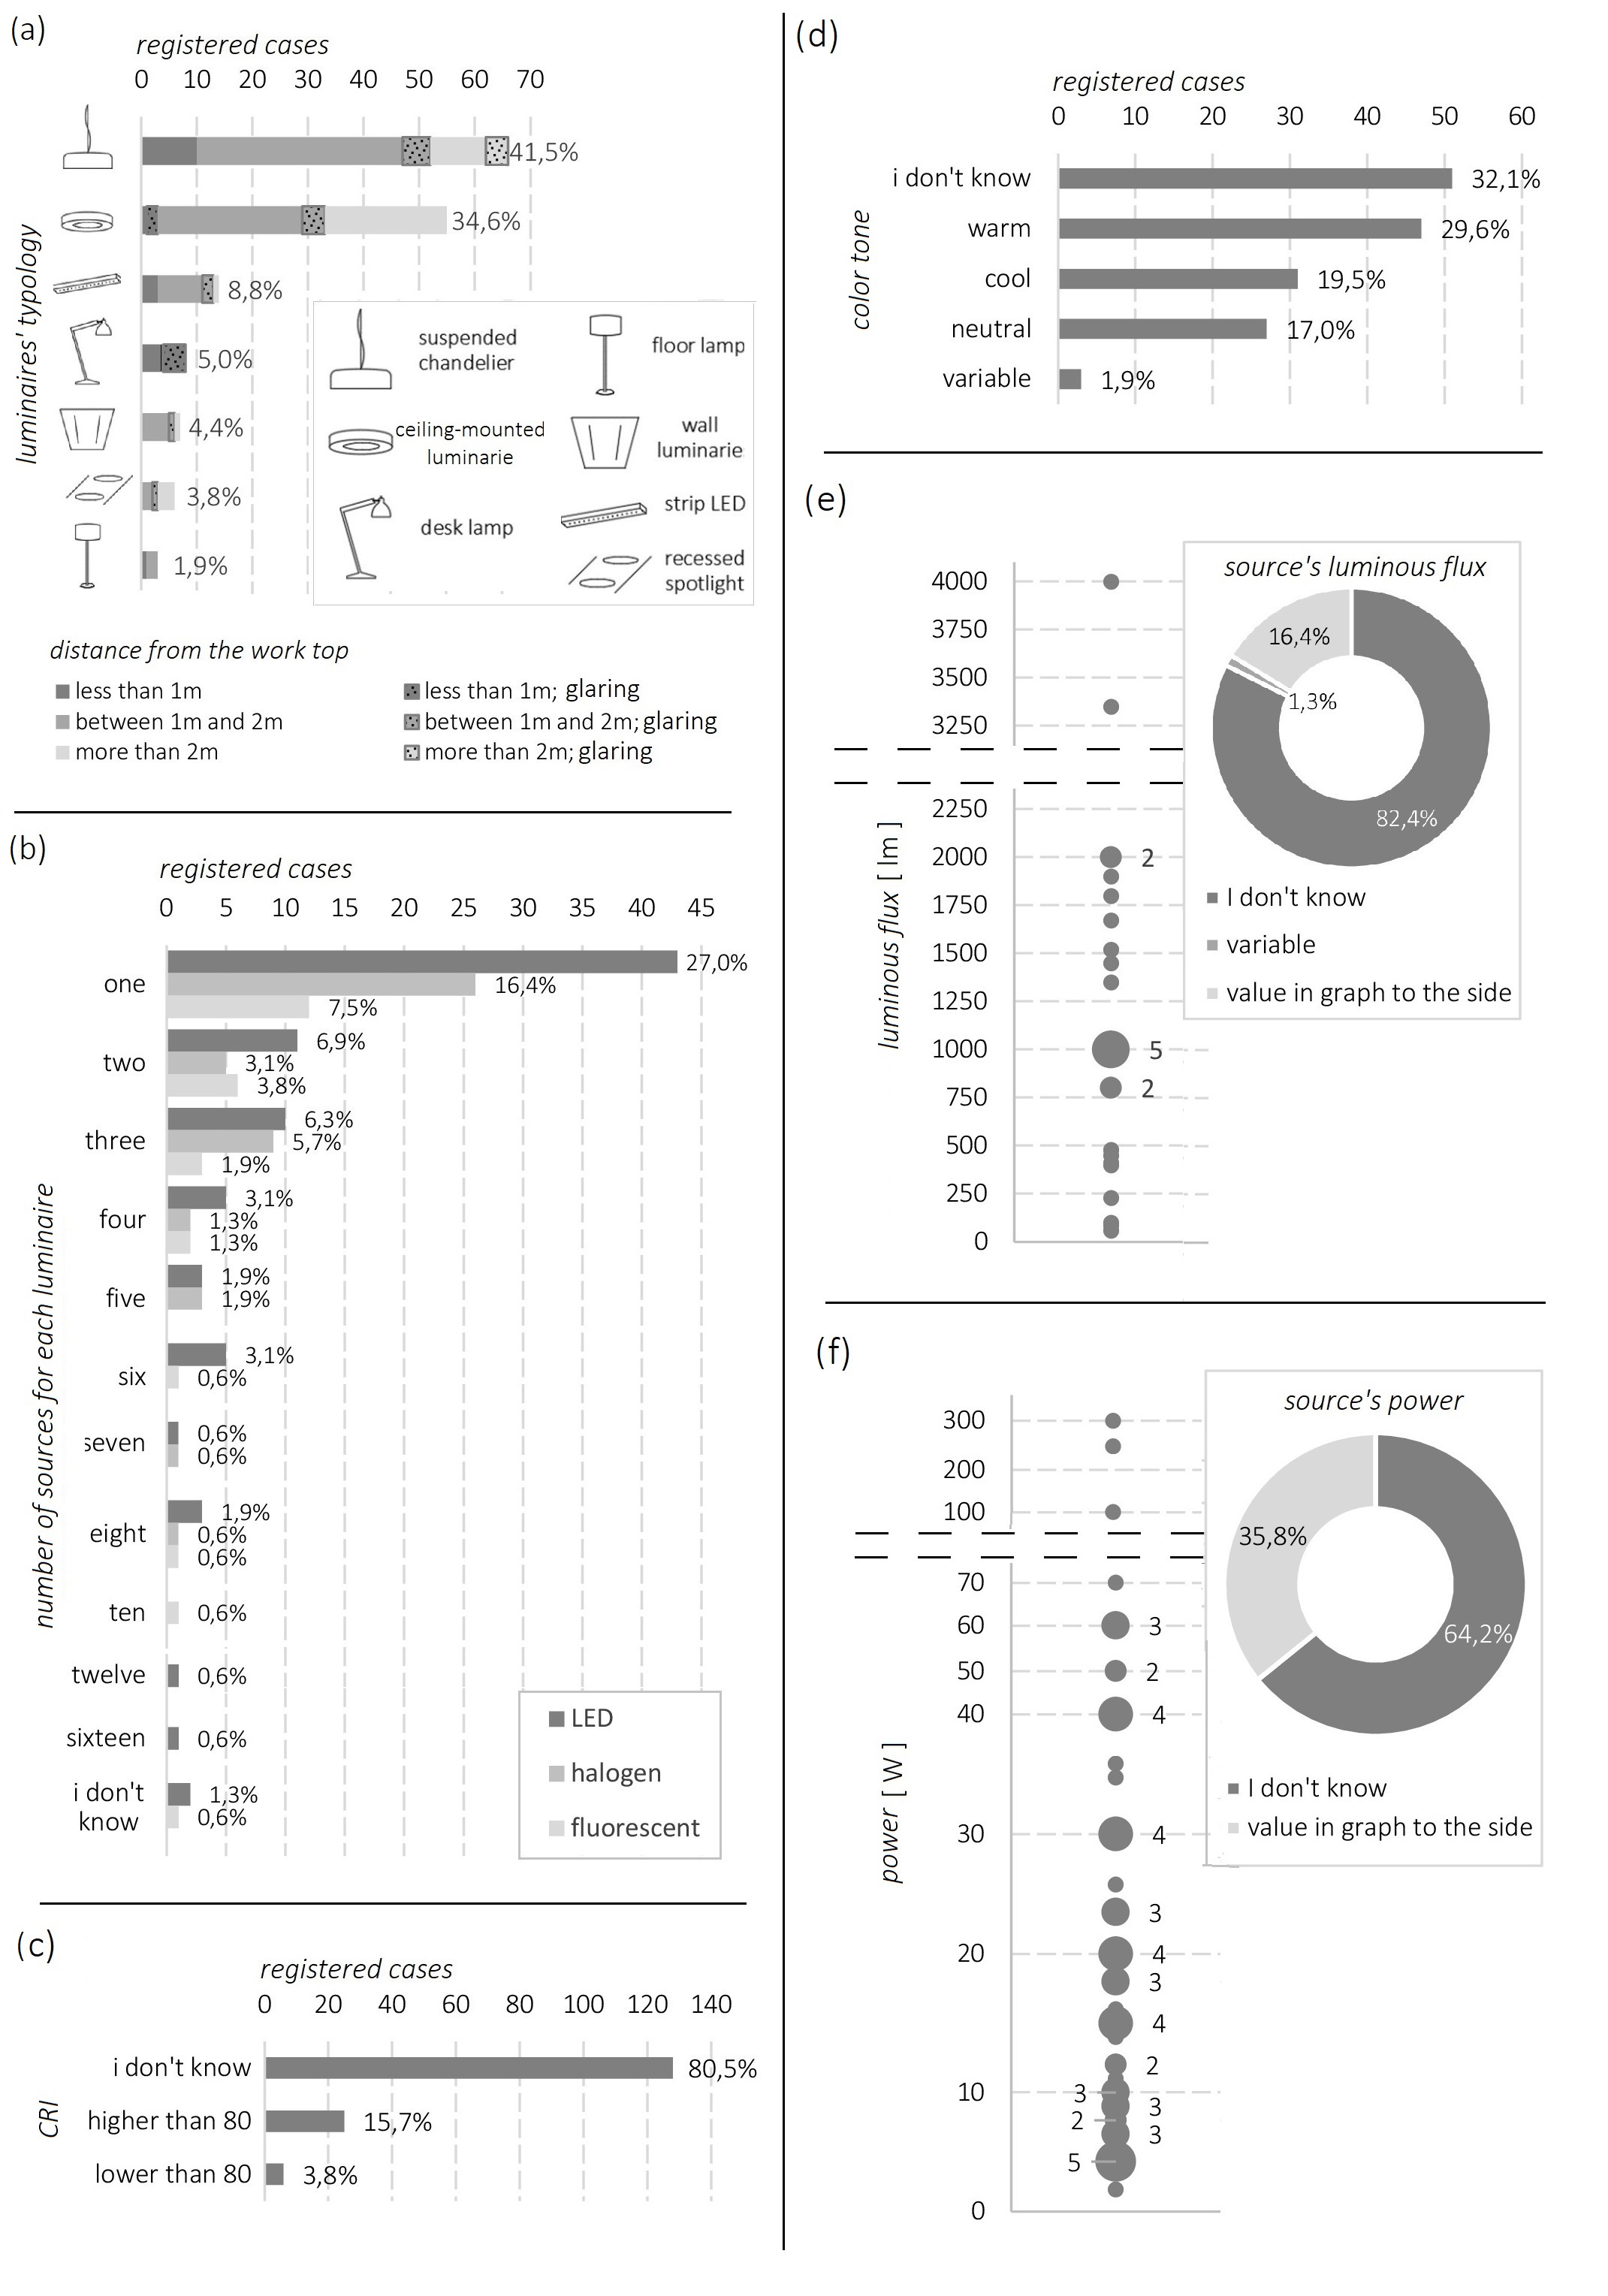
Fig. 5. Characteristics of the luminaires in rooms equipped with only one luminaire: typology (a), number of sources for each luminaire and type of lamp (b), CRI (c), colour tone (d), luminous flux (e) and power (f). Percentages refer to the number of rooms with one luminaire (159). In (e) and (f), the numbers in the circles indicate the number of registered cases, where the number is not indicated only one case was observed.
Suspended chandeliers and ceiling-mounted luminaires are the most common electric lighting devices, used in 41.5% and 34.6% of cases respectively; strip LED, desk lamps, wall luminaires, recessed spotlights and floor lamps are less used when there is only one luminaire. In Fig. 5(a), luminaires are divided according to their distance from the desktop and whether they are glaring or not. Note that, except for suspended chandeliers, glaring luminaires are those closer to the occupants, especially desk lamps (half of them are judged as glaring). As for the used lamps, more than half of them are equipped with LED (52.5%), whereas halogen and fluorescent sources are used in 29.5% and 17.0% of cases respectively. As it can be seen in Fig. 5(b), in half of the cases (50.9%) there is one electric light source for each luminaire, while two and three electric light sources for each luminaire are both present in the 13.8% of the cases. Sometimes a higher number of bulbs for each luminaire is reported. In the 9.1% of cases interviewees couldn’t indicate the number because of the luminaires’ design.
As for the technical characteristics of the sources, a lack of knowledge emerges since few people can indicate the electric sources’ colour tone and even fewer people can indicate their colour rendering index, luminous flux and power as shown in Figs. 5(c)-(f). Considering the cases for which the information is given, a prevalence of warm lights and CRI higher than 80 is observed. The luminous flux varies from 60 lm to 4000 lm and the power from 3 W to 70 W.
Figure 6 shows the same information as Fig. 5 referring to the case of rooms equipped with two luminaires. Combinations of suspended chandeliers with desk lamps or ceiling-mounted luminaires with desk lamps are present in most cases (38.5% and 23.6% respectively). Couples of ceiling-mounted luminaires, couples of desk lamps, and combinations of ceiling-mounted luminaires with recessed spotlights, wall luminaires with strip LEDs, wall luminaires with floor lamps, recessed spotlights with desk lamps are counted one time for each, representing altogether only the 3.7% of all cases (see Fig. 6(a)). Also, in this case, glaring luminaires are those closer to the occupants, especially desk lamps (see Fig. 6(a)). Considering all luminaires (322 in 161 rooms) LED lamps are the most recurrent (53.4%) whereas halogen and fluorescent sources are used in the 34.8% and 11.8% of cases respectively (Fig. 6(b)). In quite half of the cases (47.2%) one electric lighting source for both luminaires in the same room is installed, often one of them is equipped with one source and the other with two, three and four sources (in the 11.2%, 9.9% and 7.5% of all cases respectively). Other combinations are less frequent. The same lack of knowledge about the characteristics of electric light emerges in this case as well. Only few people can indicate the electric sources’ colour tone and even fewer people can indicate their colour rendering index, luminous flux, and power as shown in Figs. 6(c)-(f).
Figure 6
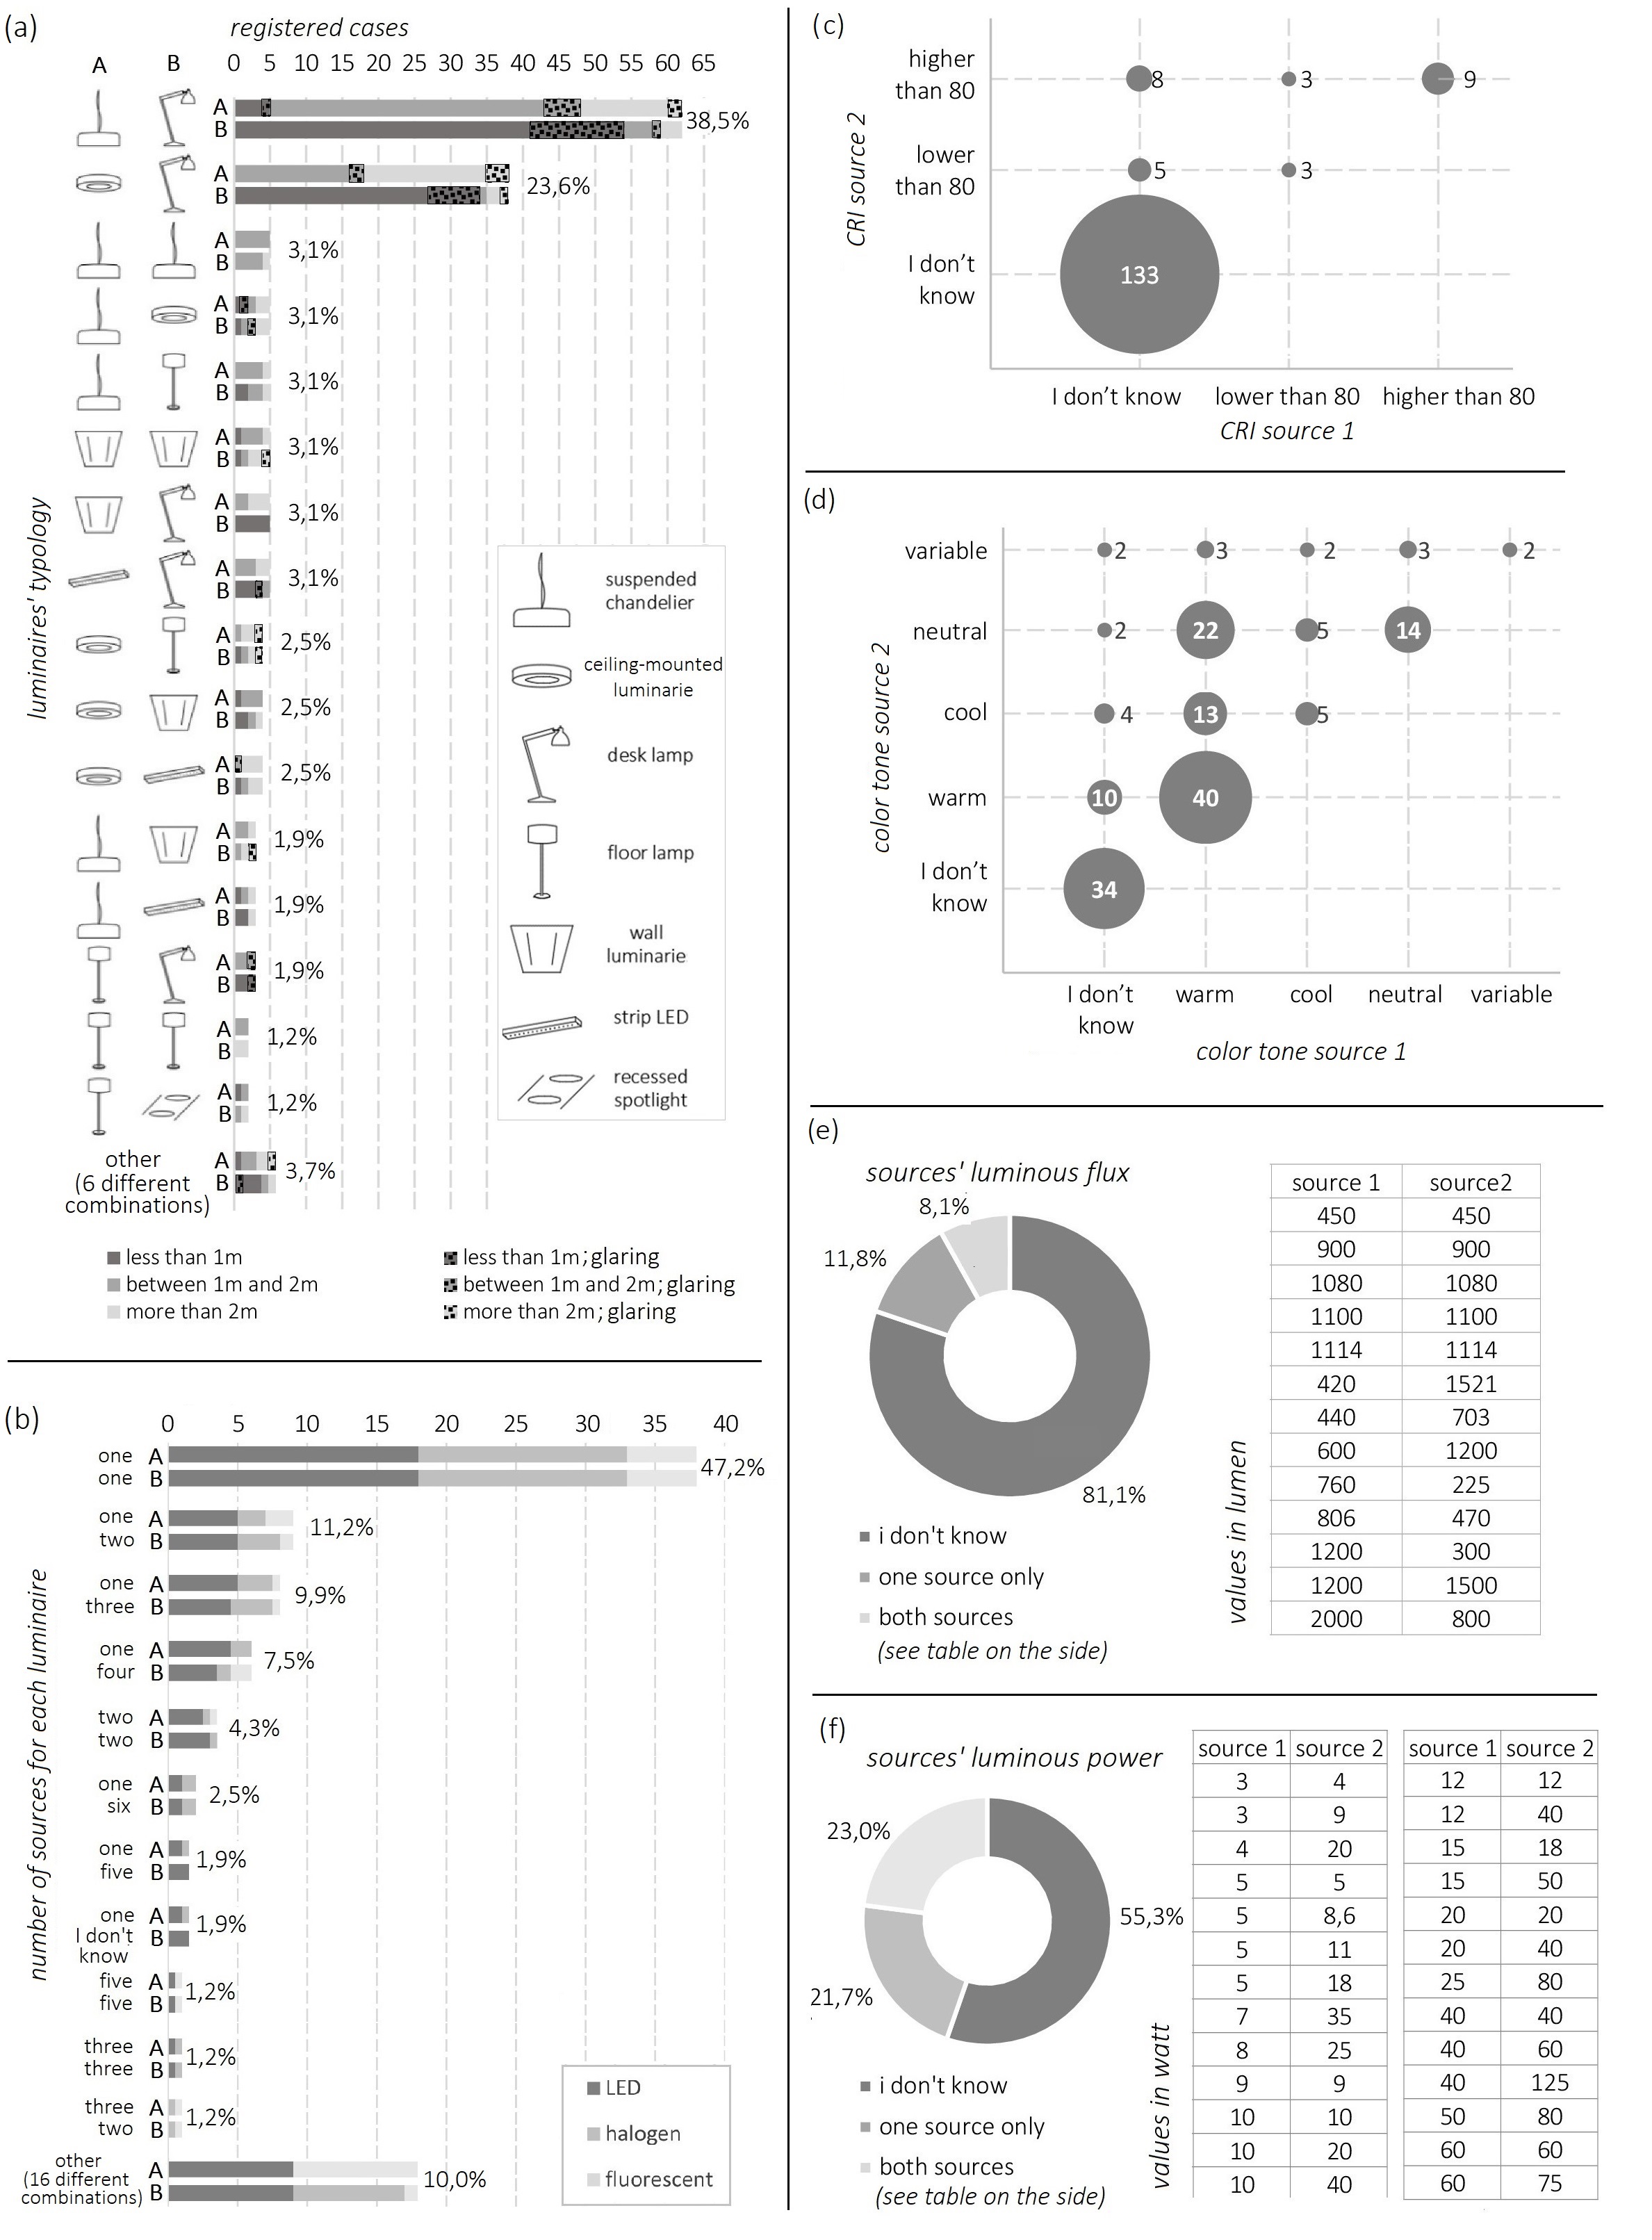
Fig. 6. Characteristics of luminaires in rooms equipped with two devices: typology (a), number of sources for each luminaire and type of lamp (b), CRI (c), colour tone (d), luminous flux (e) and power (f). Percentages refer to the number of rooms with two luminaires (161). In (c) and (d), the numbers in the circles indicated the number of registered cases, where the number is not indicated only one case was observed.
Data referred to rooms equipped with three luminaires are reported in the Appendix. In any case, general observation can be done. Suspended chandeliers, ceiling-mounted luminaires and desk lamps are the most common devices, variously combined to each other and other luminaires. LED lamps are used in 52.6% of all the luminaires in the room. Knowledge about the characteristics of sources is scarce in this case as well.
4.6. Part 6: Electric light control
Figure 7 reports data about the management and control of electric light in rooms equipped with only one luminaire and specifically the frequency of use of the electric light (Fig. 7(a)), the presence or not of automatic control systems (Fig. 7(b)) and the typology of changing colour and/or flux systems (Fig. 7(c)).
Figure 7
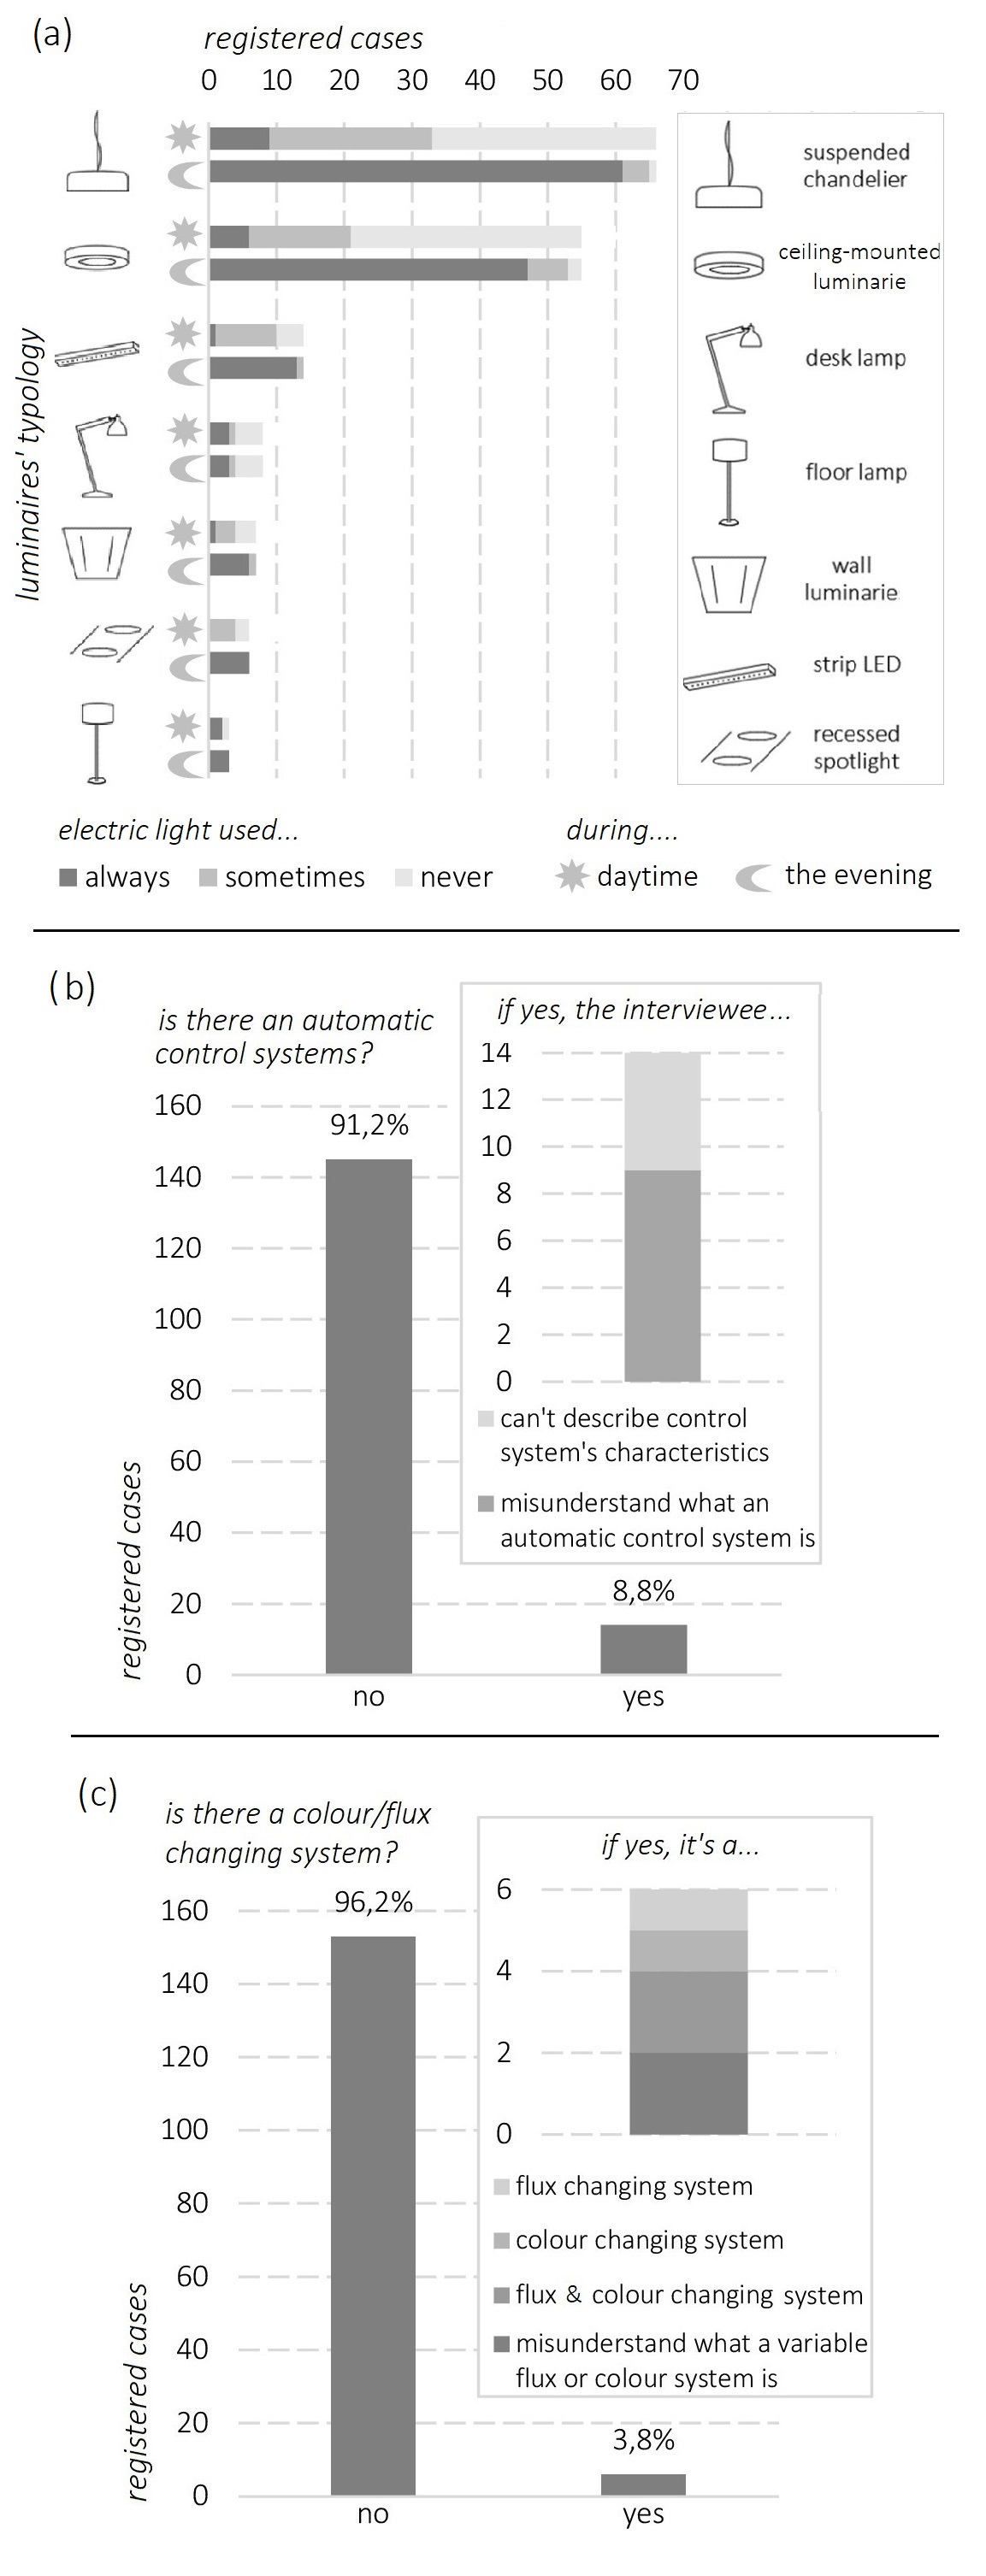
Fig. 7. Data about control of electric light in rooms equipped with only one luminaire: frequency of use of the electric light (a), presence or not of automatic control system (b) and typology of changing colour and/or flux system (c); percentages refer to the number of rooms with one luminaire (159).
Electric light is used when daylight is insufficient, so luminaires are used mostly in the evening as shown in Fig. 7(a), often they are always used during the daytime too, especially suspended chandeliers and ceiling-mounted luminaires, desk lamps and floor lamps. In very few cases interviewees indicate the presence of automatic control systems (8.8%) or systems that enable colour and/or flux changing (3.8%) (see Figs. 7(b) and (c)). Moreover, more than half of them misunderstand what an automatic control system is, confusing it with the possibility to switch on/off the light or use screening and shading systems. None can indicate the characteristics of the automatic control system. Conversely, as shown in Fig. 7(c), two people out of six misunderstand the meaning of changeable colour and/or flux systems.
As for the rooms equipped with two luminaires, data about the control of electric light are reported in Fig. 8. As in the previous case, electric light is used when daylight is insufficient, mostly in the evening (see Fig. 8(a)). Generally, the use of desk lamps is associated with the presence of indirect lighting. Rarely two luminaires providing indirect lighting are both used during the evening. In very few cases interviewees indicate the presence of automatic control systems (11.2%) or systems that enable colour and/or flux changing (8.7%) (see Figs. 8(b) and (c)); moreover, quite all of them, as previously observed, clearly misunderstand what an automatic control system is, or cannot indicate its characteristics. Instead, more people are conscious of systems that enable colour and/or flux changing, as shown in Fig. 8(c).
Figure 8
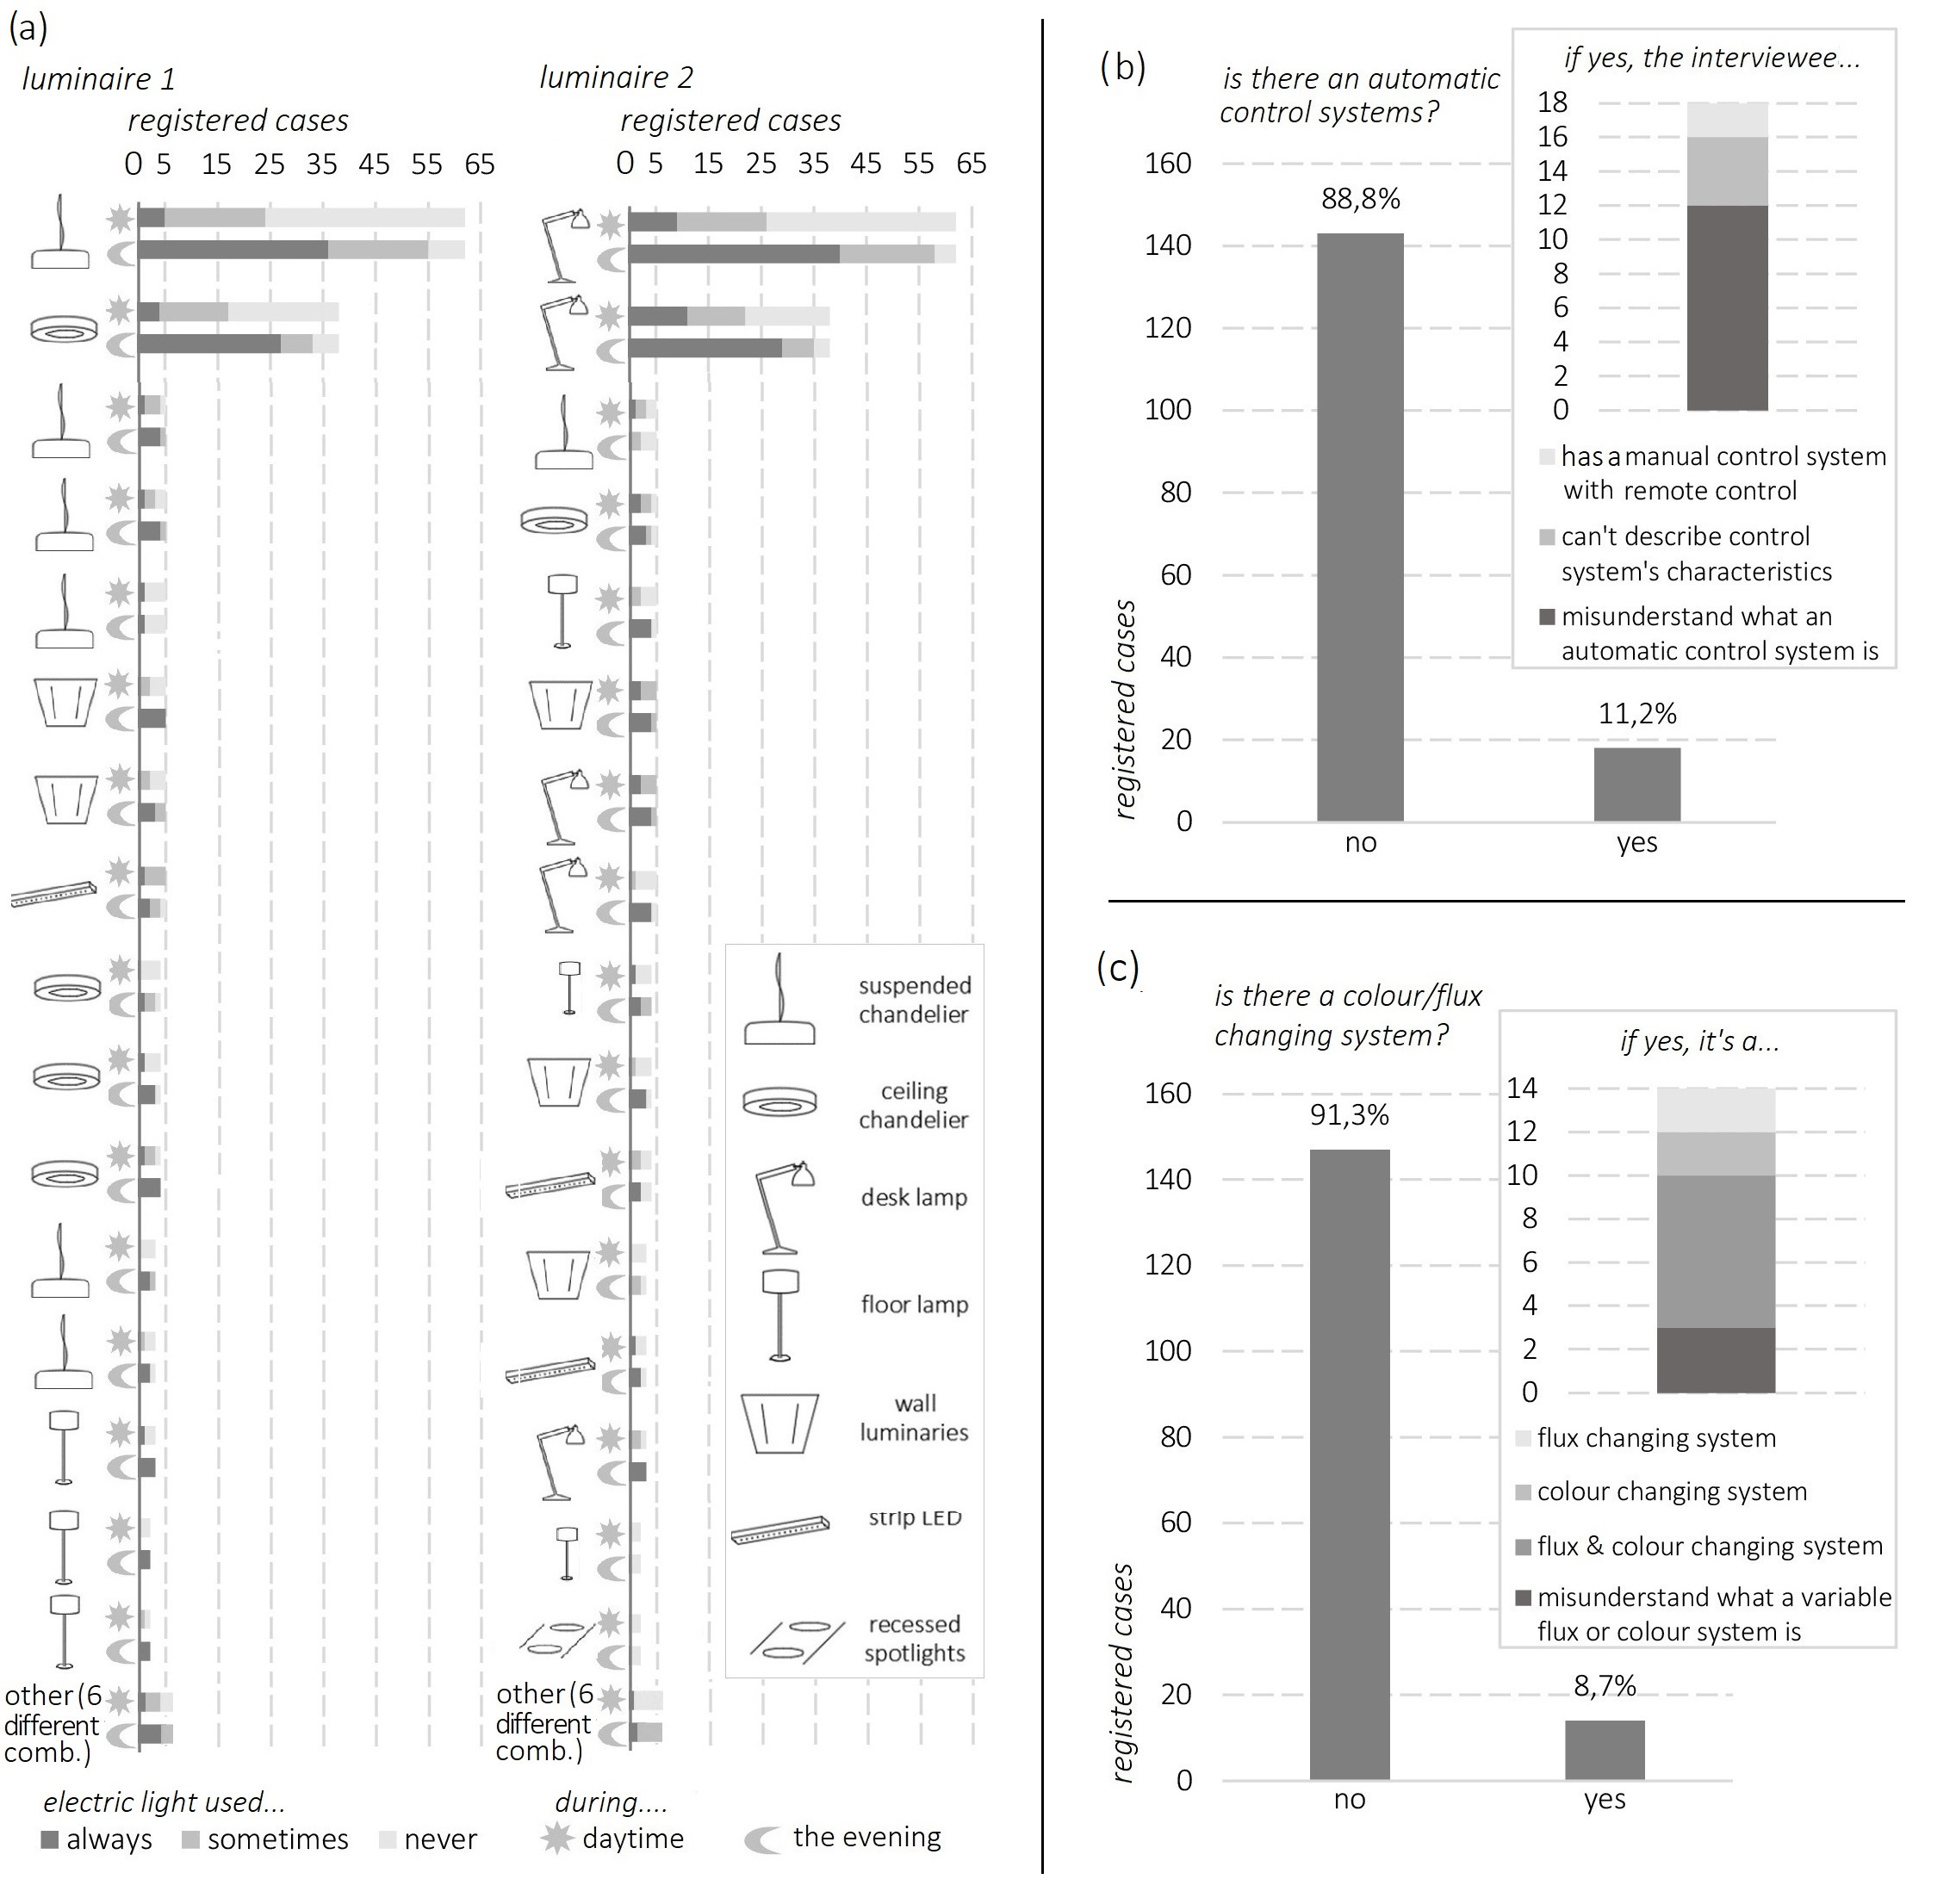
Fig. 8. Data about control of electric light in rooms equipped with two luminaires: frequency of use of the electric light (a), presence or not of automatic control system (b) and typology of changing colour and/or flux system (c); percentages refer to the number of rooms with two luminaires (161).
For rooms equipped with three luminaires, similar observations can be done. The detailed data are reported in the Appendix.
4.7. Part 7: Electric light overall evaluation
Figure 9 reports data referred to the overall electric light evaluation for rooms equipped with one and two sources and specifically the general satisfaction with the system (Figs. 9(a) and (e), suggestions about the possibility to further improve electric light (Figs. 9(b) and (f)), opinions about energy costs (Figs. 9(c) and (g)) and opinions about what aspects are more important considering light, i.e., comfort or energy-saving (Figs. 9(d) and (h)).
Figure 9

Fig. 9. Data referred to the electric light overall evaluation in rooms equipped with only one luminaire and two luminaires: general satisfaction with the system (a) and (e), suggestions about the possibility to further improve electric light (b) and (f), opinions about energy costs (c) and (g) and opinions about what aspects are more important considering light, i.e. comfort or energy-saving (d) and (h); percentages refer to the number of rooms with one luminaire (159) and with two luminaires (161) respectively.
Generally, the interviewees are satisfied with the electric lighting system (50.9% of positive answers in the case of one luminaire, 44.1% and 65.4% in the cases of two and three luminaires respectively). The percentages of the unsatisfied are around 10% in the case of rooms with one and two luminaires and around 15% in the case of three luminaires. People propose several solutions to improve the electric light system, depending on the number of luminaires in the room (see Figs. 9(b) and (f)). For example, the most common suggestions are to increase the number of electric light sources or their flux, especially at the workplace or to change their position. As for the opinion about the energy costs, they are generally considered not excessive (69.2% of positive answers with one source, 67.7% with two sources and 73.1% with three sources), whereas people considering costs too high are 15.7%, 13.7% and 11.6% with one source, two sources and three sources respectively. In this case, the habits to use electric light were analysed and they are described in Figs. 9(c) and (g). It can be observed that the use of electric light cannot be considered irresponsible, i.e., electric light is not switched on all day irrespective of daylight presence.
Finally, to the question “Concerning the electric lighting system, do you think are more significant energetic and economic aspects or those related to comfort and visual performances?” 80.1% of the interviewees declared to consider comfort issues as priorities.
4.8. Final question
Quite all the interviewees (96.8%) consider it useful to gain better knowledge about lighting and its effects on human wellbeing.
5. Conclusion
The home-working phenomenon is more and more spreading, but frequently home spaces, being planned strictly for housing needs, are not apt to host comfortable workstations. That is confirmed by the survey, which demonstrates that only 16.8% of all the interviewees are able to perform activities in a proper study, while bedroom/study has emerged as the most occupied home space (by students predominantly).
Results underline how diversified and various the home working spaces are. Indeed, many different home scenarios are described. Despite that, some general observations can be inferred.
As for daylight, most rooms are equipped with one opening only (two or more doors French windows, two or more doors windows, one door French windows and one door windows are the predominant opening typologies), however, the minimum windowed area is almost always respected. Despite a general good evaluation of daylighting conditions, sometimes the desk is placed in a way to receive daylight from the back (this causes annoying shadows on the worktop) and, while sitting at the desk, it is impossible to see the sky or the external environment. Moreover, the survey reveals some difficulties in managing the incoming daylight using the shielding and screening systems (fabric curtains and roller shutters are the most common shielding and screening systems respectively).
As for electric light, generally home spaces are equipped with one or two luminaires. Suspended chandeliers or ceiling-mounted luminaires are the most widespread typologies, associated with desk lamps when two luminaires are present. Most of the luminaires are equipped with LED sources and data demonstrate that dynamic systems with changeable luminous flux and CCT start to appear also in residential applications. People are generally satisfied with electric light characteristics and related energy costs. However, above all, a complete lack of knowledge about electric light emerges. People appear almost totally unaware of sources’ characteristics and luminaires’ photometry. This lack of knowledge demonstrates that they are not aware of the choices they made about lighting systems. This could limit their capacity to judge what is proper or not, with the consequent difficulties in taking the right actions to improve their workplaces' lighting quality. However, the answers to the final question of the test demonstrates a generalized interest in being informed about light-connected issues to overcome this knowledge gap. This stresses the importance to popularize more knowledge about lighting among people, teaching them to correctly manage, by themselves, the luminous characteristics of the space they occupy. This is particularly important considering that more sophisticated systems allowing dynamic control of light are spreading. How to do that?
As it was previously mentioned, standards are available to guide design practice in traditional workplaces, but lighting standardization in residential contexts is impossible. Indeed, in most domestic environments lighting design criteria are not easily applied by occupants, lighting calculations are not performed, and measurements are impracticable. So, the challenge is to conceive guidelines for helping common people to make their choices to improve their visual environment through different paradigms than the usual ones.
How to set up these ad-hoc guidelines?
First of all, it must be not forgot that the addressees are not-expert people. Consequently, the most important thing is to make them aware of the topic sensitizing them about the benefits connected to proper lighting. That can motivate them in changing bad habits, if present, in making an effort in taking care of their workplace conditions, and also in being prone to ask for the opinion of an expert when necessary. For this purpose, it should be fundamental to provide them with basic knowledge about lighting quality, especially focusing on the effects on wellness and productivity, very important issues both for workers and employers. Beside the motivations, it is essential to give them easy and practical suggestions. According to the answers to the survey, it is clear that even simple aspects should be treated: the position of the workstations, their orientation towards the window, the choice of the most suitable shading system, the choice of the luminaires typology, their positioning to avoid glare phenomena, and especially the parameters characterizing the quality of the light sources. These simple criteria should be expressed using terms and situations experienced every day, instead of technical prescriptions as used in standards. For example, in the definition of the test for the survey, it was crucial to carefully choose the language keeping in mind that it was addressed to common people working or studying at home. So, the test was prepared using simple terms, instead of the technical ones, and instructions about how to find the characteristics of electric lighting sources (flux, power, CRI, and CCT) were provided.
Of course, these guidelines should be from experts to not-experts. So, experts in lighting (researchers and designers) should take on this commitment. The effort of the lighting associations is necessary. The CIE could coordinate the works and stimulate the national committees to embrace this mission and to define a common and shared investigation methodology. The implication of national organizations is fundamental as well, since the problems are surely different in each country, due both to diverse architectural cultures and to different spread of the home-working phenomenon. Moreover, the lighting associations should dialogue with employers’ associations and associations caring about workers’ rights, who could be involved in the spread of the guidelines.
The first steps for the definition of the guidelines should be the analysis of the current situation in each country. So, studies like the presented one should be performed in other places to extend the knowledge about residential spaces and compare the results.
Of course, the methodology could be improved.
As mentioned in the paper, one of the goals of the research was to obtain comments about lighting irrespective of people’s general background and knowledge. In this way it has been possible to have a general idea of the spread of basics about light and its effects on wellness among interviewees. For this reason, the questionnaire was spread randomly, with the only requirement for interviewees to be home-workers or students attending lessons from home. However, it could be interesting to study if there is a relation between the cultural background and people’s choices about lighting. This topic could be investigated in further studies by adding in the Part 1 (General information) of the survey some specific questions about the educational qualification and basic knowledge on lighting.
Moreover, another aspect to underline is that most of the interviewees are between 20 and 30 years old, with the best visual capacities, and this aspect could have influenced the obtained results. Actually, it was considered that in private spaces, people choose lighting conditions according to personal taste and specific own needs. Consequently, people with lower visual capacity are likely to tailor light characteristics to solve their problems. However, it would be interesting to highlight this topic in further research to underline the relation between people’s visual conditions and their choices about lighting.
Furthermore, it must be highlighted that in this research, interviewees declared to perform general office activities or to be students, but the questionnaire did not include questions about the specific tasks they performed (work with screen, drawing, writing, etc.). It could be interesting to investigate if there is a connection between the typical performed activities and the way people arrange their home workstations.
Finally, another thing worth being noticed is that some problems underlined by the interviewees are not due to their choices but are consequences of the urbanistic and architectural design. In the cases of rooms with one and two windows, more than the 25% of interviewees, complained about insufficient daylight often due to the presence of protruding balconies and nearby buildings. That demonstrates the necessity to promote daylighting culture among urban and architectural planning professionals.
Appendix A. Supplementary material
Figure A1
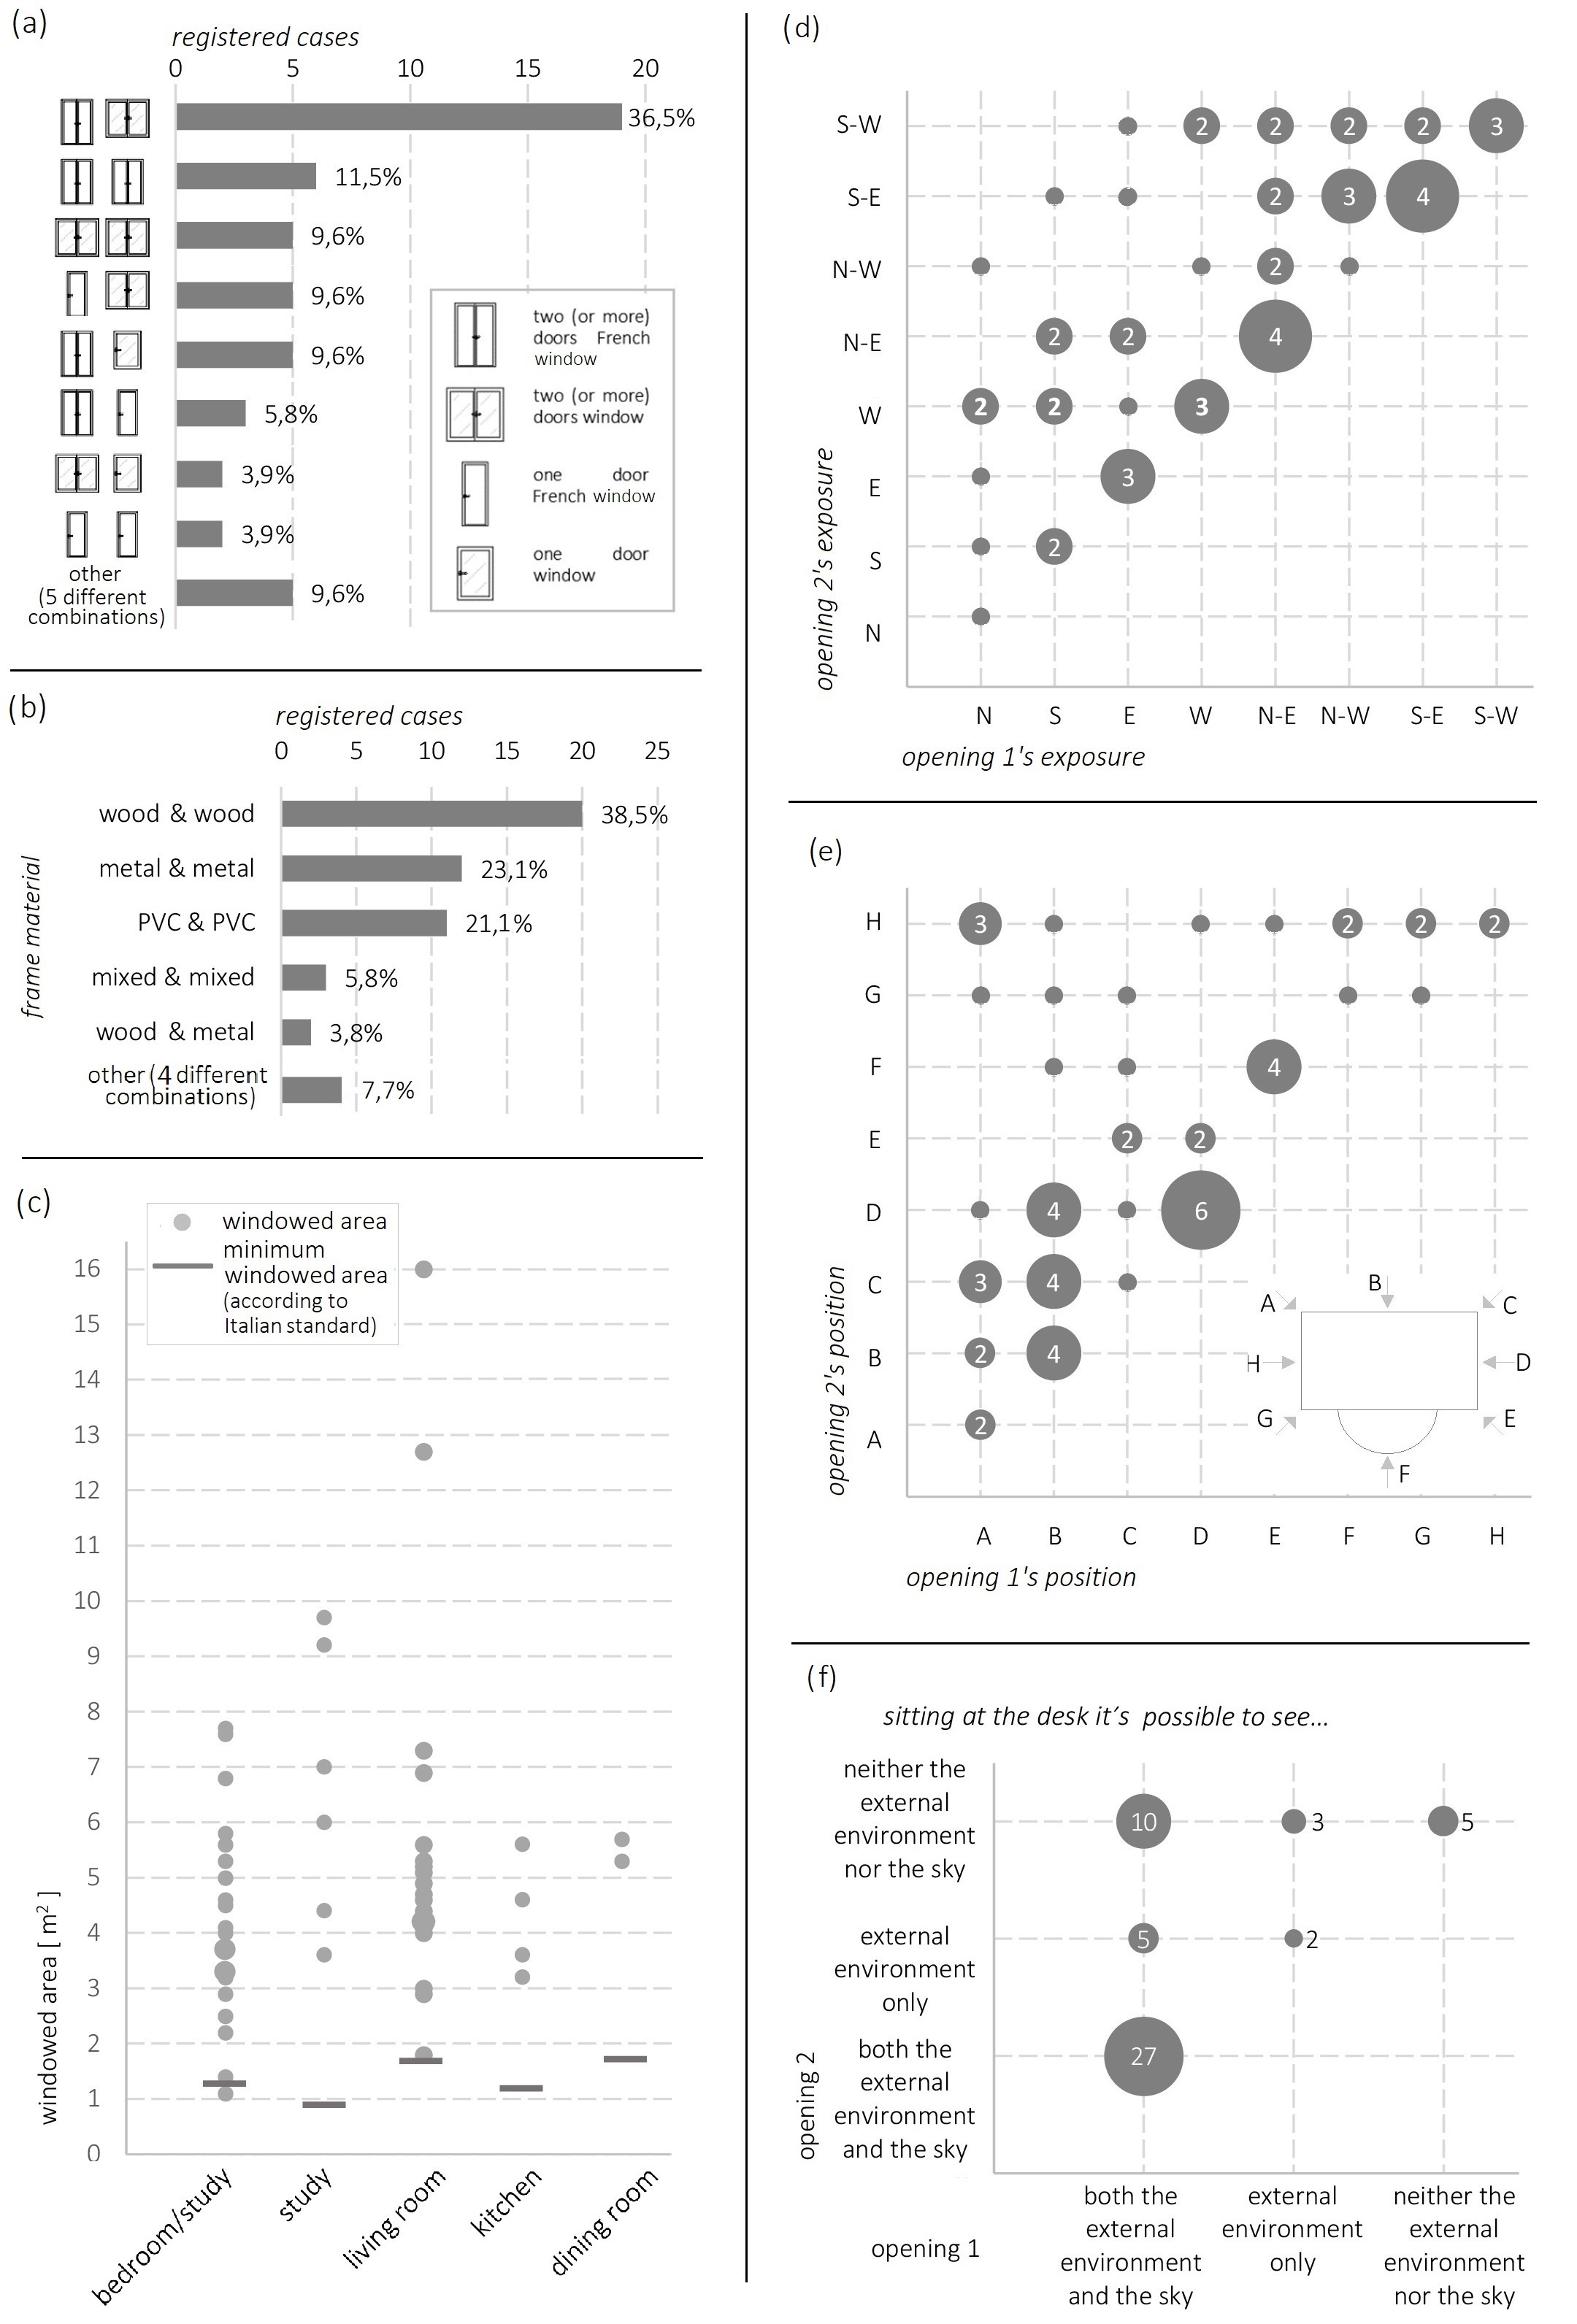
Fig. A1. Windows’ characteristics in rooms with two openings: typology of window (a), material of the frame (b), area (c), exposure (d), position of the desk referring to the window (e) and view out (f). In (d)-(f) the numbers in the circles indicated the number of registered cases, where the number is not indicated only one case was observed.
Figure A2
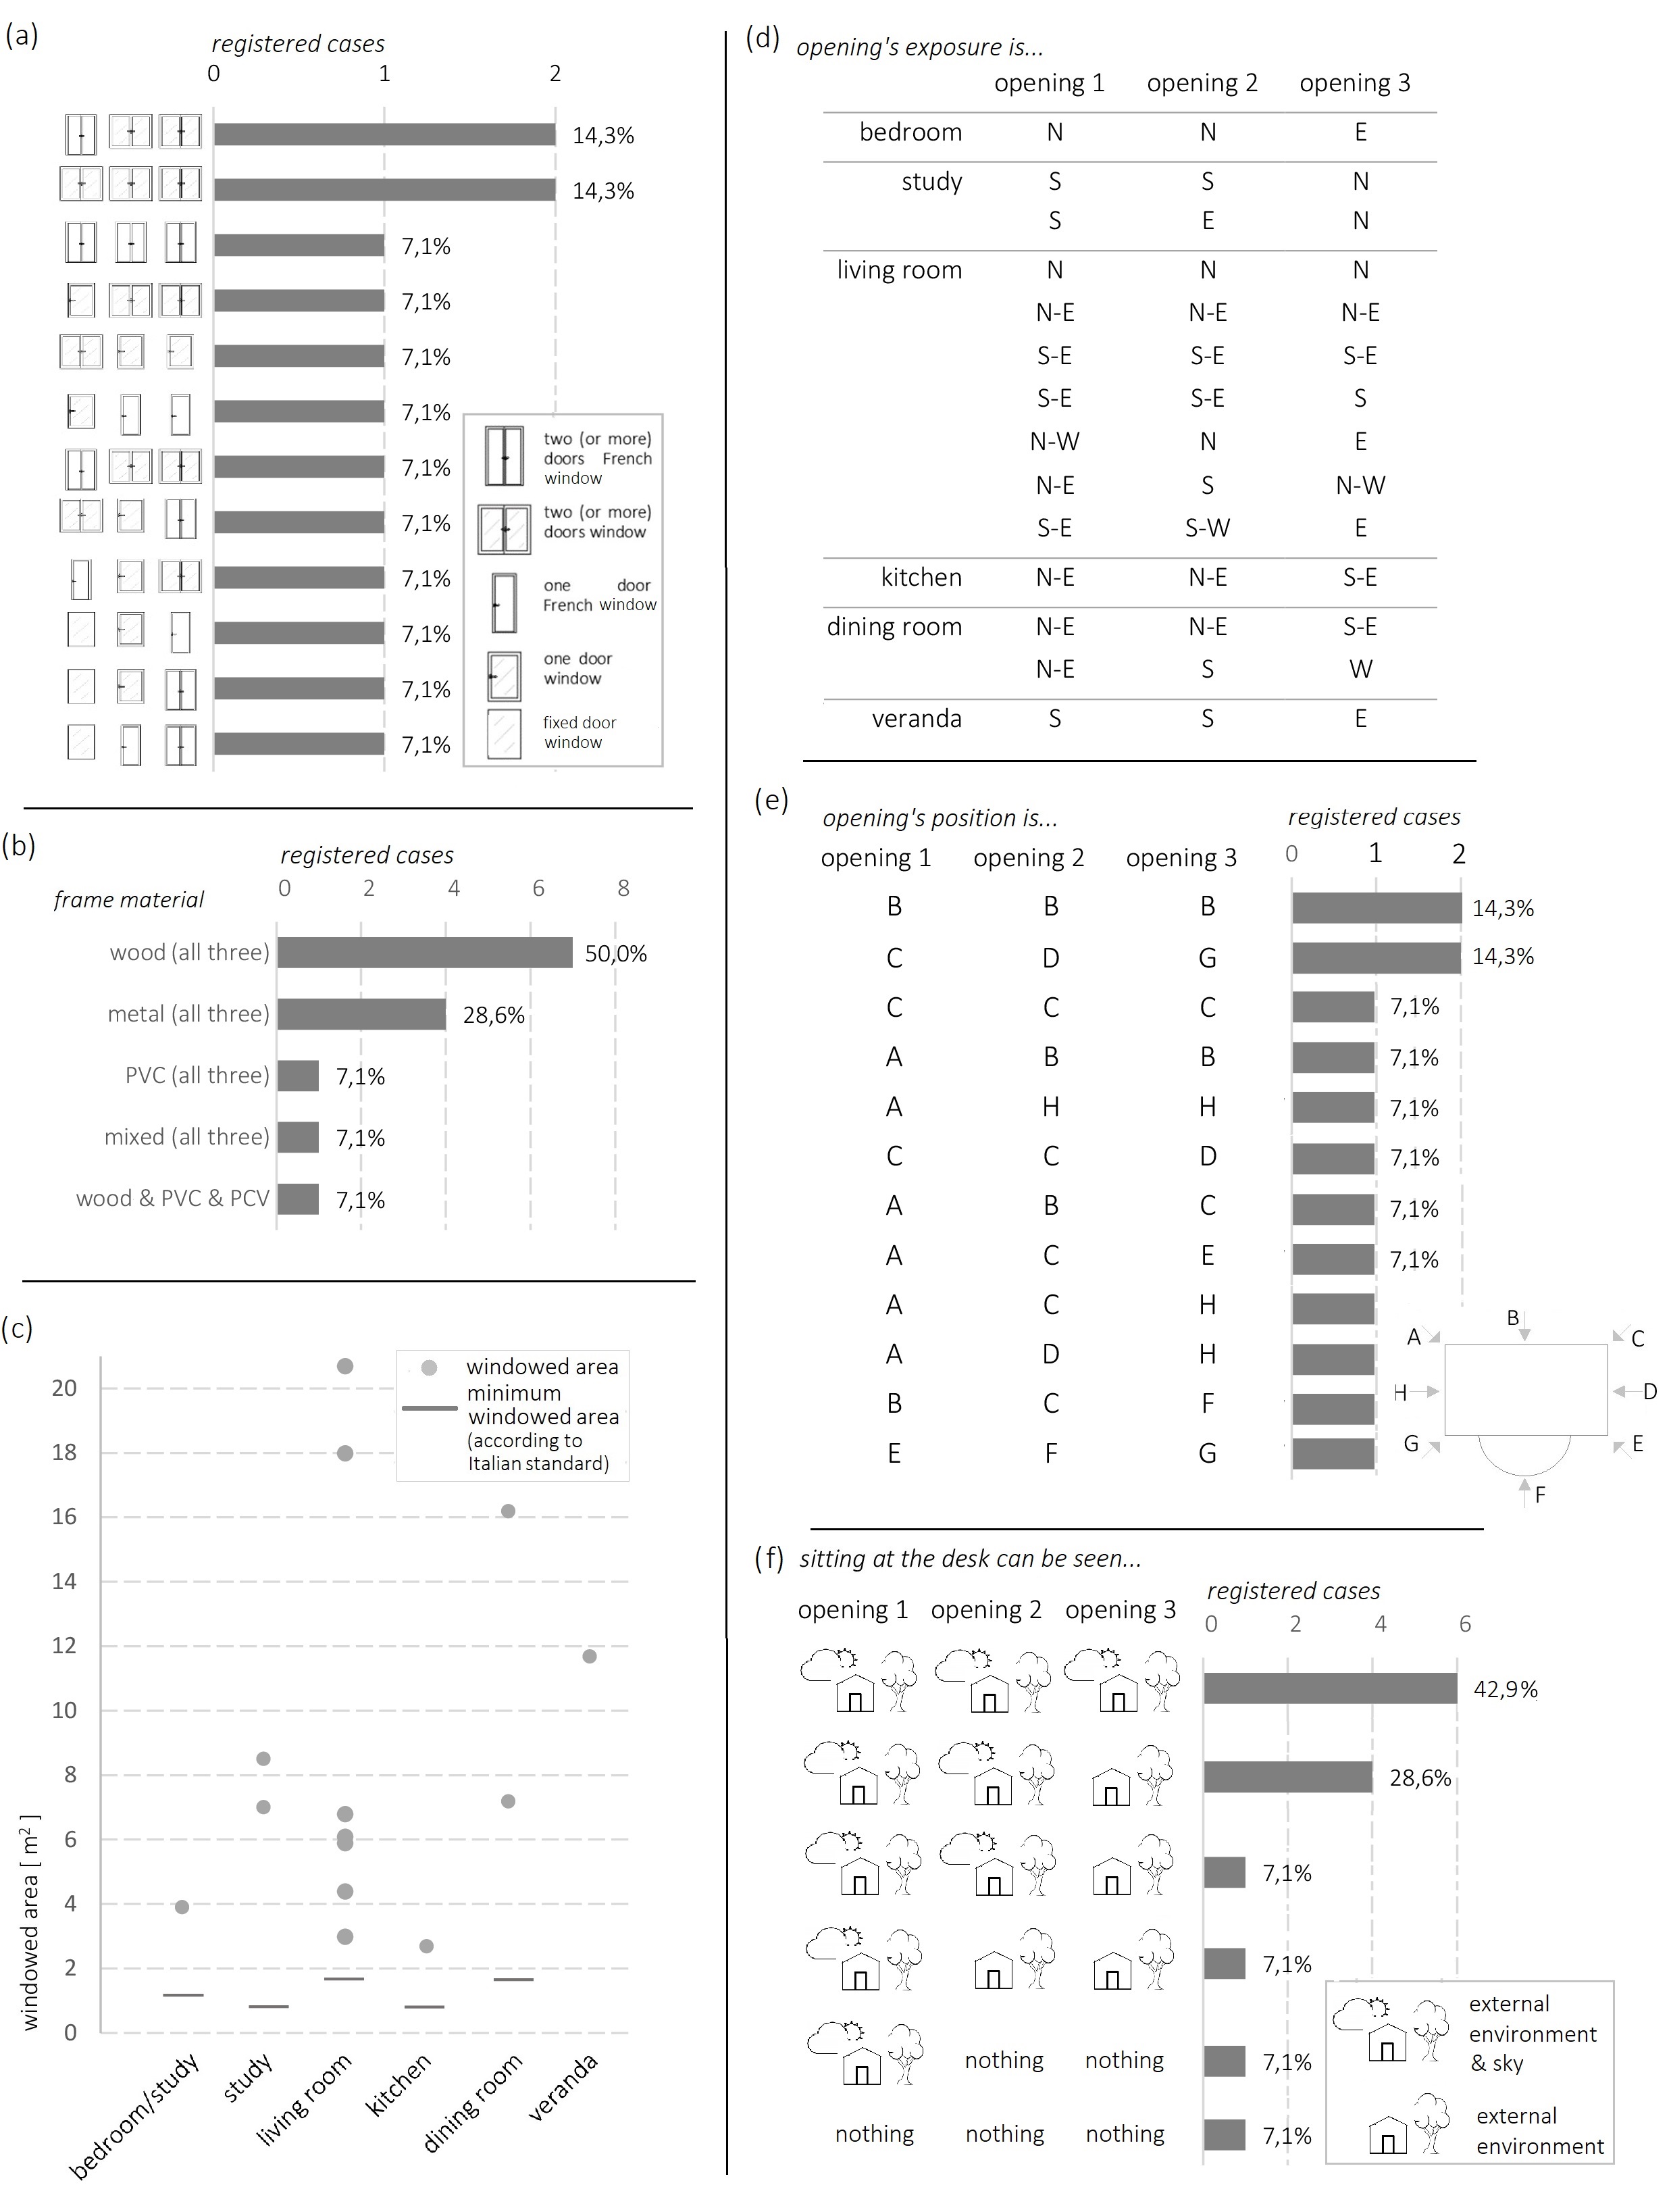
Fig. A2. Windows’ characteristics in rooms with three openings: typology of window (a), material of the frame (b), area (c), exposure (d), position of the desk referring to the window (e) and view out (f).
Figure A3
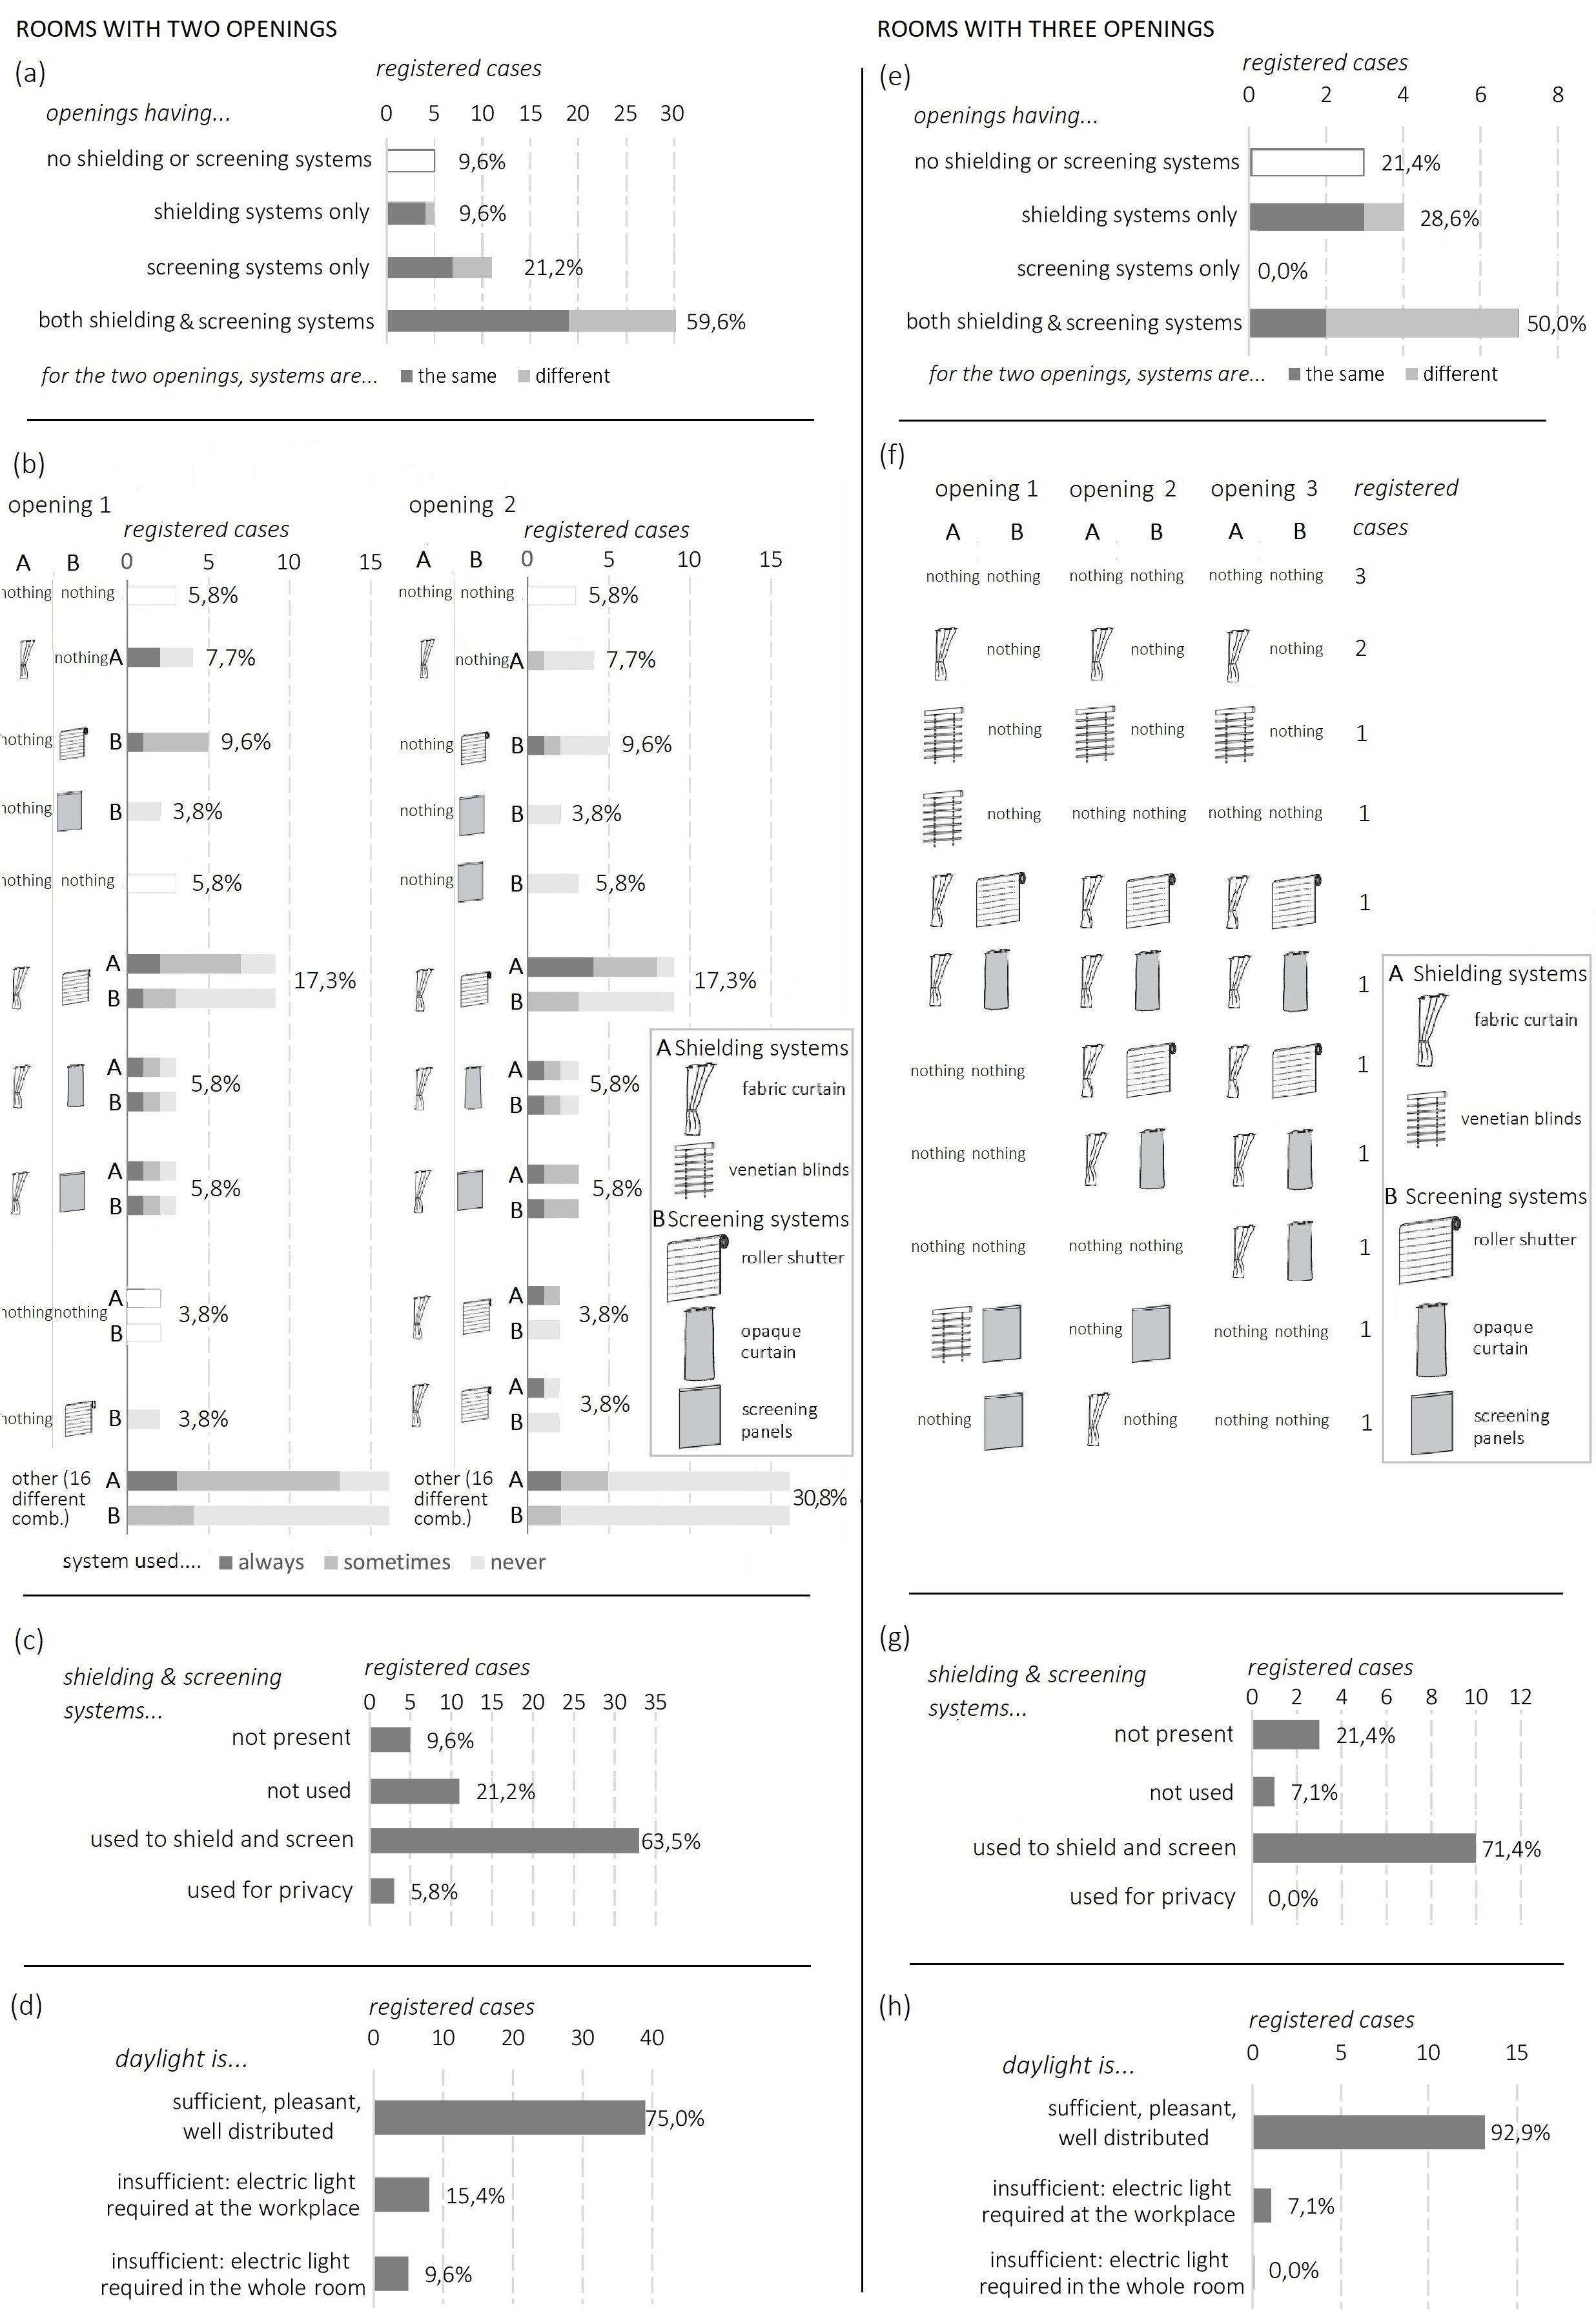
Fig. A3. Shading and screening systems and overall evaluation of daylight in rooms with two and three openings; presence of the systems (a) and (e), typology and frequency of use (b) and (f), reason why they are used (c) and (g), overall evaluation of daylight (d) and (h); percentages refer to the number of rooms with two openings (52) and three openings (14).
Figure A4
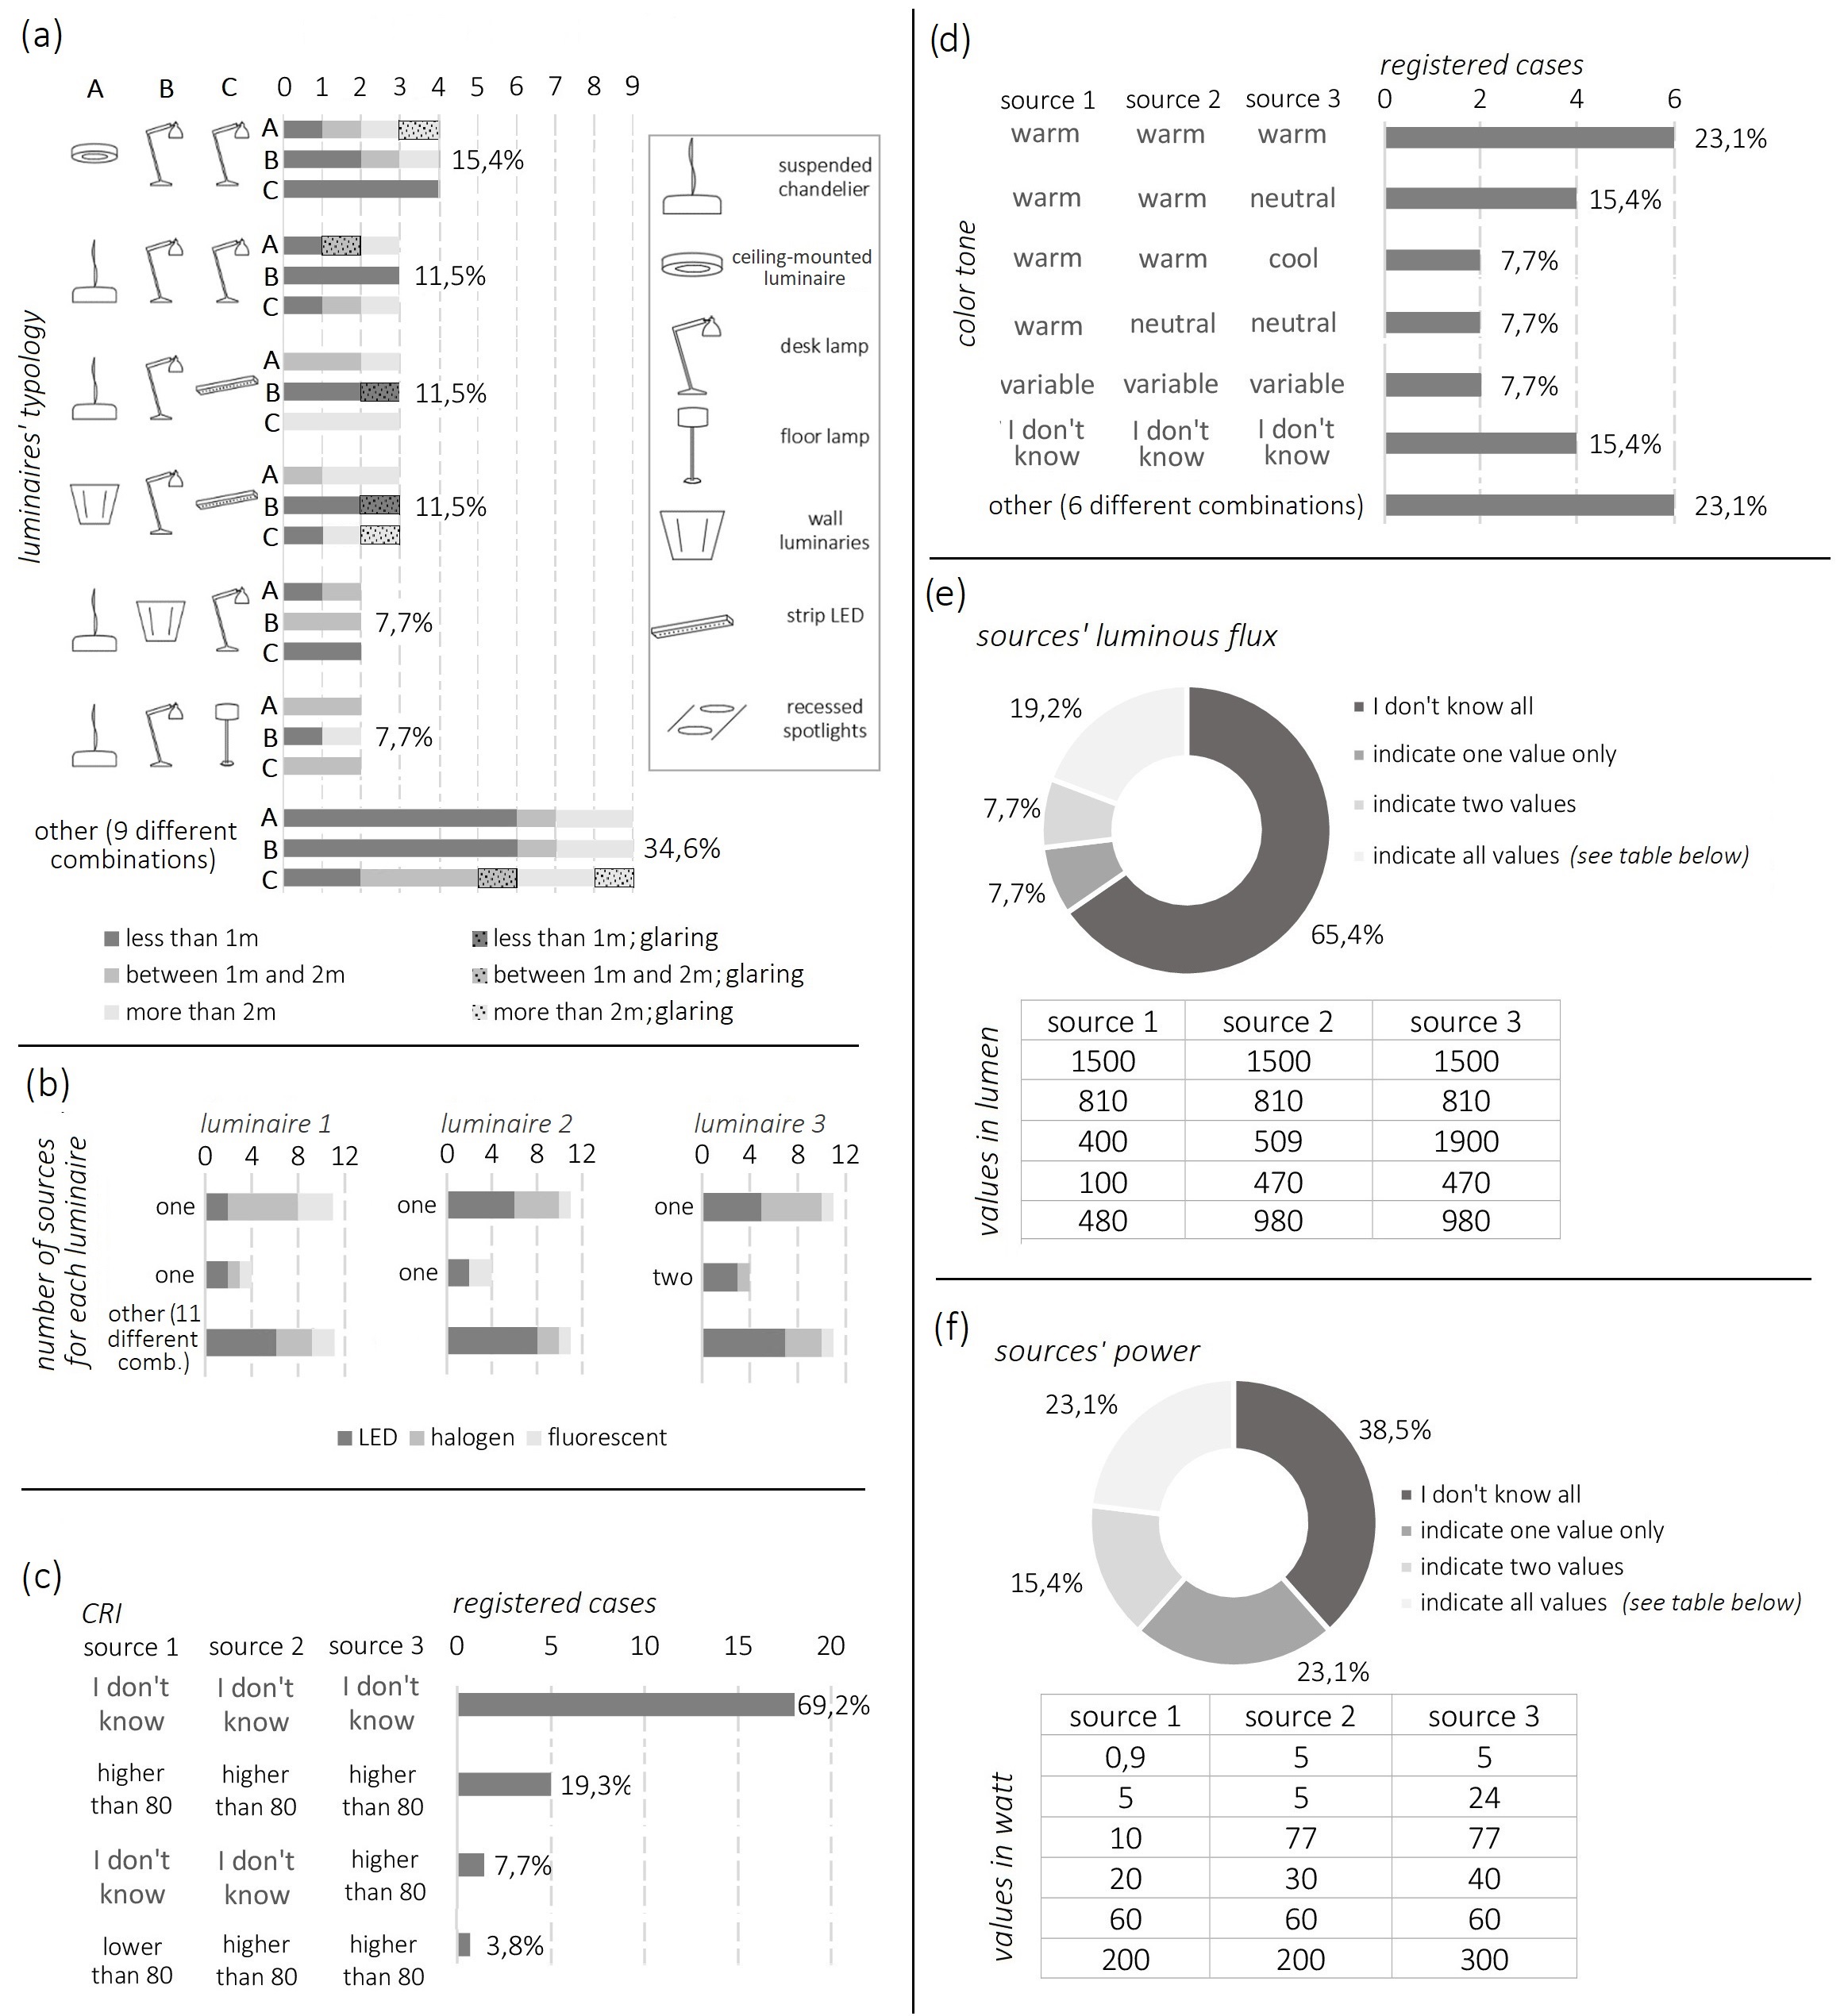
Fig. A4. Characteristics of the luminaires in rooms equipped with three devices: typology (a), number of sources for each luminaire and type of lamp (b), CRI (c), colour tone (d), luminous flux (e) and power (f); percentages refer to the number of rooms equipped with three luminaires (26).
Figure A5
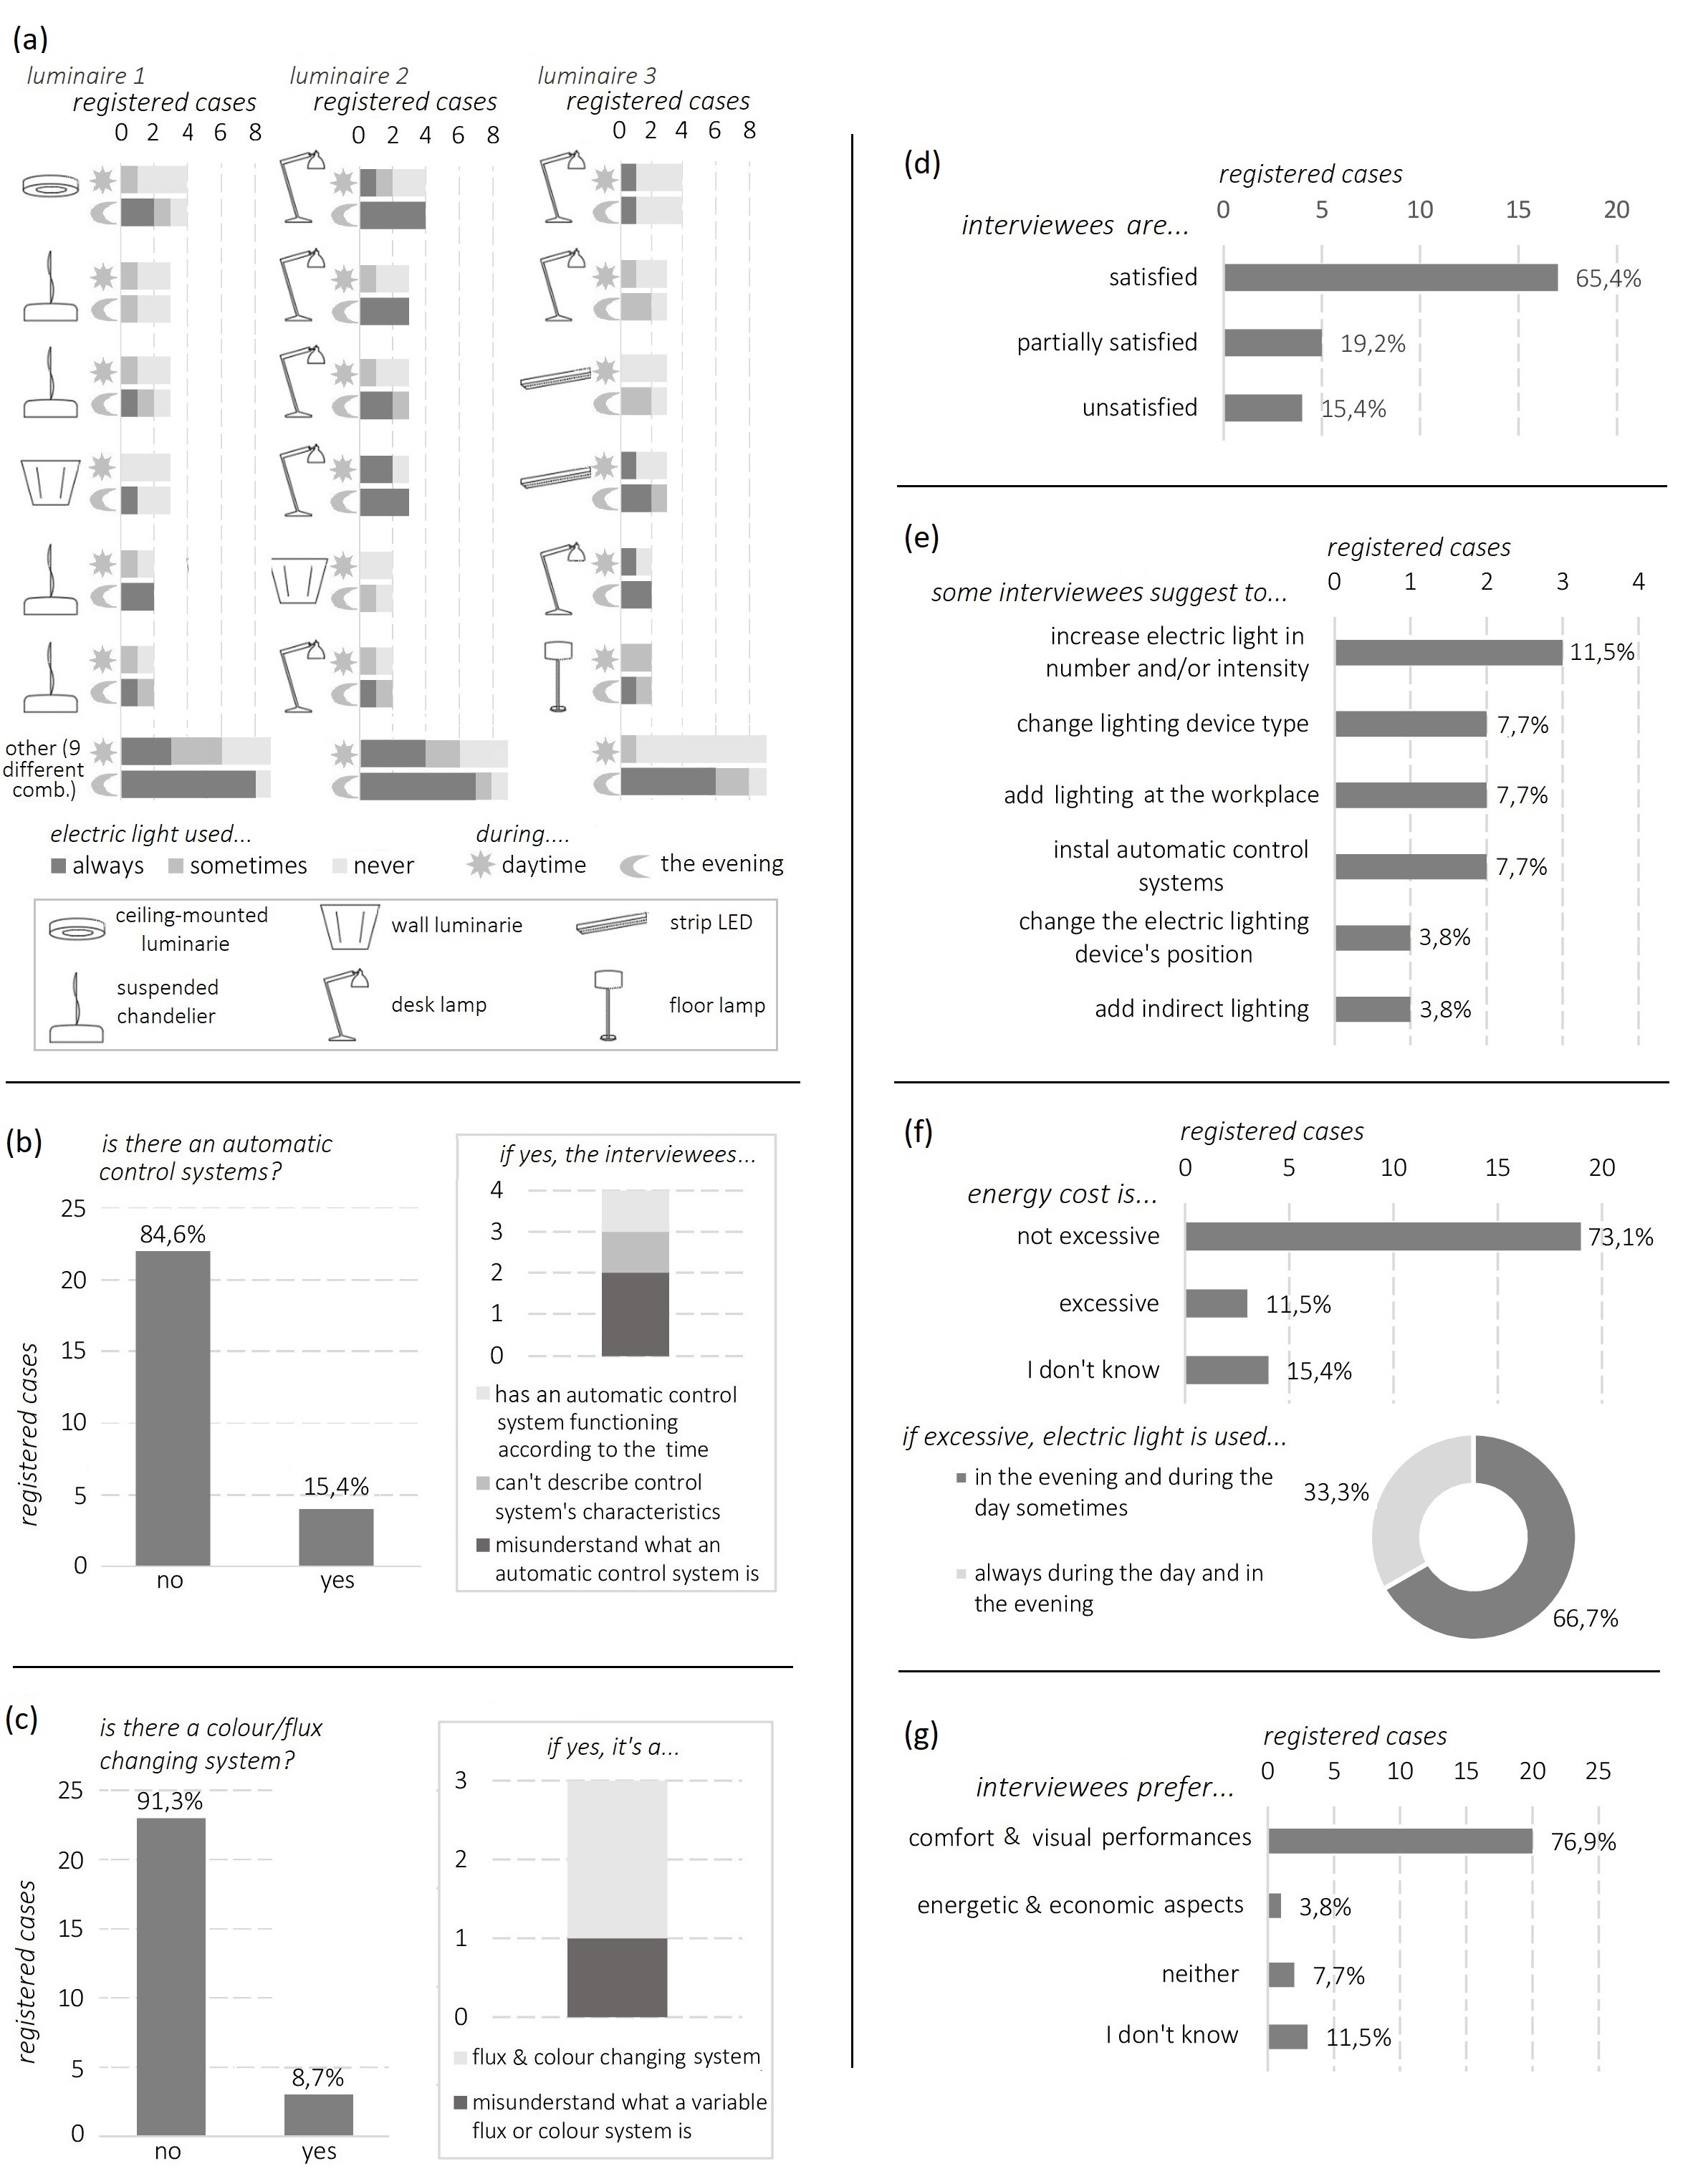
Fig. A5. Data about control and overall evaluation of electric light in rooms equipped with three luminaires: frequency of use of the electric light (a), presence or not of automatic control system (b), typology of the automatic system (c), general satisfaction about the system (d), suggestions about the possibility to further improve electric light (e), opinions about energy costs (f) and opinions about what aspects are more important considering light, i.e. comfort or energy-saving (g); percentages refer to the number of rooms with three luminaires (26).
Contributions
All the authors contributed equally.
Declaration of competing interest
The authors declare no conflict of interest.
References
- M.S. Rea, M.G. Figueiro, A. Bierman, J.D. Bullough, Circadian light, J. Circadian Rhythms. 8 (2010) 1-10. https://doi.org/10.1186/1740-3391-8-2
- F. Bisegna, C. Burattini, O. Li Rosi, L. Blaso, S. Fumagalli, Non visual effects of light: An overview and an Italian experience, Energy Procedia. 78 (2015) 723-728. https://doi.org/10.1016/j.egypro.2015.11.080
- C. Vetter, P.M. Pattison, K. Houser, M. Herf, A.J.K. Phillips, K.P. Wright, D.J. Skene, G.C. Brainard, D.B. Boivin, G. Glickman, A review of human physiological responses to light: Implications for the development of integrative lighting solutions, Leukos. (2021) 1-28. https://doi.org/10.1080/15502724.2021.1872383
- M.G. Figueiro, An overview of the effects of light on human circadian rhythms: implications for new light sources and lighting systems design, J. Light Vis. Environ. 37 (2013) 51-61. https://doi.org/10.2150/jlve.IEIJ130000503
- A. Jamrozik, N. Clements, S.S. Hasan, J. Zhao, R. Zhang, C. Campanella, V. Loftness, P. Porter, S. Ly, S. Wang, Access to daylight and view in an office improves cognitive performance and satisfaction and reduces eyestrain: A controlled crossover study, Build. Environ. 165 (2019) 106379. https://doi.org/10.1016/j.buildenv.2019.106379
- CEN, EN 12464-1:2021. Light and lighting - Lighting of work places - Part 1: Indoor work places, 2021.
- I.W.B.I., WELL Building Institute: Circadian Lighting Design, (2019). https://standard.wellcertified.com/light/circadian-lighting-design (accessed December 16, 2020).
- M. Zamfir, I. Ciobanu, A.G. Marin, M.-V. Zamfir, Smart dwellings. Architectural perspectives opened by COVID-19 pandemic, Smart Cities Reg. Dev. J. 5 (2021) 33-49.
- A.A. Shamaileh, Responding to COVID-19 pandemic: interior designs' trends of houses in Jordan, Int. J. Hum. Rights Healthc. (2021). https://doi.org/10.1108/IJHRH-01-2021-0013
- G. Mattarocci, S. Roberti, Real Estate and the Effects of the COVID-19 Pandemic in Europe, A New World Post COVID-19. (2020) 177. https://doi.org/10.30687/978-88-6969-442-4/013
- T. Cuerdo-Vilches, M.Á. Navas-Martín, I. Oteiza, Working from home: Is our housing ready?, Int. J. Environ. Res. Public Health. 18 (2021) 7329. https://doi.org/10.3390/ijerph18147329
- C. Ticleanu, Impacts of home lighting on human health, Light. Res. Technol. 53 (2021) 453-475. https://doi.org/10.1177/14771535211021064
- R. Aslanoğlu, P. Pracki, J.K. Kazak, B. Ulusoy, S. Yekanialibeiglou, Short-term analysis of residential lighting: A pilot study, Build. Environ. 196 (2021) 107781. https://doi.org/10.1016/j.buildenv.2021.107781
- C.N.D. Amorim, N.G. Vasquez, J.R. Kanno, B. Matusiak, Lighting conditions in Brazilian and Colombian home offices: a preliminary study, in: CIE 2021 Midterm Meet. Conf. Light Life-Living with Light, 2021. https://doi.org/10.25039/x48.2021.OP33
- H.I. Sarsak, Working from home: Self-assessment computer workstation set-up, World Fed. Occup. Ther. Bull. (2020) 1-8. https://doi.org/10.1080/14473828.2020.1852764
- Eurofound, Living, working and COVID-19", COVID-19 series, Publications Office of the European Union, 2020.
- EUROSTAT, How usual is it to work from home?, (2020). https://ec.europa.eu/eurostat/web/products-eurostat-news/-/DDN-20200424-1#:~:text=In 2019%2C 5.4%25 of employed,2009 to 9.0%25 in 2019. (accessed July 28, 2021).
- J.C.R. Licklider, W.E. Clark, Online man-computer communication, in: AFIPS Proc. - 1962 Spring Jt. Comput. Conf. AFIPS 1962, 1962. https://doi.org/10.1145/1460833.1460847
- T.A. Carte, Telecommuting '96 conference report, ACM SIGOIS Bull. 17 (1996) 9-11. https://doi.org/10.1145/234881.234884
- F. Toscano, S. Zappalà, Smart working in Italia: origine, diffusione e possibili esiti, Psicol. Soc. 15 (2020) 203-223.
- E. Ciampa, M. Campolongo, E. Santoleri, Smart working: quadro normativo in Italia e in Europa, criticità e proposte di miglioramento, J. Adv. Heal. Care. (2020) 28-29. https://doi.org/10.36017/JAHC1912-004
- A. Gangai, Dall'Agile Working al Flexible: le forme dello Smart Working in Europa, (2019). https://blog.osservatori.net/it_it/agile-working-smart-working-europa.
- President of the Italian Republic, Modifiche ed integrazioni alle leggi 15 marzo 1997 n.59 e 15 maggio 1997 n.127, nonché norme in materia di formazione del personale dipendente e di lavoro a distanza nelle pubbliche amministrazioni. Disposizioni in materia di edilizia scolastica, Italian Rebublic Gazzetta Ufficiale, 1997.
- UNICE (Confindustria), UEAPME (Confapi, CNA, Confartigianato, Confesercenti), CEEP (Confservizi), CES (Cgil, Cisl, Uil) Recepimento in Italia dell'Accordo-quadro europeo del 16 luglio 2002, 2004.
- President of the Italian Republic, Misure per la tutela del lavoro autonomo non imprenditoriale e misure volte a favorire l'articolazione flessibile nei tempi e nei luoghi del lavoro subordinato, Italian Rebublic Gazzetta Ufficiale, Italy, 2017.
- US Bureau of Labor Statistics, Employed persons working and time spent working at home or workplace, by job status and educational attainment, (n.d.). https://www.bls.gov/news.release/atus.t04.htm (accessed July 28, 2021).
- J.I. Dingel, B. Neiman, How many jobs can be done at home?, J. Public Econ. 189 (2020) 104235. https://doi.org/10.1016/j.jpubeco.2020.104235
- M. Hatayama, M. Viollaz, H. Winkler, Jobs' Amenability to Working from Home: Evidence from Skills Surveys for 53 Countries, World Bank, Washington, DC, 2020. https://doi.org/10.1596/1813-9450-9241
- B. Aczel, M. Kovacs, T. van der Lippe, B. Szaszi, Researchers working from home: Benefits and challenges, PLoS One. 16 (2021) e0249127. https://doi.org/10.1371/journal.pone.0249127
- I. Spieler, S. Scheibe, C. Stamov-Roßnagel, A. Kappas, Help or hindrance? Day-level relationships between flextime use, work-nonwork boundaries, and affective well-being, J. Appl. Psychol. 102 (2017) 67-87. https://doi.org/10.1037/apl0000153
- T. van der Lippe, Z. Lippényi, Co-workers working from home and individual and team performance, New Technol. Work Employ. (2020). https://doi.org/10.1111/ntwe.12153
- J. Cohen, Mass testing, school closings, lockdowns: Countries pick tactics in 'war' against coronavirus, Science 18 (2020). https://doi.org/10.1126/science.abb7733
- European Foundation for the Improvement of Living and Working Conditions, Living, Working and COVID-19-First Findings-April 2020, (2020).
- C. Lilly, Working from home (WFH) statistics, (2021). https://www.finder.com/uk/working-from-home-statistics (accessed July 28, 2021).
- P.M. Caligiuri, H. De Cieri, Predictors of Employees' Preference for Working from Home Post-Pandemic, Bus. Econ. Res. 11 (2021) 1. https://doi.org/10.5296/ber.v11i2.18411
- W. Gosling, M. Coppola, K. McCarthy, May the workforce be with you: The voice of the European workforce 2020, Deloitte Insights, Online [Accessed 20 Jun. 2021]. (2020).
- A. Sulaymonov, Flexible Working Practices: Urgency or Future?, Mod. Econ. 11 (2020) 1342-1350. https://doi.org/10.4236/me.2020.117095
- ISTAT, Rapporto annuale 2020 - La situazione del Paese. Capitolo 3 - Mobilità sociale, diseguaglianze e lavoro, 2020.
- USTAT, I numeri della formazione, (2020). http://ustat.miur.it/.
- Sample size calculator, (n.d.). https://www.calculator.net/sample-size-calculator.html (accessed August 4, 2022).
- Almalaurea, Età alla laurea: la pergamena arriva prima, (n.d.). https://www.almalaurea.it/universita/profilo/profilo2011/premessa/età-alla-laurea-la-pergamena-arriva-prima (accessed July 28, 2021).
- Ministero della Sanità, Decreto Ministeriale Sanità 5 luglio 1975. Modificazioni alle istruzioni ministeriali 20 giugno 1896, relativamente all'altezza minima ed ai requisiti igienico-sanitari principali dei locali di abitazione, Italia, 1975.
Copyright © 2022 The Author(s). Published by solarlits.com.

2109
Total views
Citations
SHARE ON


