Article Outline
2. The modified double light pipe (MDLP)
Declaration of competing interest
Figures and tables
Volume 9 Issue 2 pp. 228-241 • doi: 10.15627/jd.2022.17
Experimental Analysis on a 1:2 Scale Model of the Modified Double Light Pipe
Paolo Zazzini,⁎ Alessandro Di Crescenzo, Luigi Pio Rossitti, Roberta Mirando
Author affiliations
Department INGEO, University “G. D’Annunzio”, Viale Pindaro 42, 65127 Pescara, Italy
*Corresponding author.
zazzini@unich.it (P. Zazzini)
dicrescenzo.a@live.it (A. Di Crescenzo)
luigirossitti@yahoo.com (L. Pio Rossitti)
robertamirando@gmail.com (R. Mirando)
History: Received 9 September 2022 | Revised 21 October 2022 | Accepted 25 October 2022 | Published online 9 November 2022
Copyright: © 2022 The Author(s). Published by solarlits.com. This is an open access article under the CC BY license (http://creativecommons.org/licenses/by/4.0/).
Citation: Paolo Zazzini, Alessandro Di Crescenzo, Luigi Pio Rossitti, Roberta Mirando, Experimental Analysis on a 1:2 Scale Model of the Modified Double Light Pipe, Journal of Daylighting 9 (2022) 228-241. https://dx.doi.org/10.15627/jd.2022.17
Figures and tables
Abstract
This paper is focused on the daylighting system named Modified Double Light Pipe (MDLP) designed by the authors as an evolution of the Double Light Pipe to eliminate the drawbacks due to its encumbrance and the high luminance of its upper portion. They cut off its lower part and applied a circular light shelf to the system to prevent people from seeing the upper brightest portion of it. An experimental activity under real sky has been carried out for four months on a reduced scale model of the MDLP. The dynamic metrics DA, cDA, DR, and U0 have been calculated on monthly basis. The results can be considered satisfactory both in terms of illuminance distribution and daylight autonomy, as well as illuminance uniformity, taking into account that the tests have been carried out in winter, under unfavorable climatic conditions. The results show that, even in winter climatic conditions, the MDLP gives a contribution to delivering daylight in the intermediate room both on sunny and cloudy days with good uniformity of illuminance distribution on the horizontal work plane.
Keywords
Daylight, Light shelf, Double light pipe, Modified double light pipe
Nomenclature
| cDA | Continuous Daylight Autonomy |
| DA | Daylight Autonomy |
| DF | Daylight Factor |
| DLP | Double Light Pipe |
| DR | Daylight Ratio (%) |
| Ein | Internal illuminance (lx) |
| Eext | External illuminance (lx) |
| Eavg | Average Illuminance on the work plane (lx) |
| Emax | Maximum Illuminance on the work plane (lx) |
| Emin | Minimum Illuminance on the work plane (lx) |
| MDLP | Modified Double Light Pipe |
| r | Luminous reflectivity |
| U0 | Illuminance Uniformity (Emin / Eavg) |
1. Introduction
It is known that natural light ensures visual comfort conditions inside the rooms, as well as guaranteeing effective energy saving. It is sustainable and able to play two architectural functions: illuminating the environment and creating shapes, shadows, and visual sensations. Daylight varies according to the season and the time of day following the circadian rhythms of the human organism, creating favorable psychological conditions for the occupants. The impact of natural light on human health and psychological condition is described by the authors of [1-4]. On the other hand, large windows and skylights can cause high thermal loads due to solar radiation hitting the transparent surfaces.
Taking this into account, it is very important to construct buildings with the correct exposure to optimize natural light availability without generating high thermal loads.
The use of daylight in buildings allows considerable energy savings, especially in summer and spring at latitudes characterized by sunny weather for most of the year. The high consumption of electricity for lighting is even higher in public buildings, often caused by the occupants’ bad habit to use artificial light even in presence of natural light only for look reasons, negligence, or sloppiness, as underlined by numerous researchers [5-12].
In underground areas of buildings, daylight is lacking, while in large industrial warehouses or shopping centers, equipped with windows on the perimeter walls, it cannot reach a large part of the occupied zone, too far from the openings. In these cases, light pipes or other technological devices can be used to introduce daylight in interior environments. These systems are the topic of many authors’ studies [13-17]. Commonly, tubular light pipes produce not very high light levels with low sun elevation angles. In [18] the authors propose to improve the light pipe performance with a parabolic collector “that redirects the low altitude incident rays of the sun efficiently into a mirror light pipe and thus enhances the lighting to desired levels in the building” [18].
Natural light from a window is not evenly distributed on the work plane, because illuminance is rapidly decreasing going away from the light source. In these cases, light shelves can be used to increase the spatial uniformity of daylight incoming from windows, as described by the authors of [19-24].
The optimization of daylight distribution in interior spaces through technological devices (light pipes and similar, light shelves; etc.) is a topic widely addressed by researchers, that analyze these systems through numerical simulations or experimental activities [25-34].
The experimental analysis can be carried out under an artificial sky, as the one described by the authors in [35], or a real sky, using a real scale or reduced scale model. In [36] Boccia and Zazzini underline that the scale model approach is simply to use and effectiveness, but it usually overestimates the illuminance values, and its accuracy is often reduced due to occasional causes, such as the incidence of direct solar radiation on the measure positions.
Natural light transport systems can also be used to illuminate two underground levels of a building. For example, the authors of [37] propose a vertical light pipe able to distribute daylight simultaneously into three rooms of a two levels office building.
When a light pipe is used to introduce daylight in a two levels underground construction, it creates an annoying encumbrance in the passageway.
To solve this problem the authors of this paper developed a daylight transport system: the DLP. It is an evolution of the traditional light pipe, in which a highly reflective film is applied both on the internal and external surfaces of the tube. Furthermore, a second transparent tube is applied to the system concentric to the first, so that light entering the cavity between the two pipes is delivered into the passage area, while the internal tube illuminates the final room, as detailed by the authors in [38] and [39].
The DLP has some drawbacks due to the increased bulk compared to the traditional light pipe and to the high luminance of the upper part of the system, which can give rise risk of glare. To mitigate these weaknesses, the authors cut off the lower portion of the external tube and contemporarily installed a horizontal light shelf able to reflect light towards the ceiling and to reduce the risk of glare preventing the occupants from seeing the most luminous portion of the DLP. They called this new system MDLP and described it in [1].
The authors of [40] proposed an analogous idea: a vertical light pipe that illuminates five levels of a building, but this is a more complex device, consisting of alternated transparent and opaque portions, as well as a partially transparent and partially reflective cone at each level, with a light shelf that reflects towards the ceiling solar radiation coming from the sun with low elevation angle.
In this paper, the authors show the results of an experimental analysis carried out on a 1:2 scale model of the MDLP under a real sky in dynamic conditions, measuring illuminance in twelve points on a horizontal work plane in the passage room.
2. The modified double light pipe (MDLP)
The MDLP is an innovative daylight transport system set up by the authors modifying the DLP, which is described in [38] and [39].
Both the DLP and the MDLP have been designed to illuminate two underground levels of a building. The first one consists of two coaxial tubes. A highly reflecting film covers the internal and external surfaces of the inner tube, while the external one is made with transparent polycarbonate. Daylight introduced in the internal tube illuminates the final room like a traditional light pipe, while that entering the cavity between the two pipes is delivered in the passage room. The overall dimensions of the system are tolerated thanks to the illuminating function that it performs even in the passage area.
The MDLP considerably reduces the system bulk, since the lower part of the outer tube is cut. It also improves the performance of the device, thanks to a reflecting panel fixed to the ceiling and a circular light shelf applied 300 mm distant from the ceiling. This last is suitable to increase the uniformity of light distribution in the environment and avoid the risk of glare since it prevents the occupants from seeing the upper portion of the device with the highest luminance. The authors showed the principal features of the MDLP in [1].
Figure 1 represents the features of the two systems and highlights the smaller size of the MDLP.
Figure 1
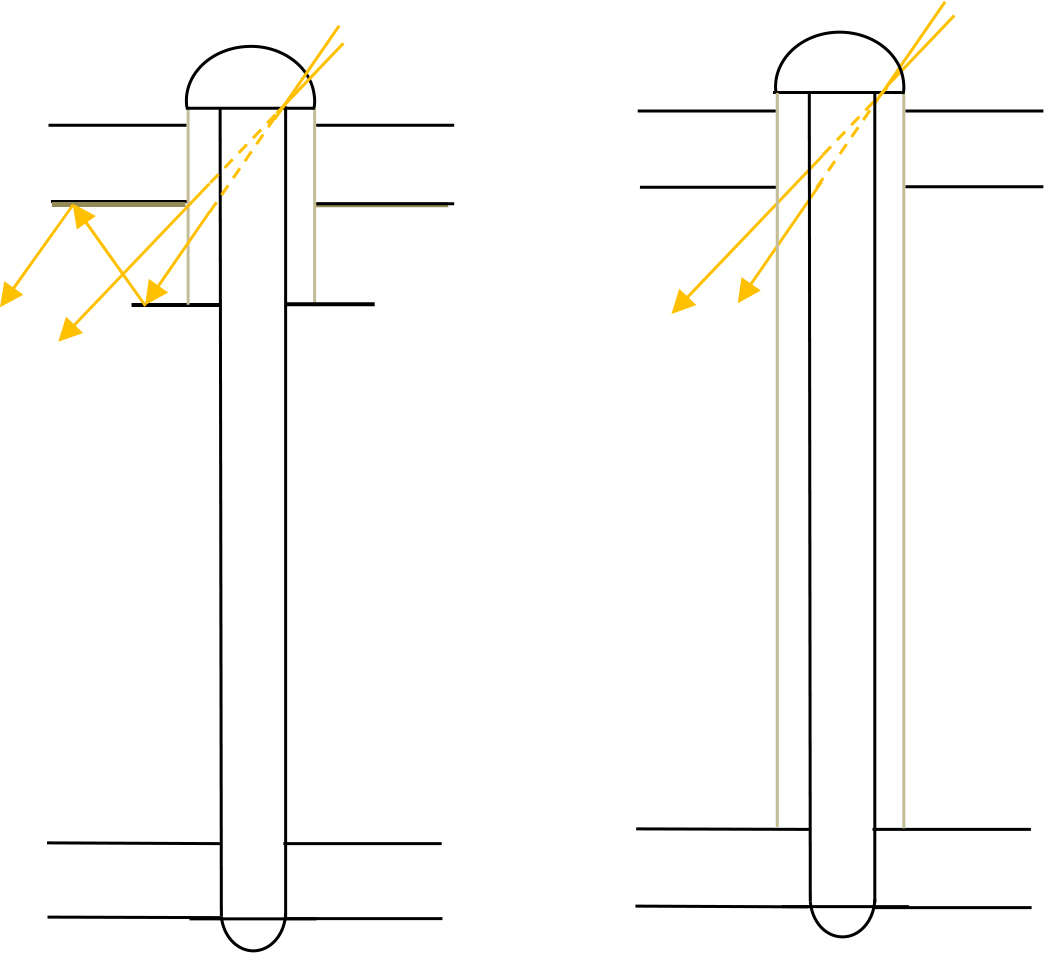
Fig. 1. Schematic representation of the MDLP (a) and the DLP (b).
3. Description of the experimental apparatus
The authors carried out the experimental activity under a real sky on a wood 1:2 scale model of a 3.8x3.8 m plan area room, 3.0 m high, which simulates the passage room of a two-level hypogeal building illuminated only by the MDLP. The final room is not included in the apparatus, since the system illuminates it as a traditional light pipe whose performance is known.
The vertical walls are made of unpainted multilayer wood. The floor is covered by sheets of grey drawing paper, while a ϕ = 100 mm circular grey panel is applied over the ceiling around the external tube, and a circular light shelf covered by a highly reflective film is suspended parallel to the ceiling, 300 mm from it. The internal pipe of the MDLP is made of PVC whose upper part is externally covered by the same reflective film applied on the light shelf, while the lower portion is covered by the same sheets of green paper used for the floor. The external pipe is made of transparent polycarbonate. Figure 2 shows the MDLP and the test room, while Table 1 shows the luminous reflectance of the walls, floor, and ceiling of the test-room, and all the components of the device.
Figure 2
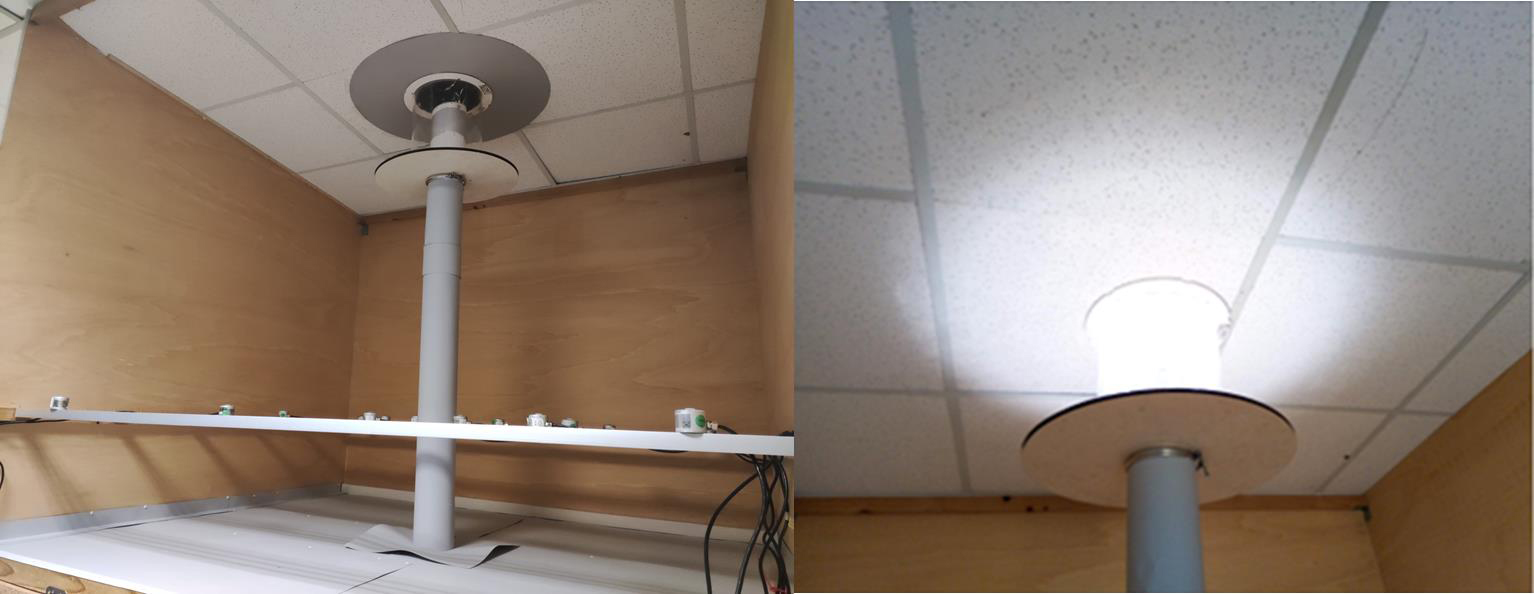
Fig. 2. The MDLP and the test room.
Table 1
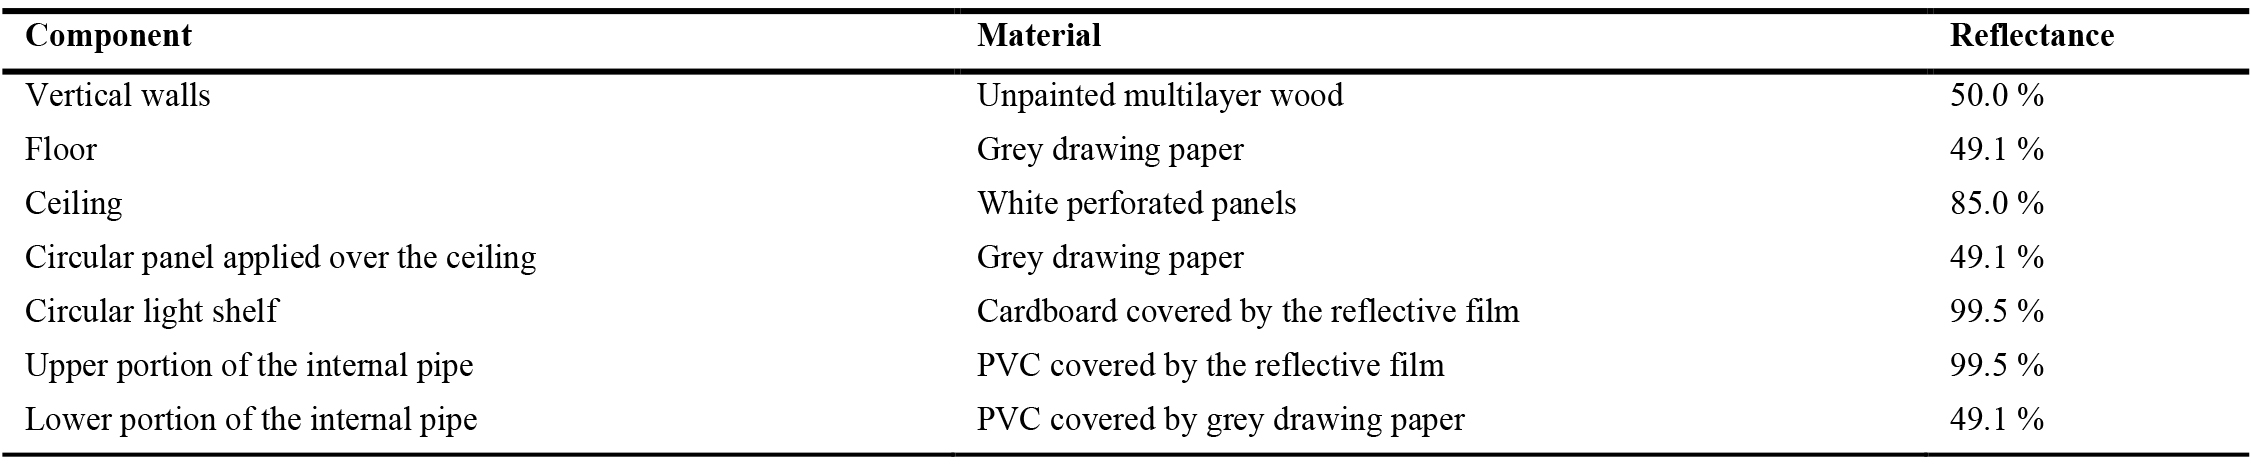
Table 1. Luminous reflectance of walls, floor, and ceiling of the test room and the components of the MDLP.
The authors measured the internal illuminance (Ein) with twelve CIE lux-meters type LSI-BSR001, range 0–25 klx, accuracy 3% of the reading value, positioned on a horizontal work plane 400 mm high on the floor that simulates a real scale surface 800 mm high on the floor, as shown in Fig. 3. The external illuminance Eext was measured by a CIE sensor type LSI-DPA 503, range 0–100 klx, tolerance 1.5%, positioned on the top of the building under an unobscured sky close to the collector as shown in Fig. 4. Data were registered by two data-loggers, type LSI Lastem ELO 310.
Figure 3
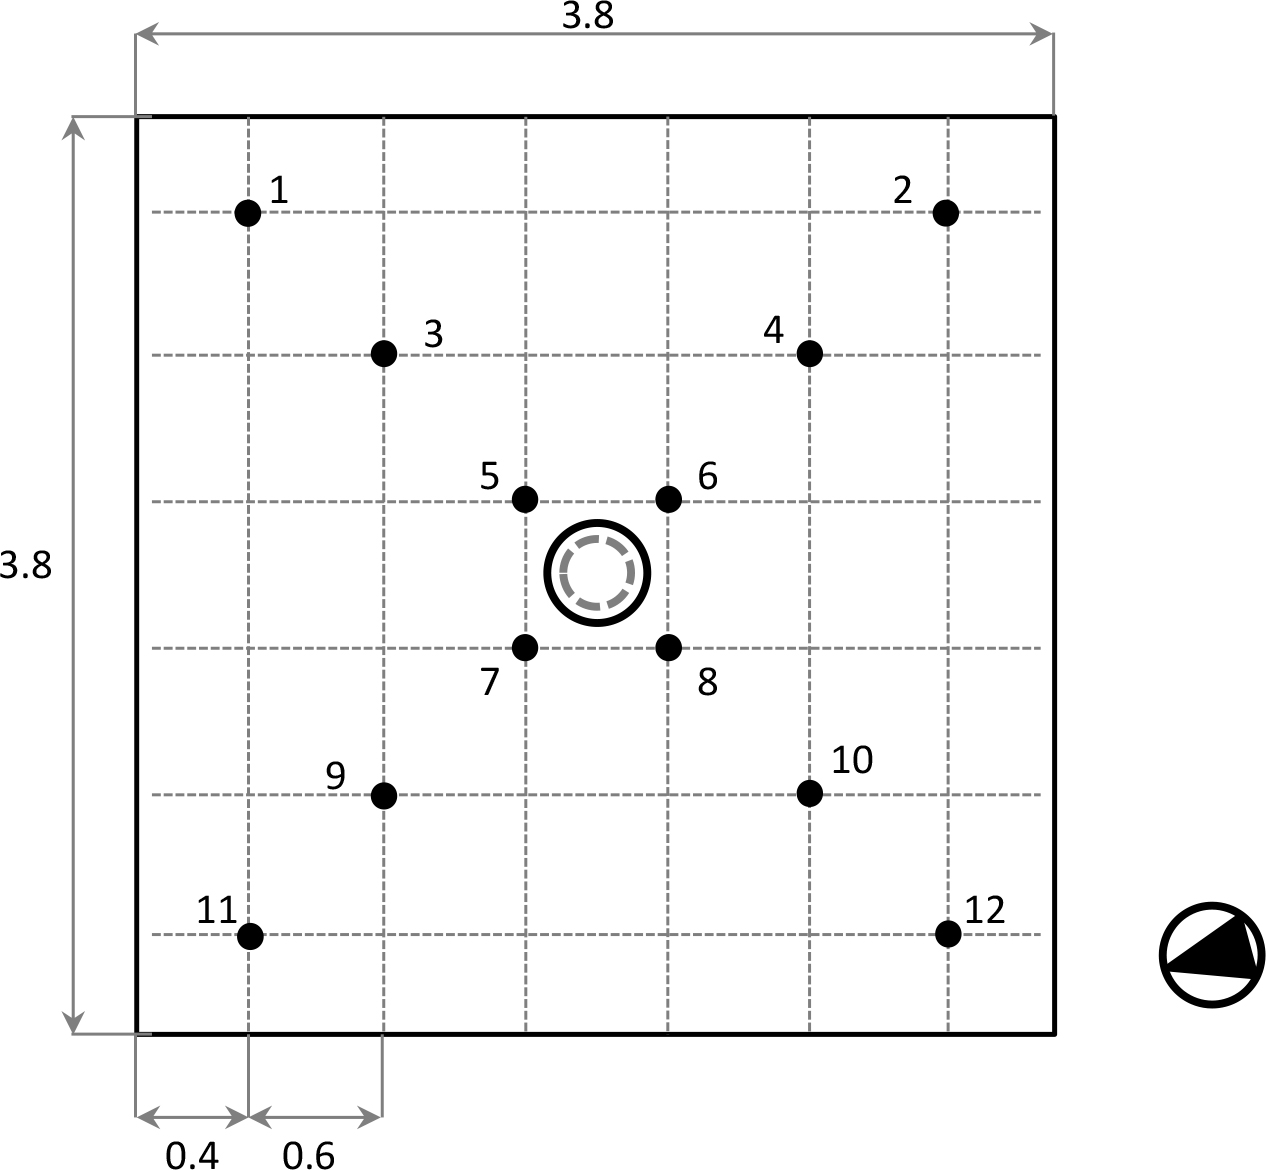
Fig. 3. Configuration of the internal luxmeters on the work plane.
Figure 4
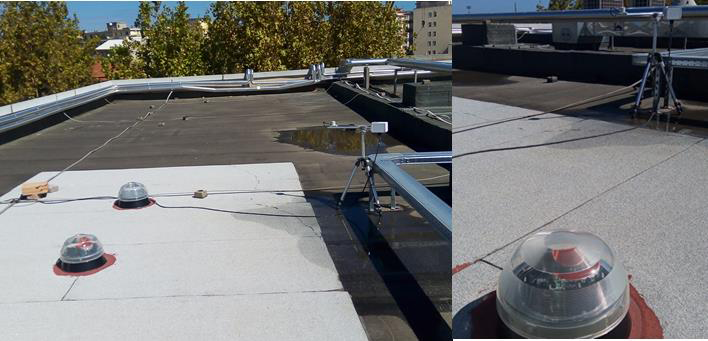
Fig. 4. The external sensor on the top of the building near the collector of the MDLP.
4. Daylight indexes
The authors calculated some daylight metrics to define the performance of the MDLP.
As the tests were carried out under real sky in variable conditions, they did not consider the static metric DF. Alternatively, they calculated the DR, defined as the ratio between the internal illuminance in a measure position and the external illuminance on a horizontal work plane, for some representative test days in different climatic conditions (sunny or cloudy).
Secondly, they examined two dynamic daylight indexes: DA and cDA. These metrics are usually calculated by one-year data. However, since experimental data relating to only four months were available, they determined these parameters monthly, from December 2021 to March 2022.
DA is defined as the fraction of time in which the illuminance in a point is higher than a reference value. In this paper, two reference values are considered: 100 lx and 50 lx (see equations 1 and 2). The first one is the required value of illuminance for corridors and entrance halls in places for public assemblies, as well as for warehouses, resting rooms, boiler rooms in buildings for industrial activities, and for fully enclosed platforms, underpasses, or stairs/escalators with a medium number of passengers in railway installations, while the second is the required illuminance for drying rooms, man-size underfloor tunnels or production plants without manual operations in industrial buildings as well as for fully enclosed platforms, underpasses or access tunnels in railway installations and rooms for diagnostics with image enhancers and television systems in healthcare premises, as indicated by the rule EN 12464-1. Above all, these illuminance values, although not very high, can give a useful contribution to energy saving for every type of use, especially in underground environments.
with Fi = 1 if Ein ≥ 100 lx and Fi = 0 if Ein < 100 lx
with Fi = 1 if Ein ≥ 50 lx and Fi = 0 if Ein < 50 lx
To take into account the contribution of illuminances lower than 100 or 50 lx, the authors considered continuous Daylight Autonomy (cDA), as defined in Eqs. (3) and (4).
with Fi = 1 if Ein ≥ 100 lx and if Ein < 100 lx
with Fi = 1 if Ein ≥ 50 lx and if Ein < 50 lx.
The authors decided not to consider the Useful Daylight Illuminance (UDI), defined as the percentage of time in which the illuminance on a point of the room falls in a defined range. According to [41], this range is 100-2000 lx. Since the illuminances from the MDLP are much lower than 2000 lx, this parameter would not add useful information to that provided by the DA or the cDA.
Finally, the authors considered the index “Illuminance Uniformity” that, according to the EN 12464-1, can be defined as shown in Eq. (5), with a benchmark value U0 = 0.4 for the main applications foresaw:
5. Experimental results
The authors carried out an experimental activity on the reduced scale model of the system from December the 1st 2021 to March the 31st 2022, for 24 hours a day, collecting data every minute and elaborating them every ten minutes.
Figures 5-7 show respectively the results of a typical week (4-9 December), a typical sunny day (4 December), and a typical cloudy day (6 December).
Figure 5
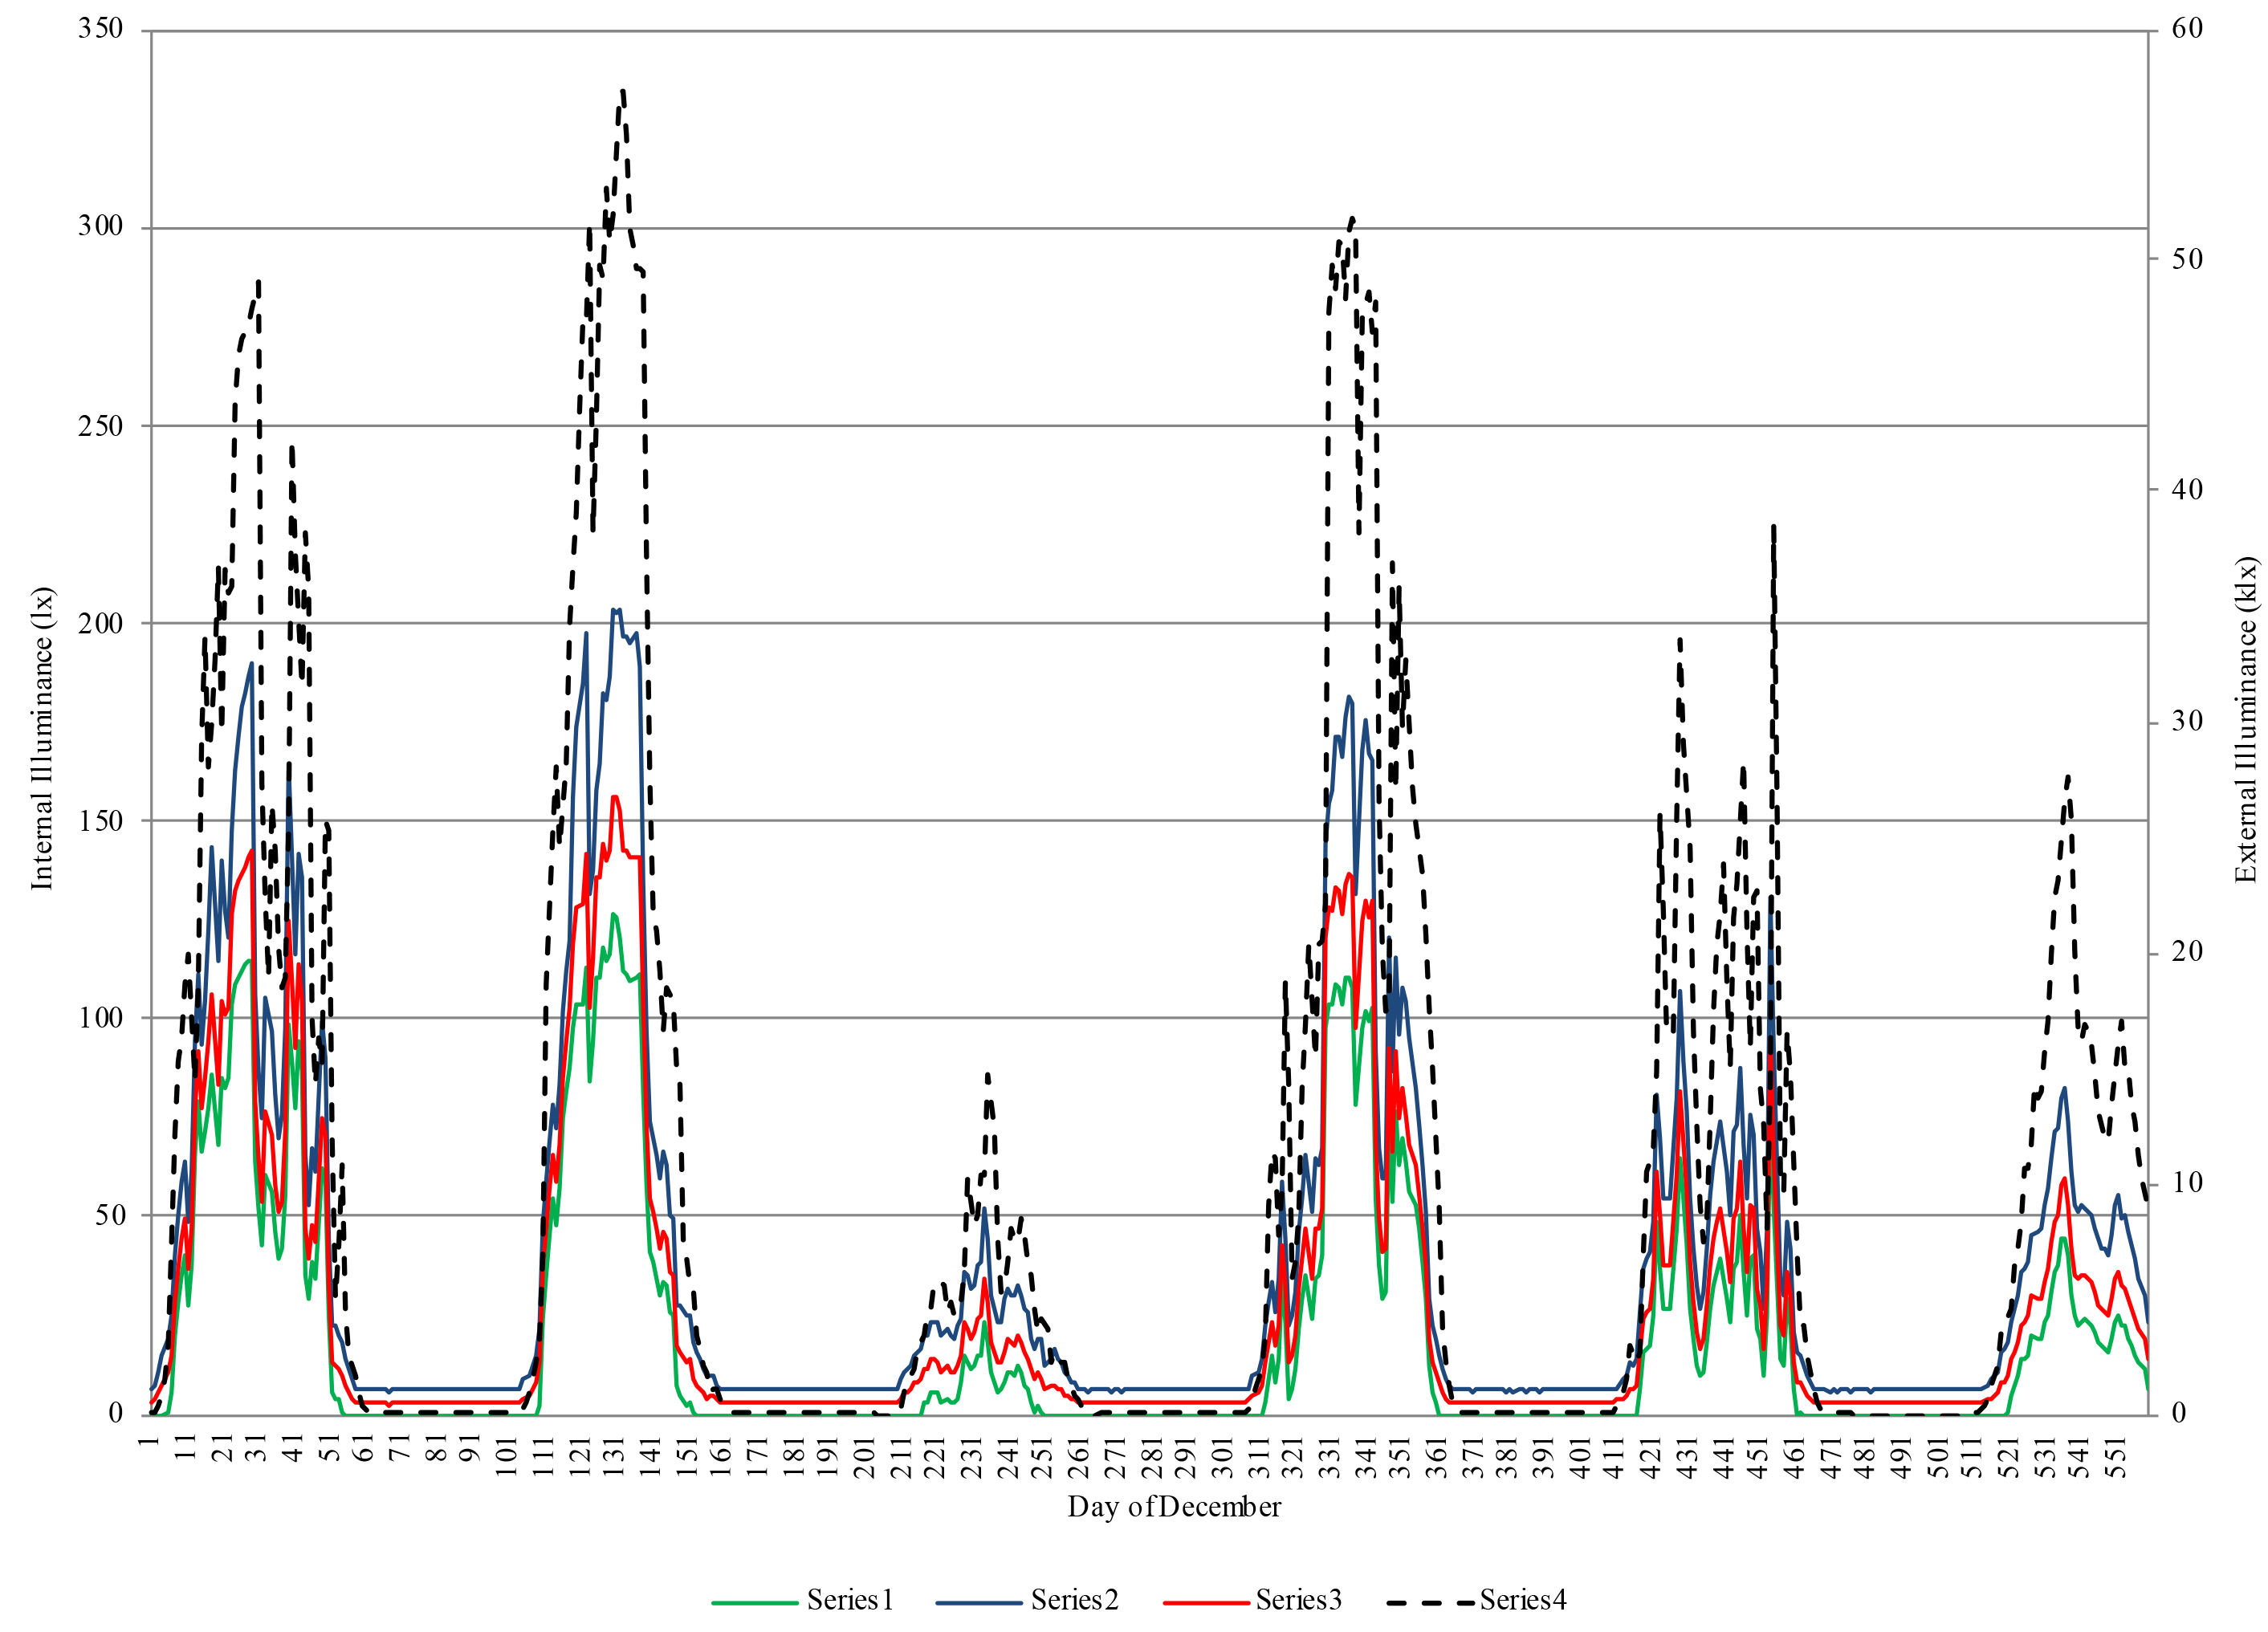
Fig. 5. Illuminance data of a typical week (4-9 December) – External illuminance referred to the right axis.
Figure 6
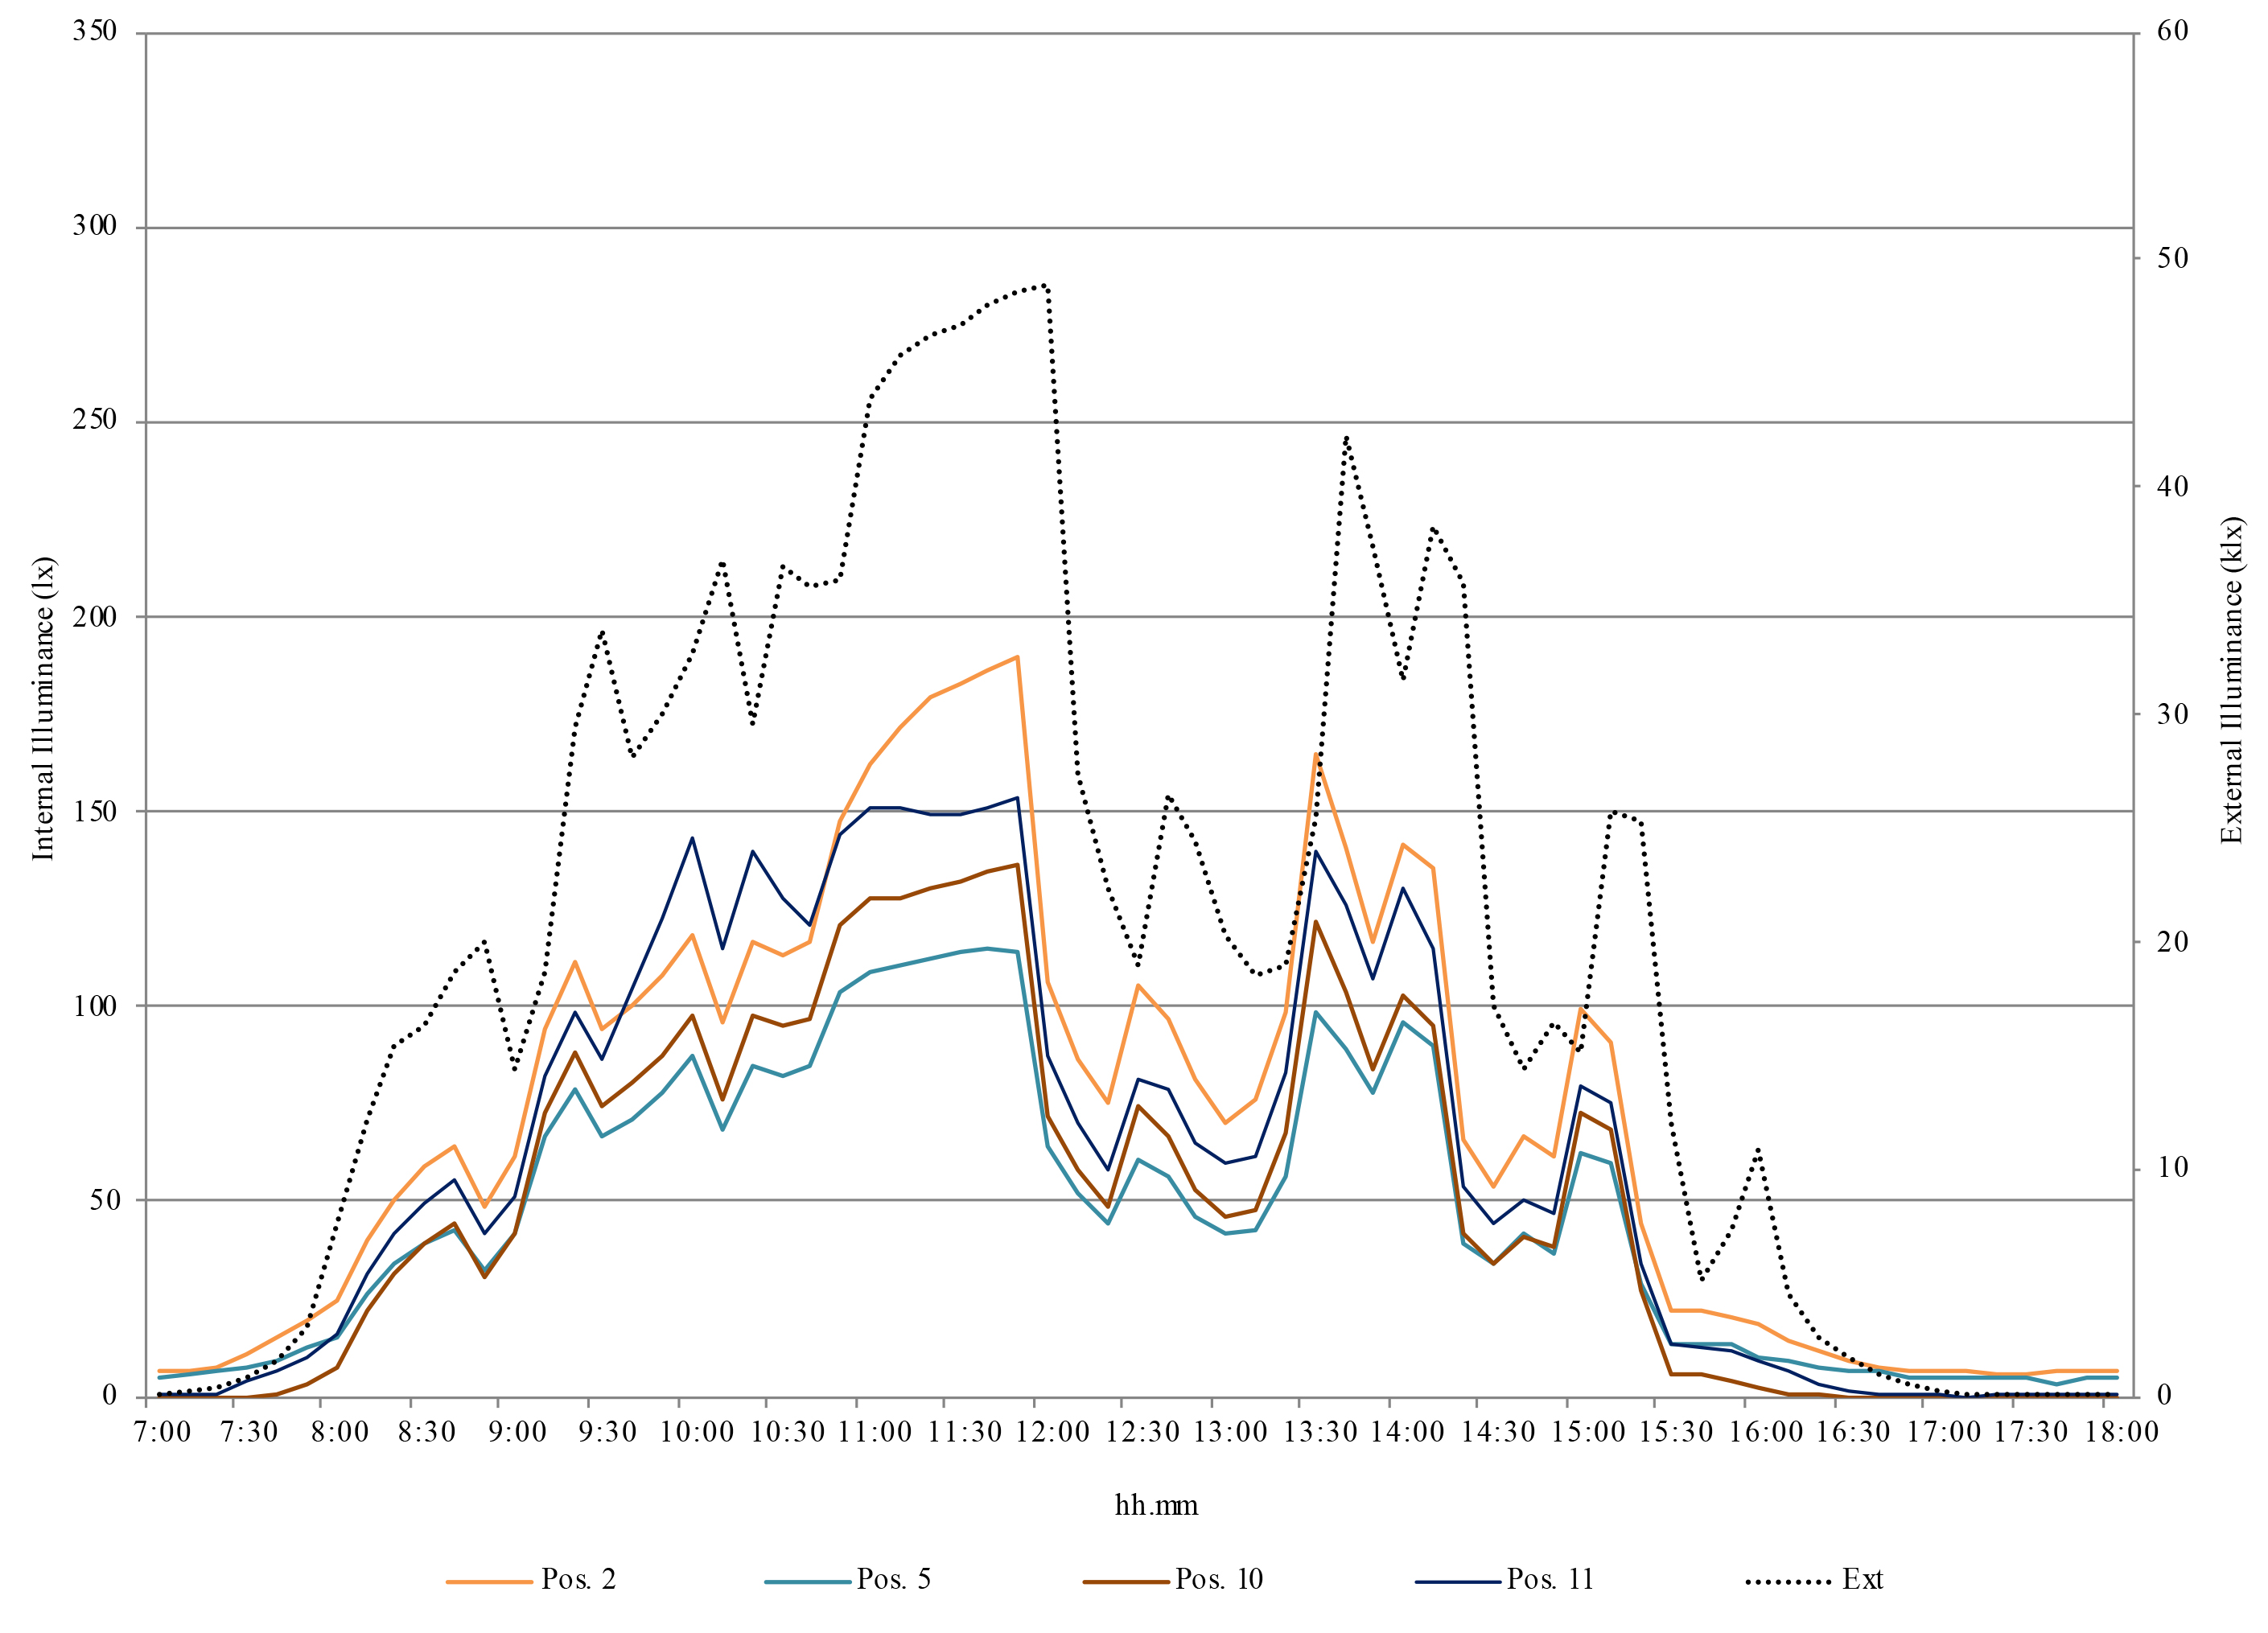
Fig. 6. Illuminance data of a typical sunny day (4 December) – External illuminance referred to the right axis.
Figure 7
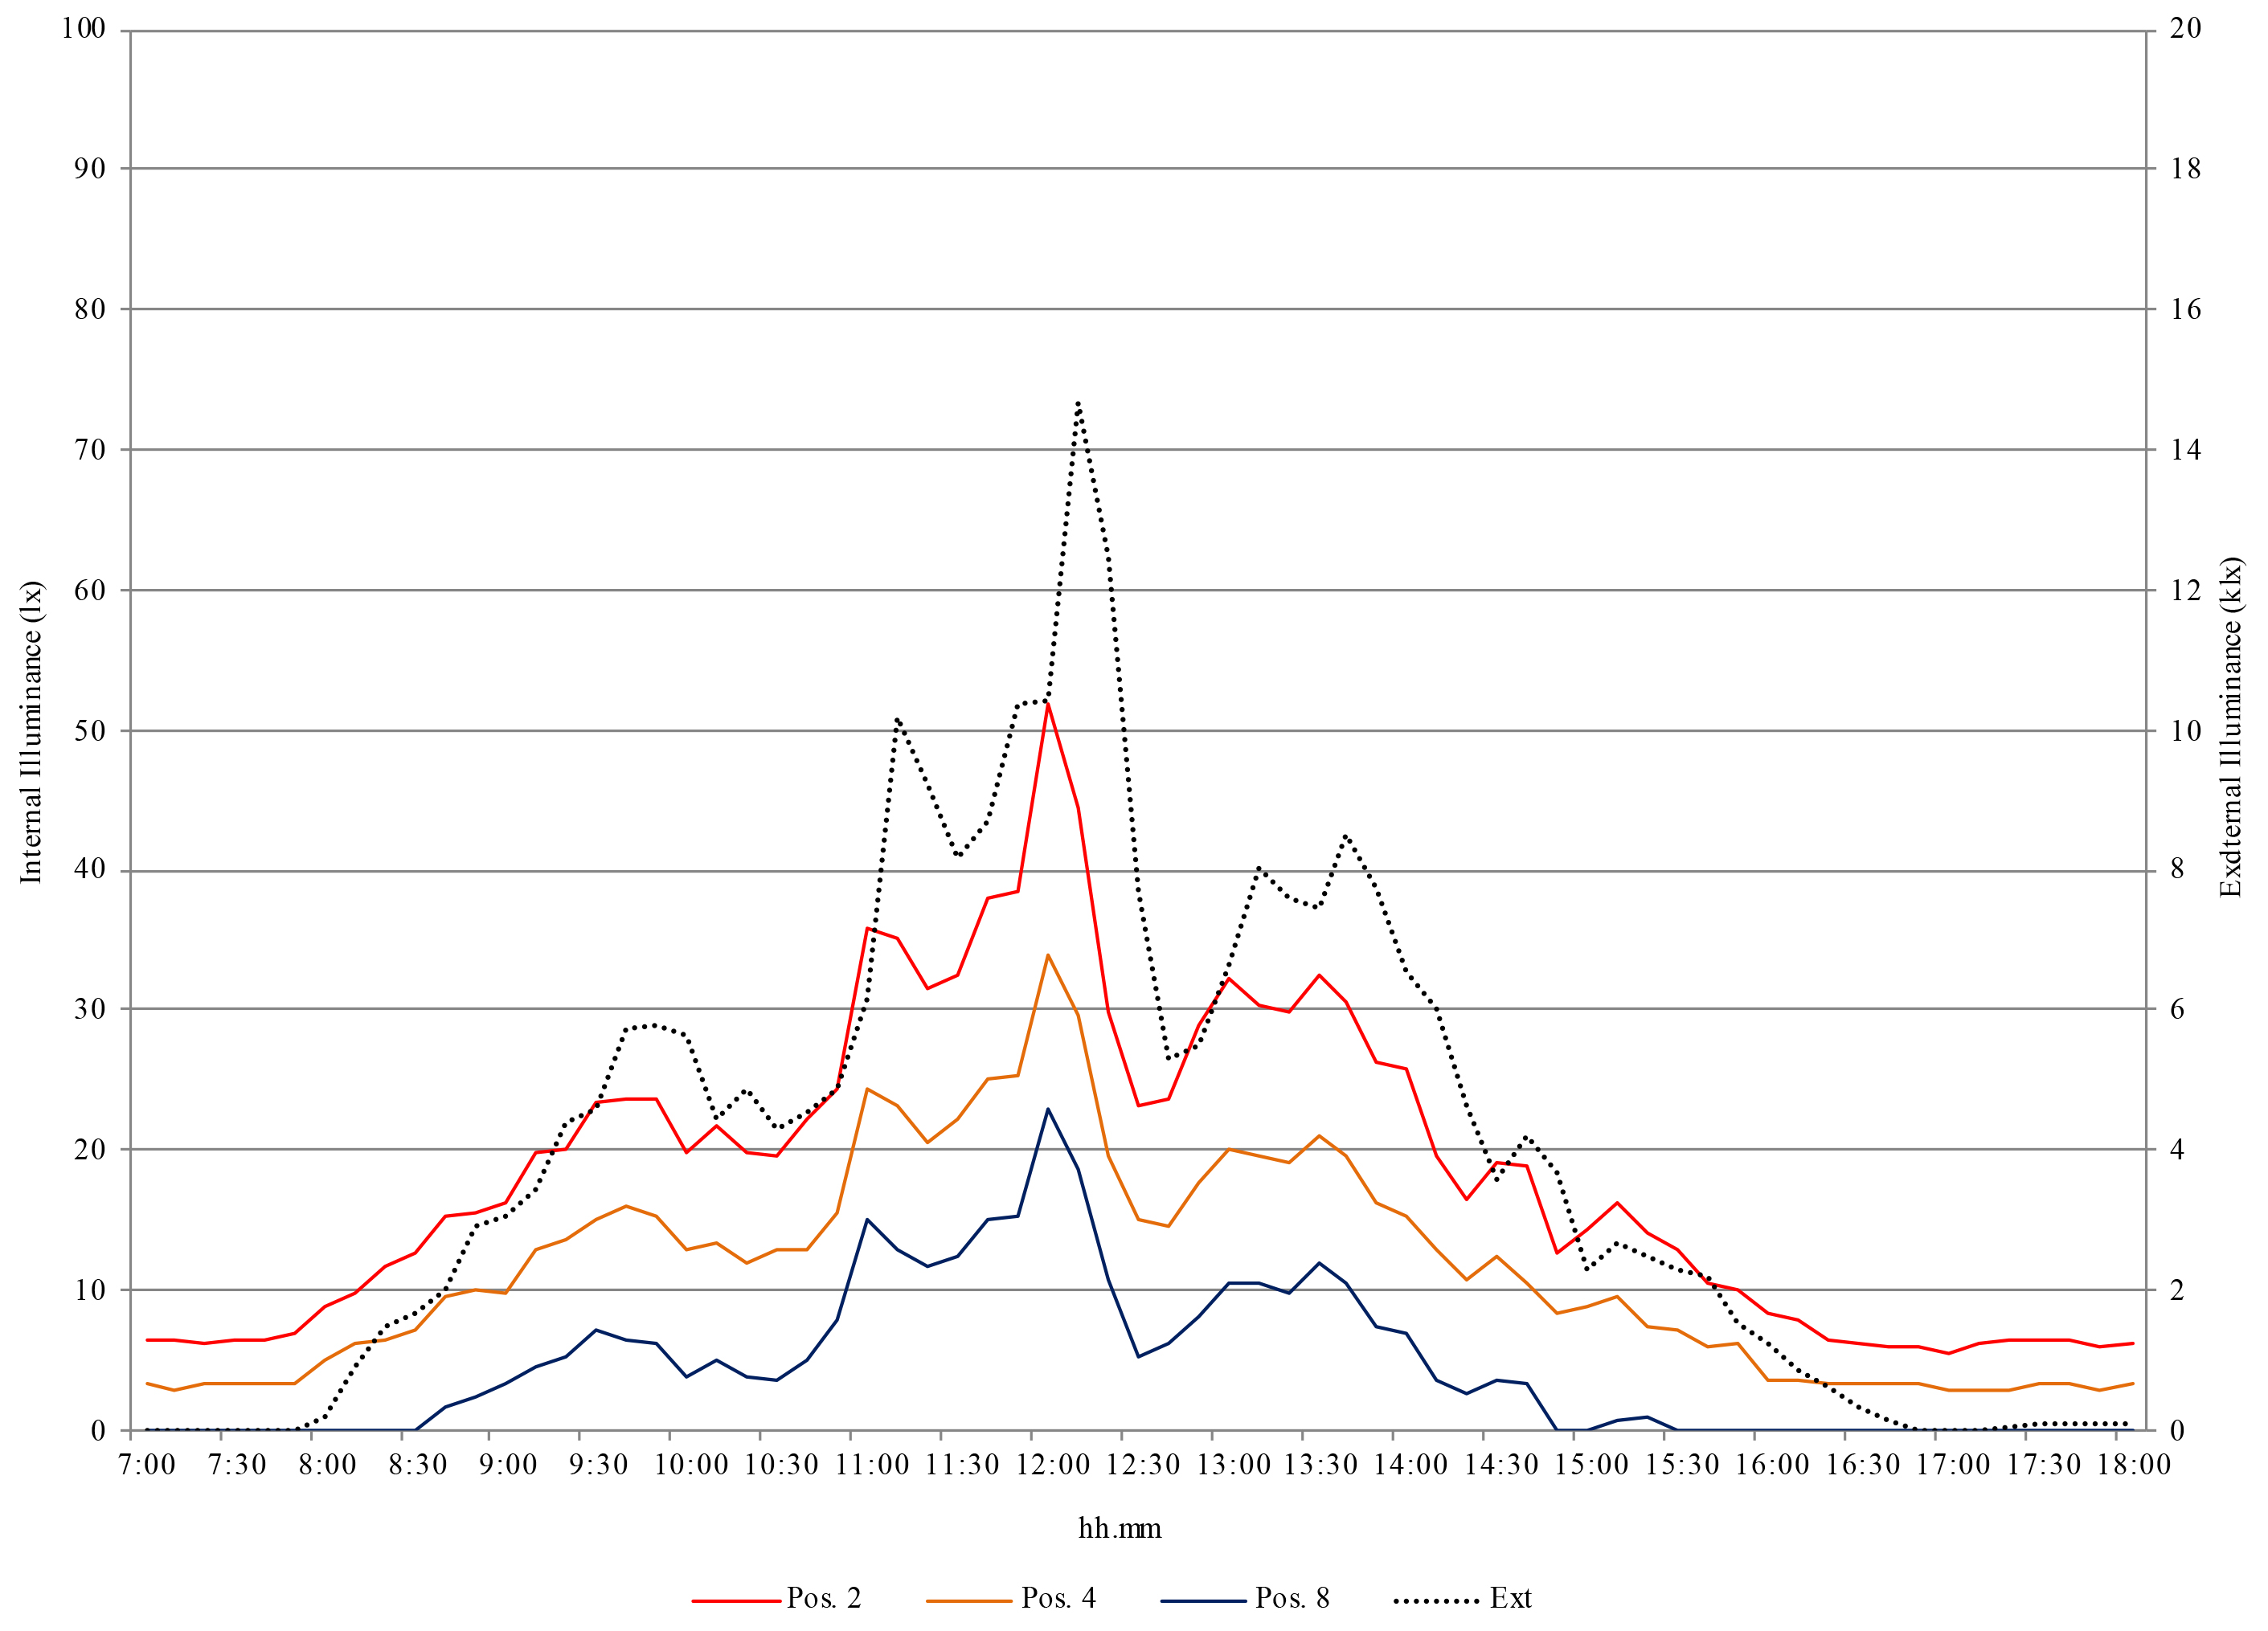
Fig. 7. Illuminance data of a typical cloudy day (6 December) – External illuminance referred to the right axis.
Figure 5 shows the trend of external illuminance and the minimum, maximum and average values of internal illuminance. Figure 6 shows the external illuminance, and data of sensors 2, 11, 10, and 5, where maximum (sensors 2, 11), average (sensor 10), and minimum (sensor 5) are registered most of the time. Similarly, Figure 7 shows data from sensors 2, 4, and 8 where maximum, average, and minimum values are respectively registered all the time.
As shown in Figure 5, the week from 4 to 9 December was characterized by alternating sunny days, with external illuminance peaks exceeding 50 klx, and cloudy days, with very low external illuminance. Figures 6 and 7 show respectively the illuminance trend on December the 4th (sunny day) and December the 6th (cloudy day). In both cases, the internal illuminance trend follows the external one fairly faithfully in all the measure positions. This is particularly true on December 6th (cloudy day), as evidenced by Fig. 7. The maximum values always occur in the corners of the room, particularly in position 2. This demonstrates by some means the ability of the light shelf of distributing natural light at a certain distance from the source, thus contributing to the light uniformity on the work plane.
In the first case (sunny day), the maximum external illuminance is about 49 klx and takes place at 12.00, while in the second one (cloudy day) the maximum external illuminance is about 15 klx and takes place at 12.10. In both cases, there is a time shift in advance of about ten minutes between the internal and external illuminances. While on December the 6th (overcast sky) the maximum illuminance takes place always in position 2, on the 4th (clear sky with sun) in the period between 9.40 and 10.40 the maximum illuminance value occurs in position 11, and in position 2 in the remaining time. This is probably due to the incidence of direct solar radiation, absent in cloudy days.
Figures 8 and 9 show the DR (%) on December 4th and 6th respectively. It follows a very regular trend in all the measure positions. The DR values range very regularly between 0.3 and 0.7 % on sunny days, and between 0.2 and 0.6 % on cloudy days for most of the time between 8.30 and 16.00 Data registered after 16.00 have not been considered since illuminance values are influenced by the artificial street lighting while on December 6th high values of DR occur from 8 to 8.30 probably due to very low values of external illuminance.
Figure 8
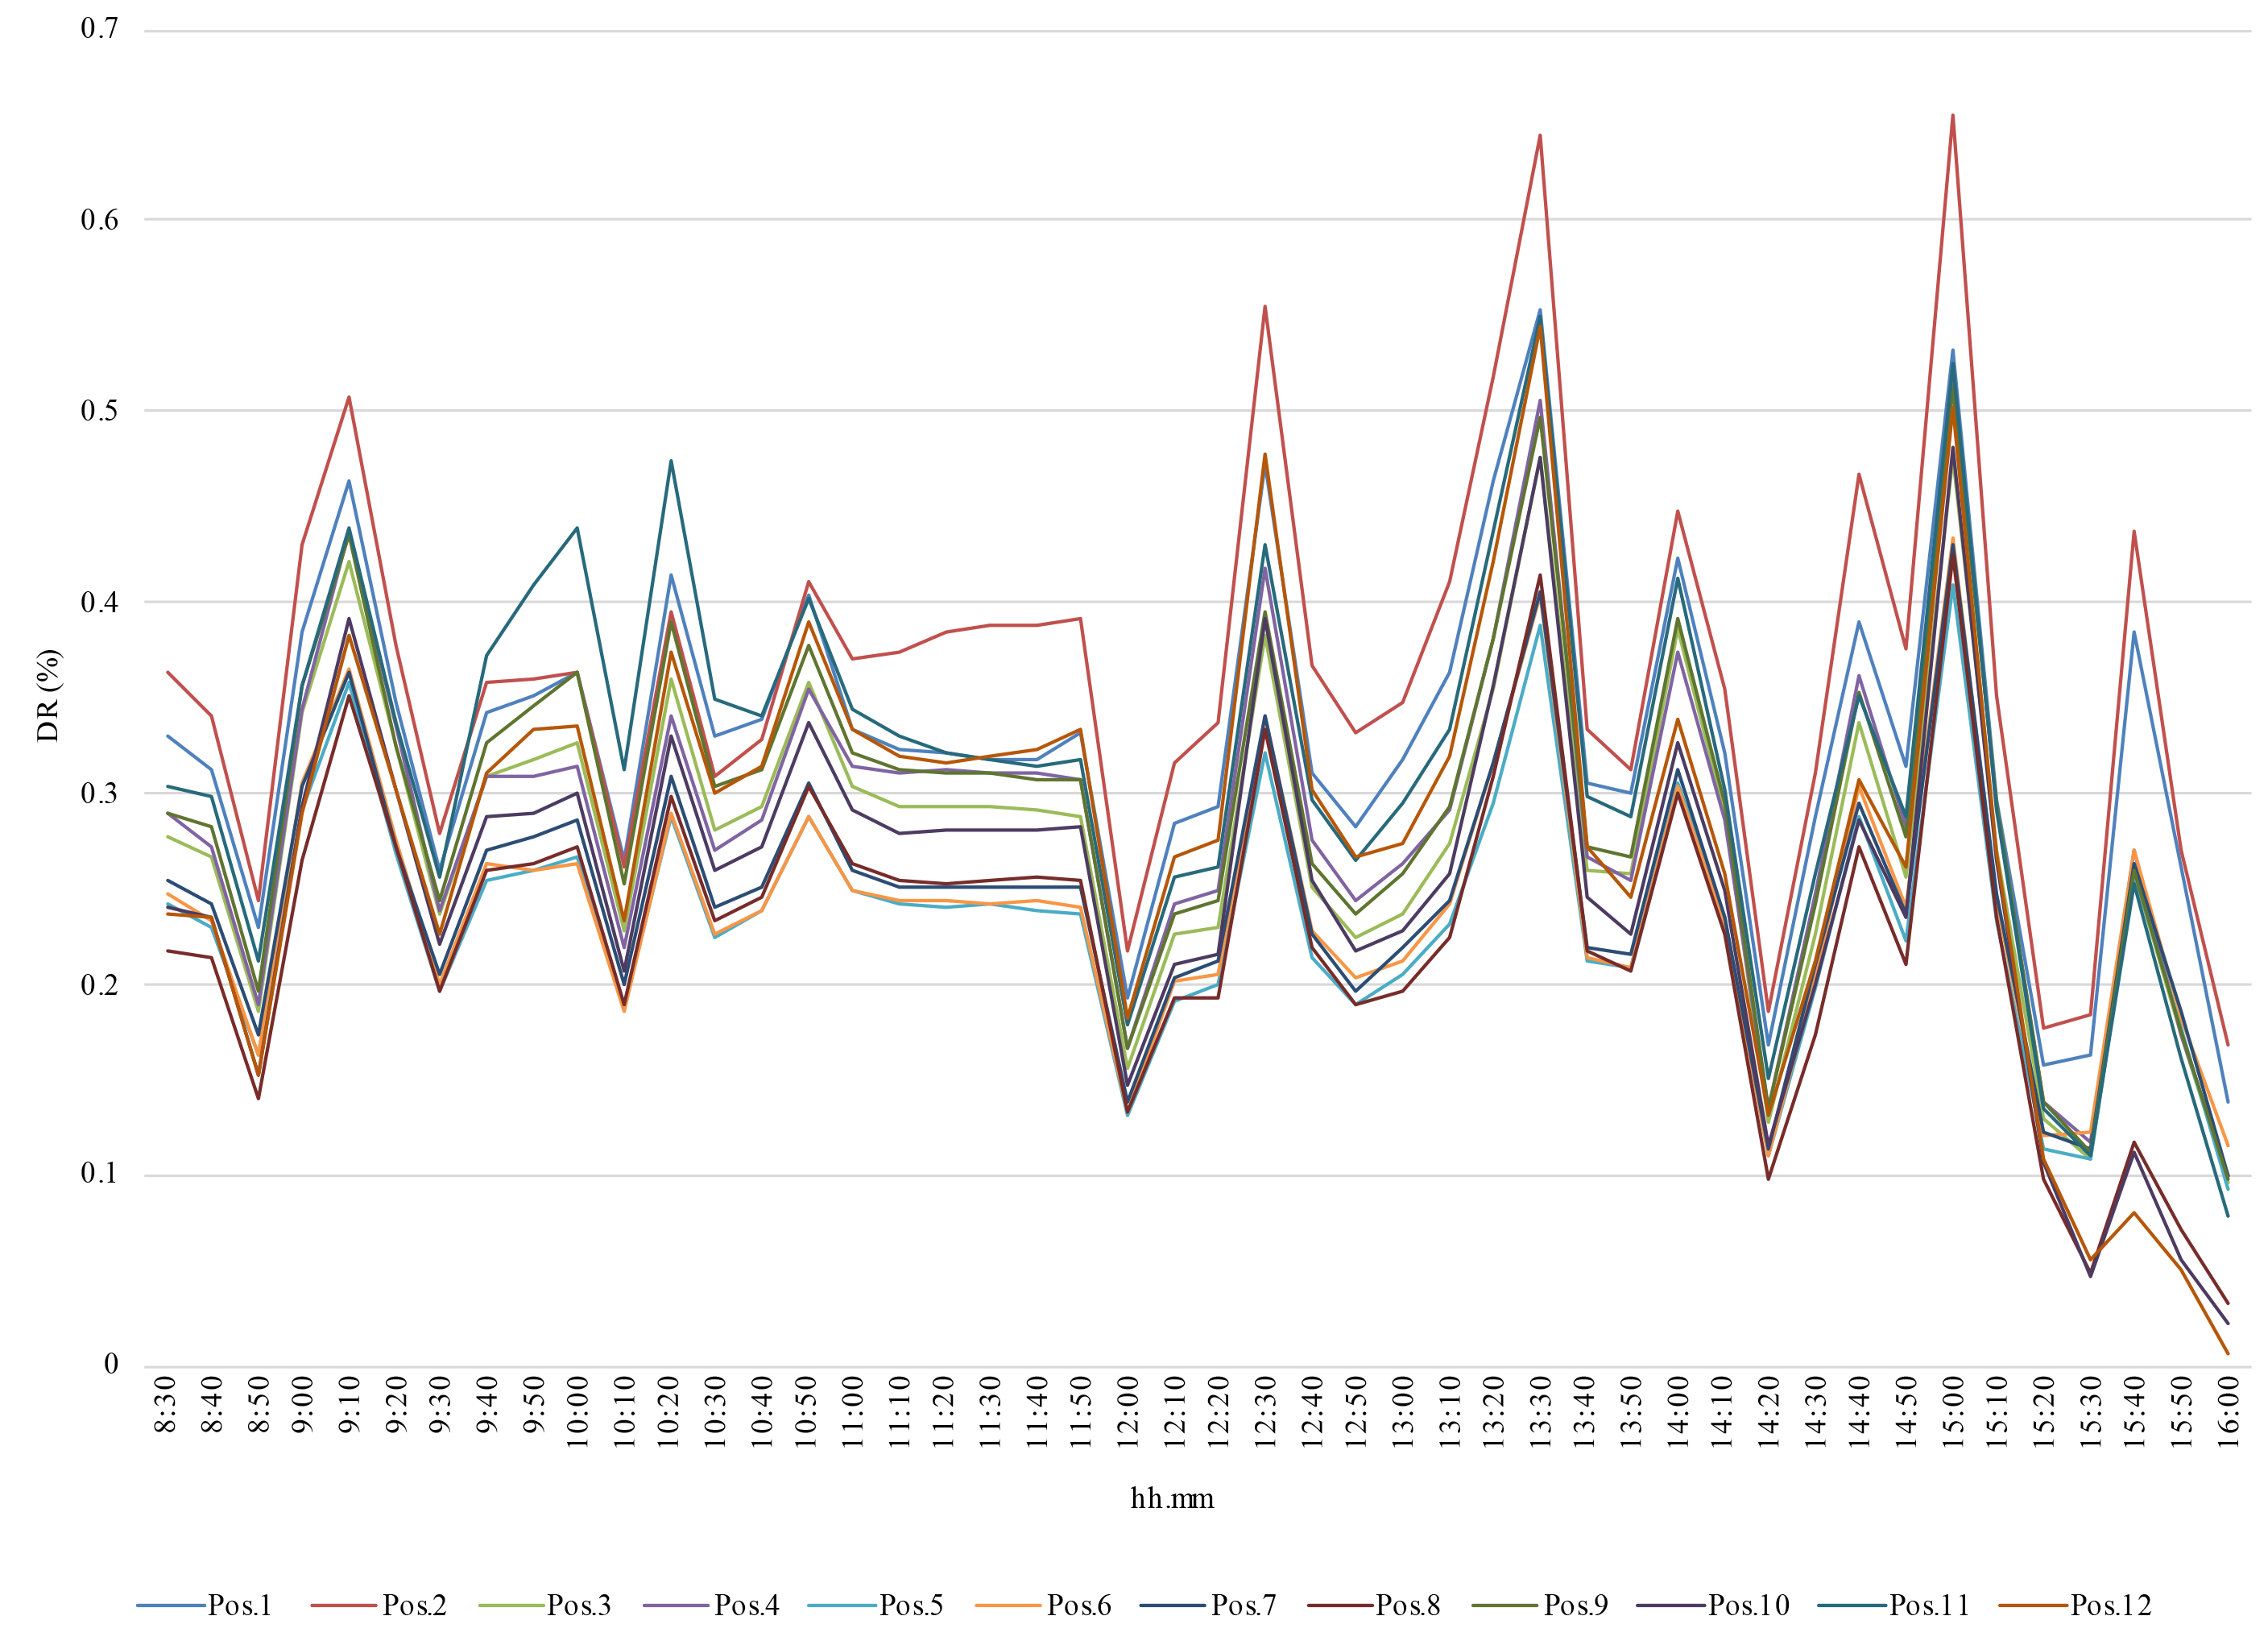
Fig. 8. DR (%) on 4 December (typical sunny day).
Figure 9
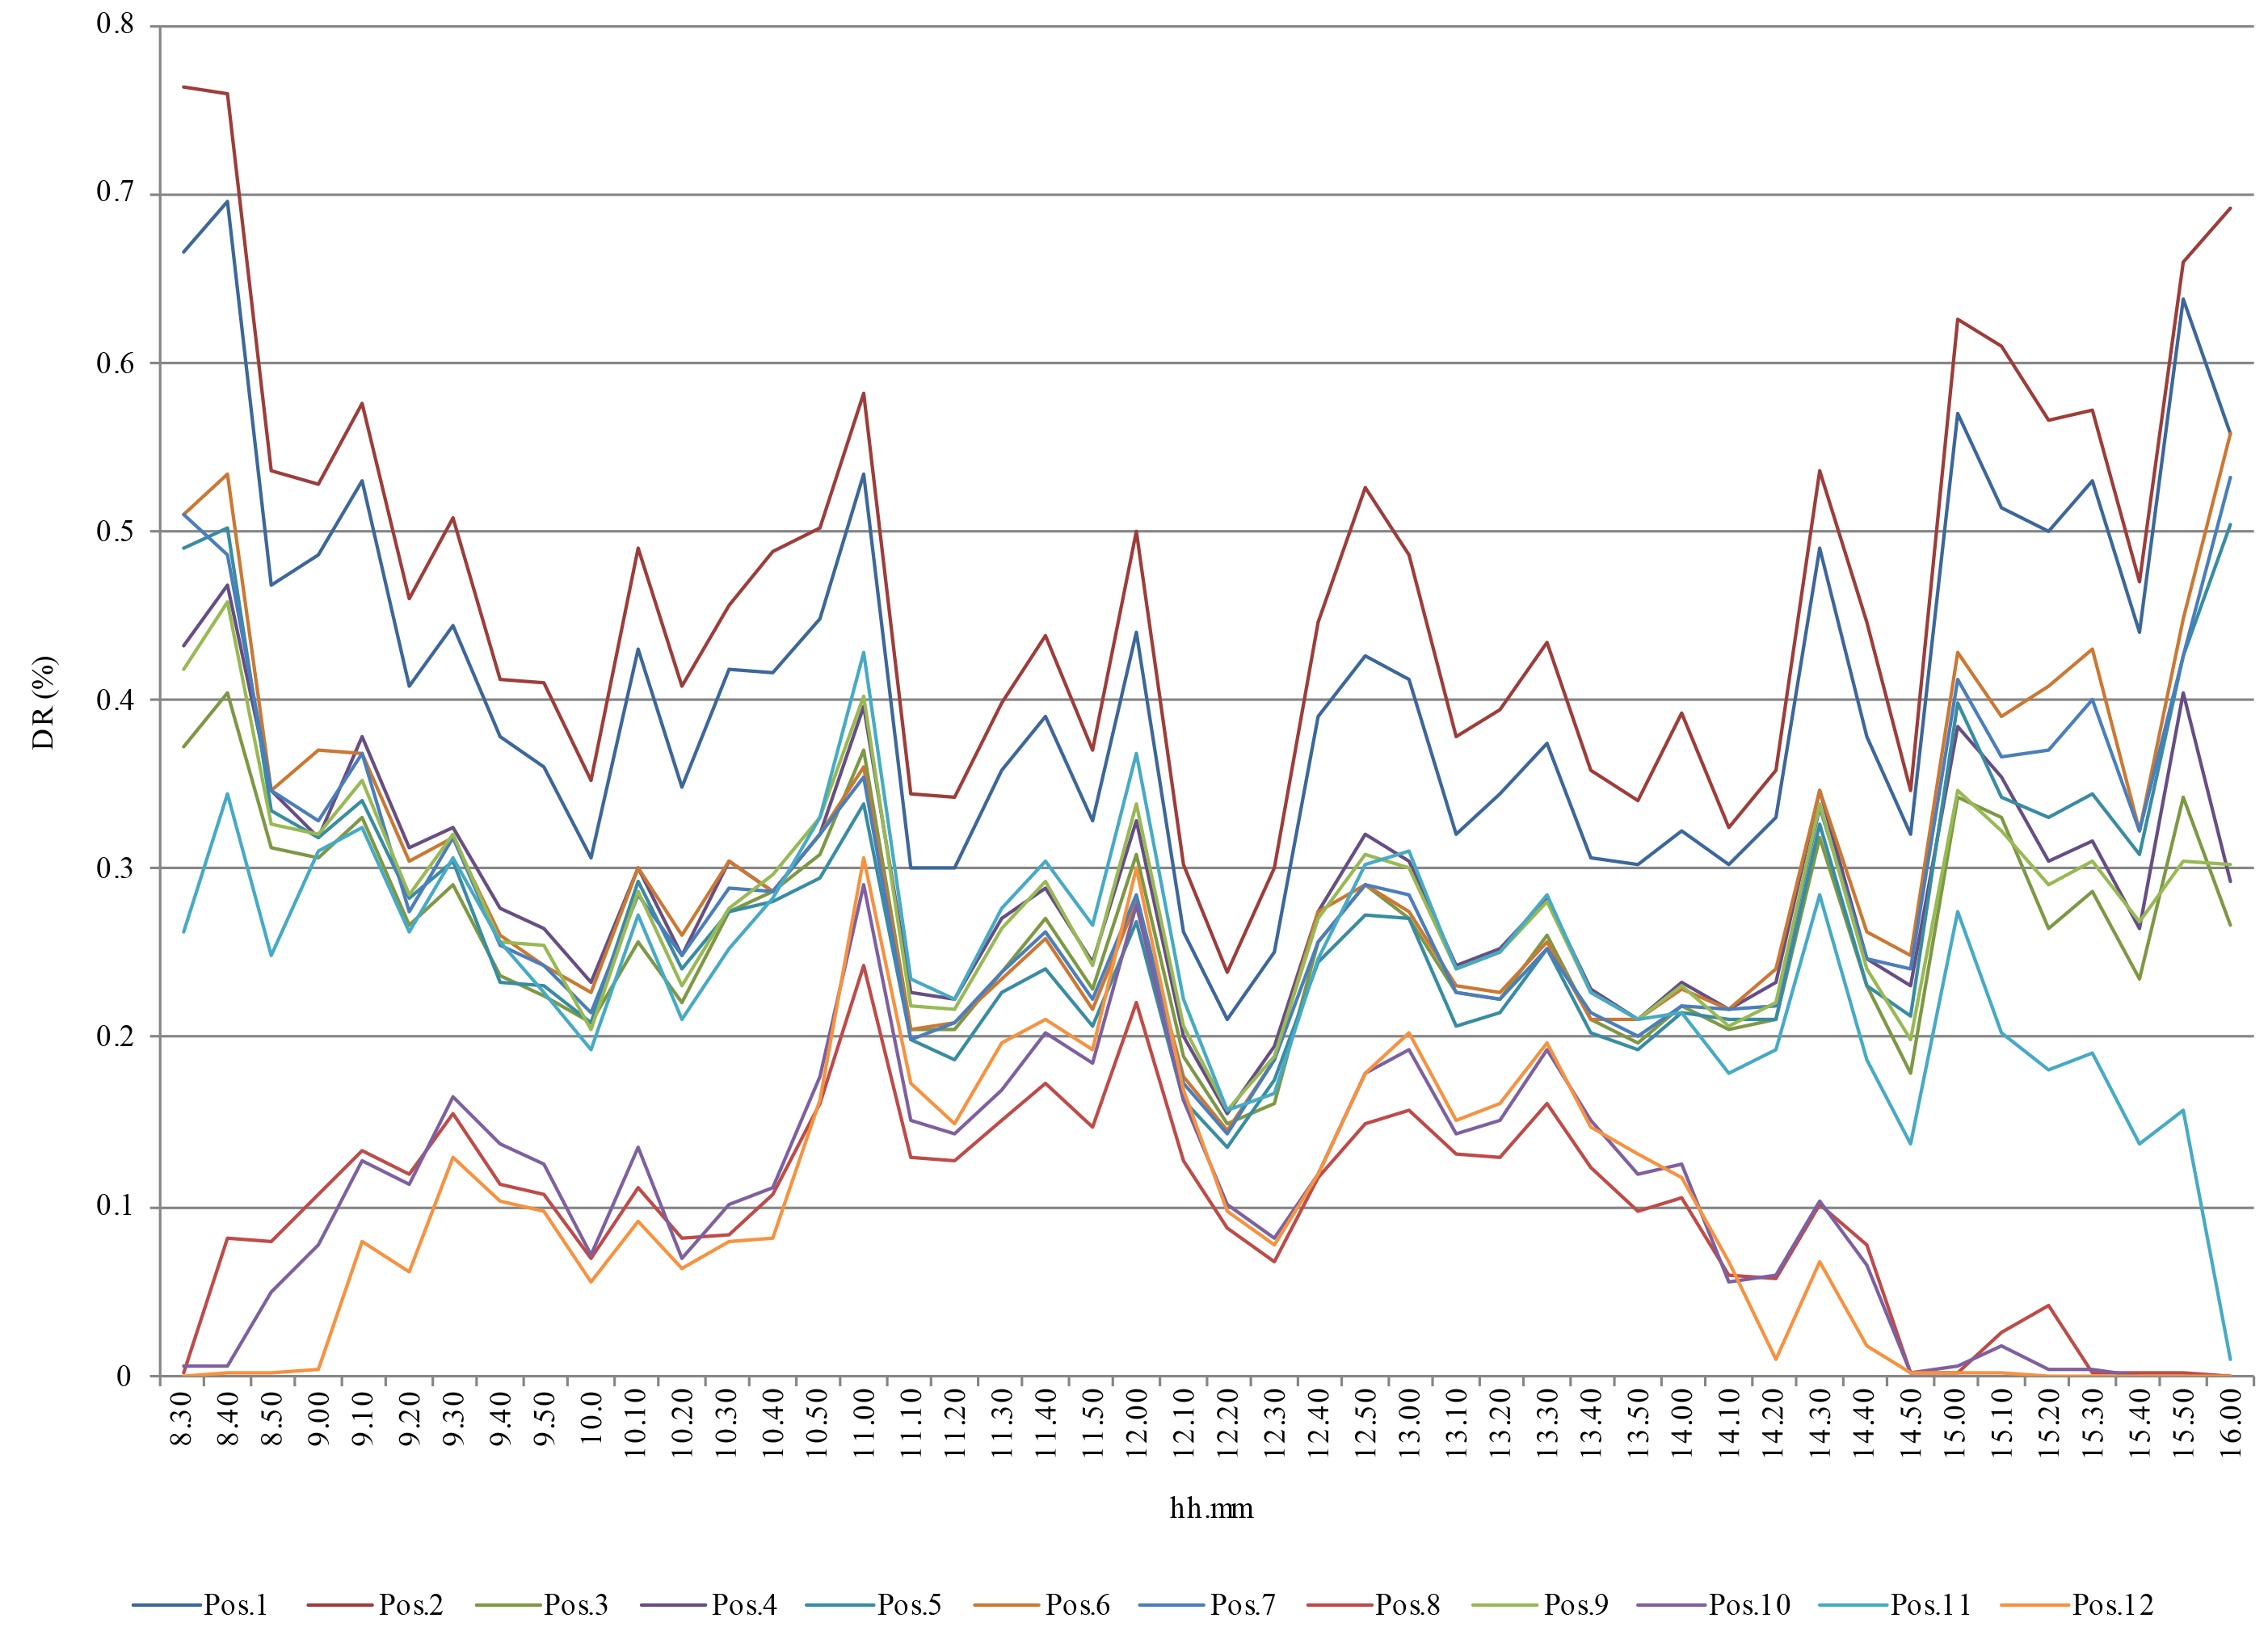
Fig. 9. DR (%) on 6 December (typical cloudy day).
In Appendix A Tables A1 and A2 show the DR (%) in all the measure positions on December 4th and 6th respectively, as well as the maximum, minimum, and average values of DR (%) in all the measure positions.
Table 2 summarizes the Daylight Autonomy and the continuous Daylight Autonomy with a reference value of 100 lx, for all the test days from December to February, while Table 3 shows the same data for the reference value of 50 lx.
Table 2
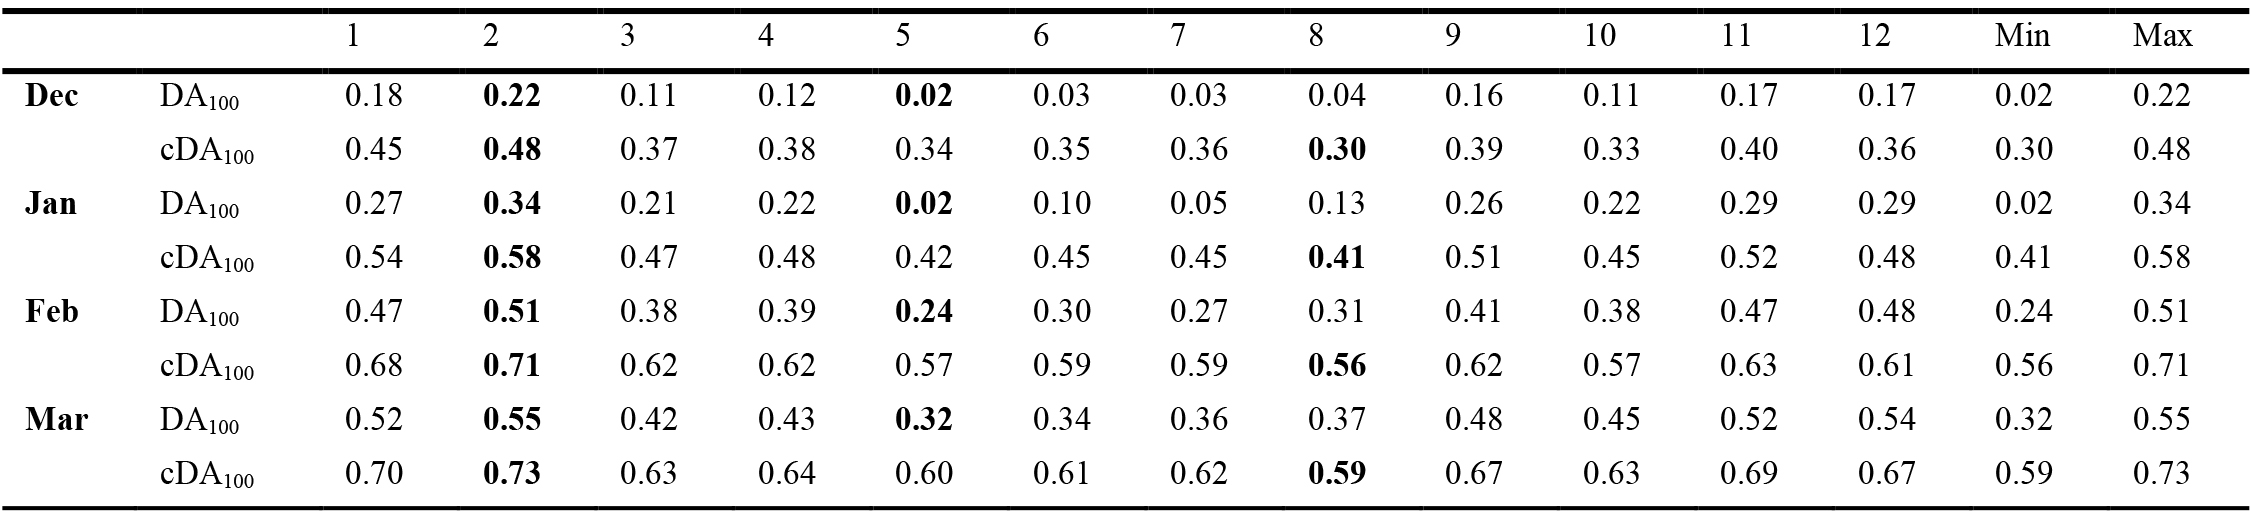
Table 2. DA100 and cDA100 from December 2021 to February 2022.
Table 3
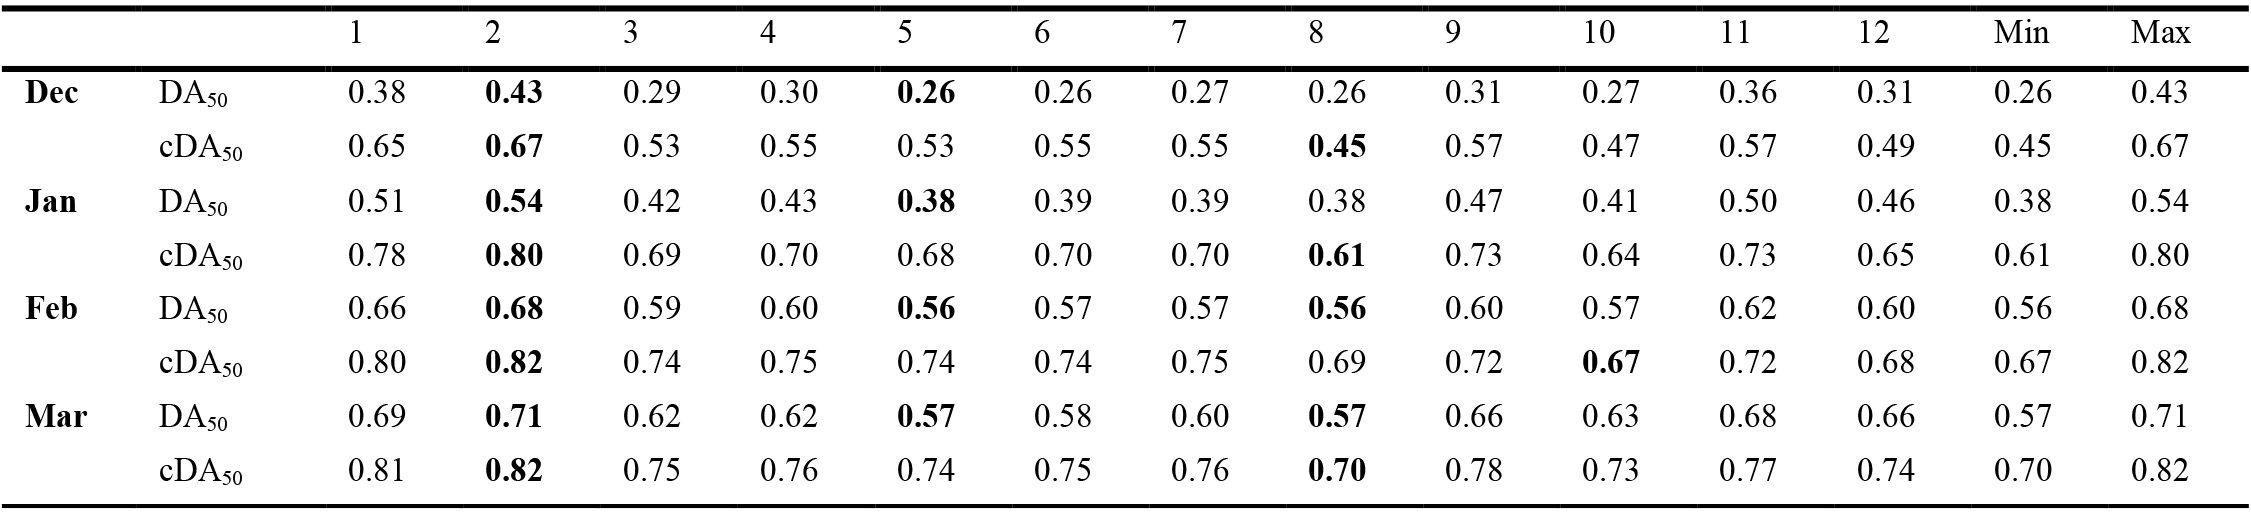
Table 3. DA50 and cDA50 from December 2021 to February 2022.
Figures 10-13 show the same data in a graphic form.
Figure 10
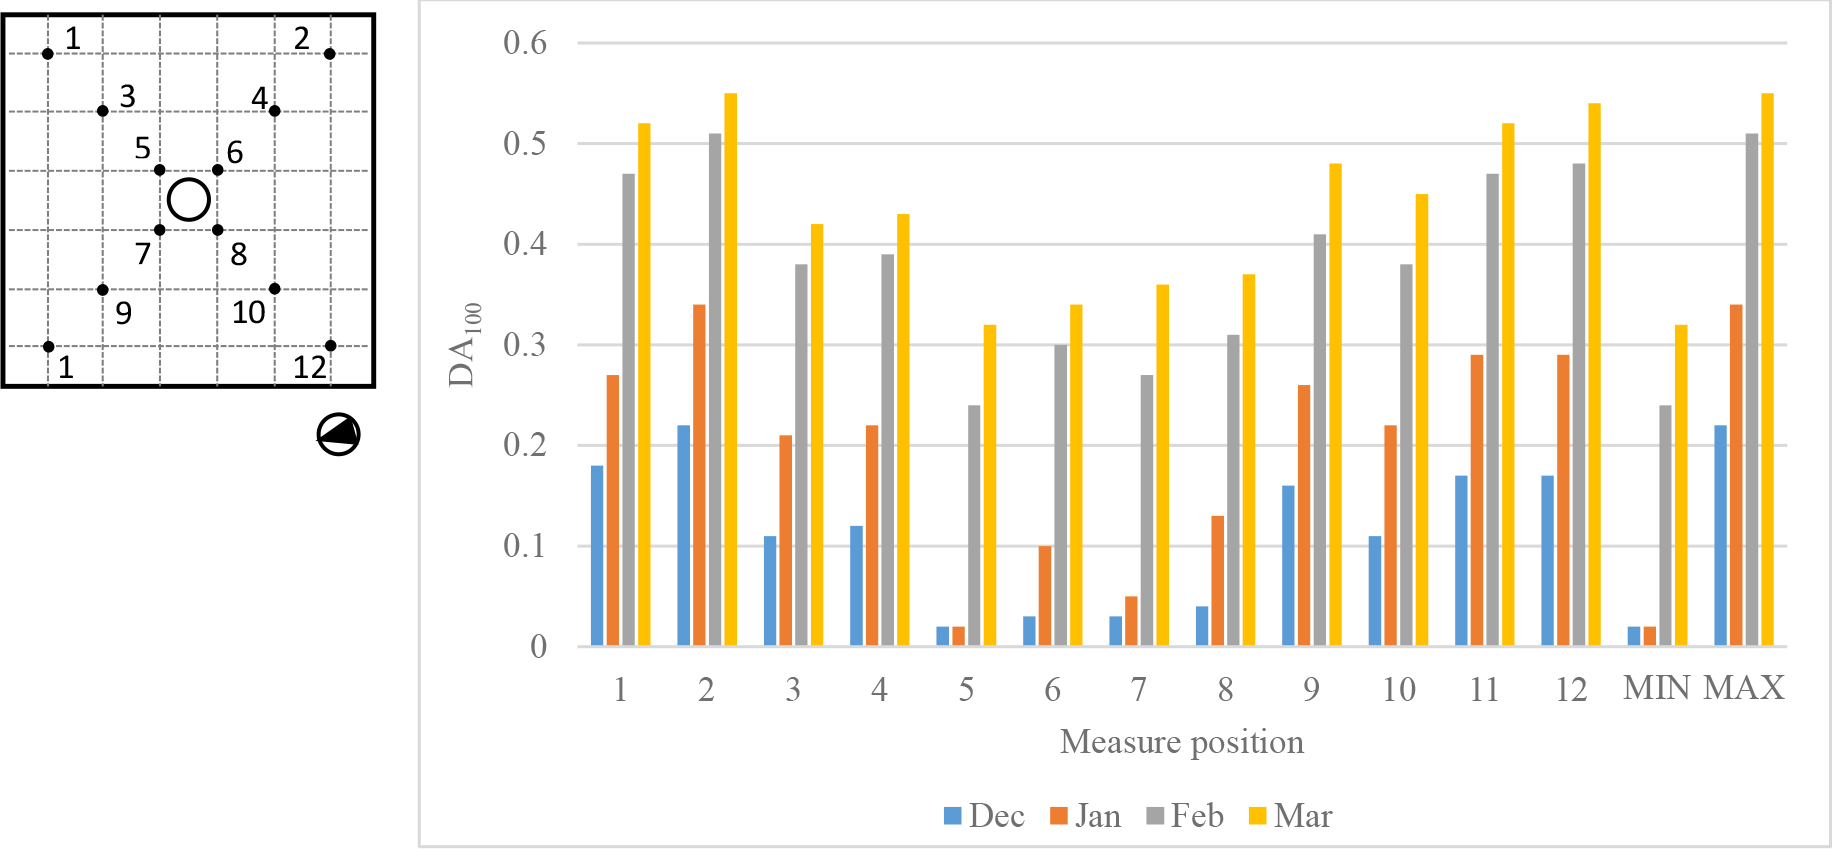
Fig. 10. DA100 from December 2021 to February 2022.
Figure 11
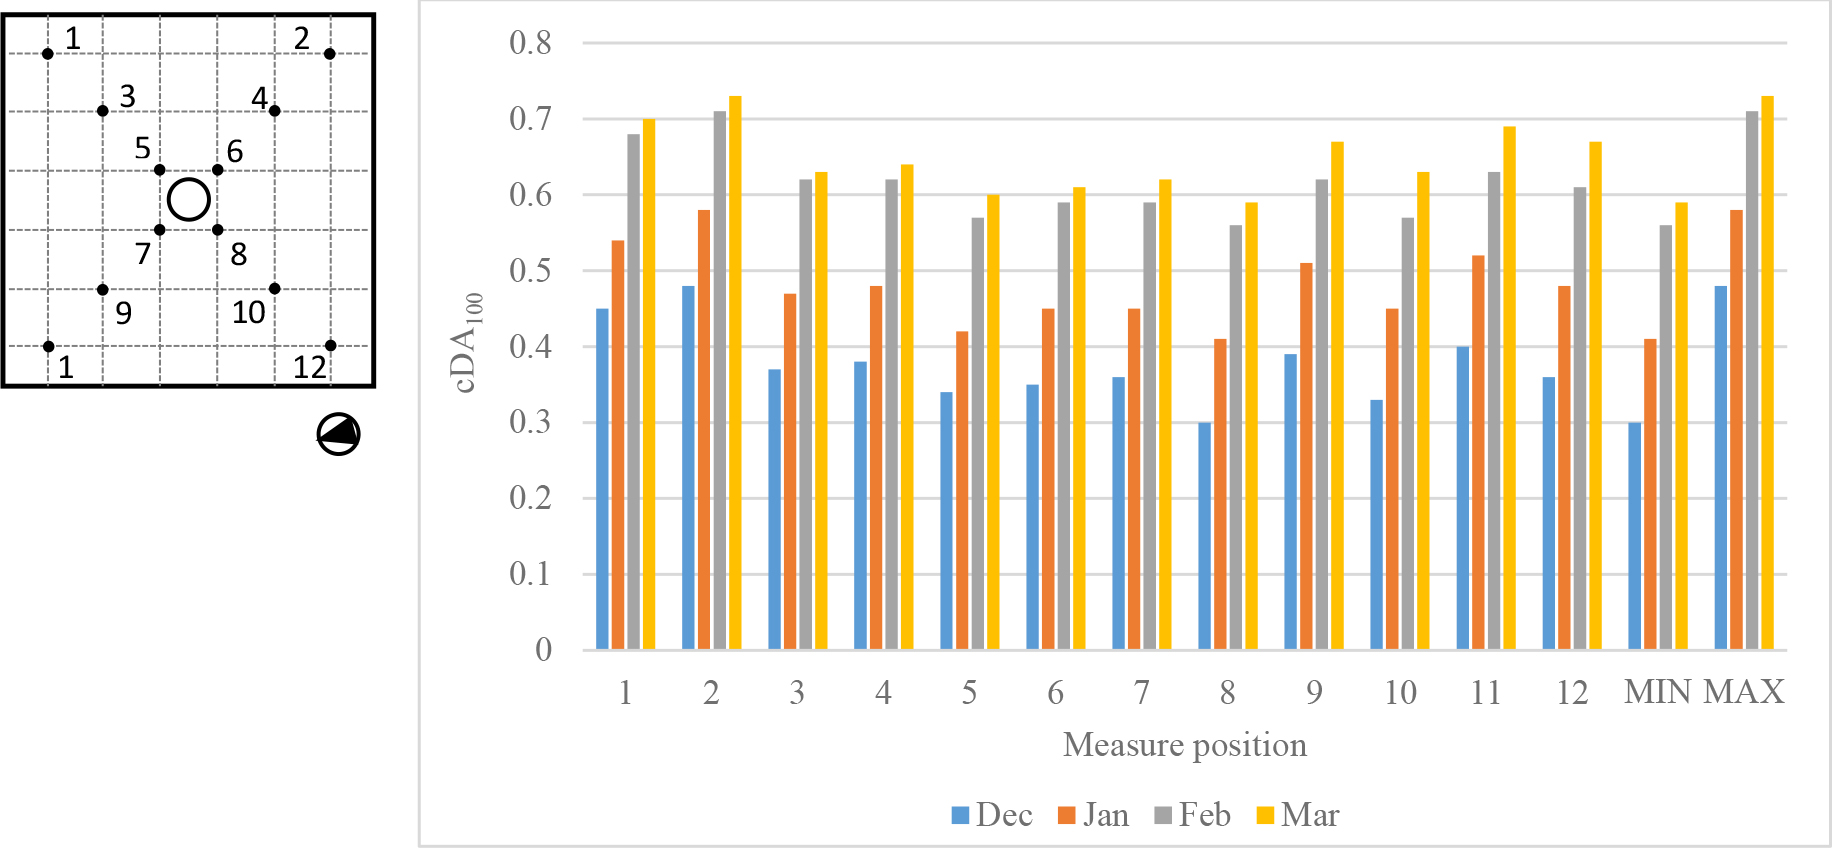
Fig. 11. cDA100 from December 2021 to February 2022.
Figure 12
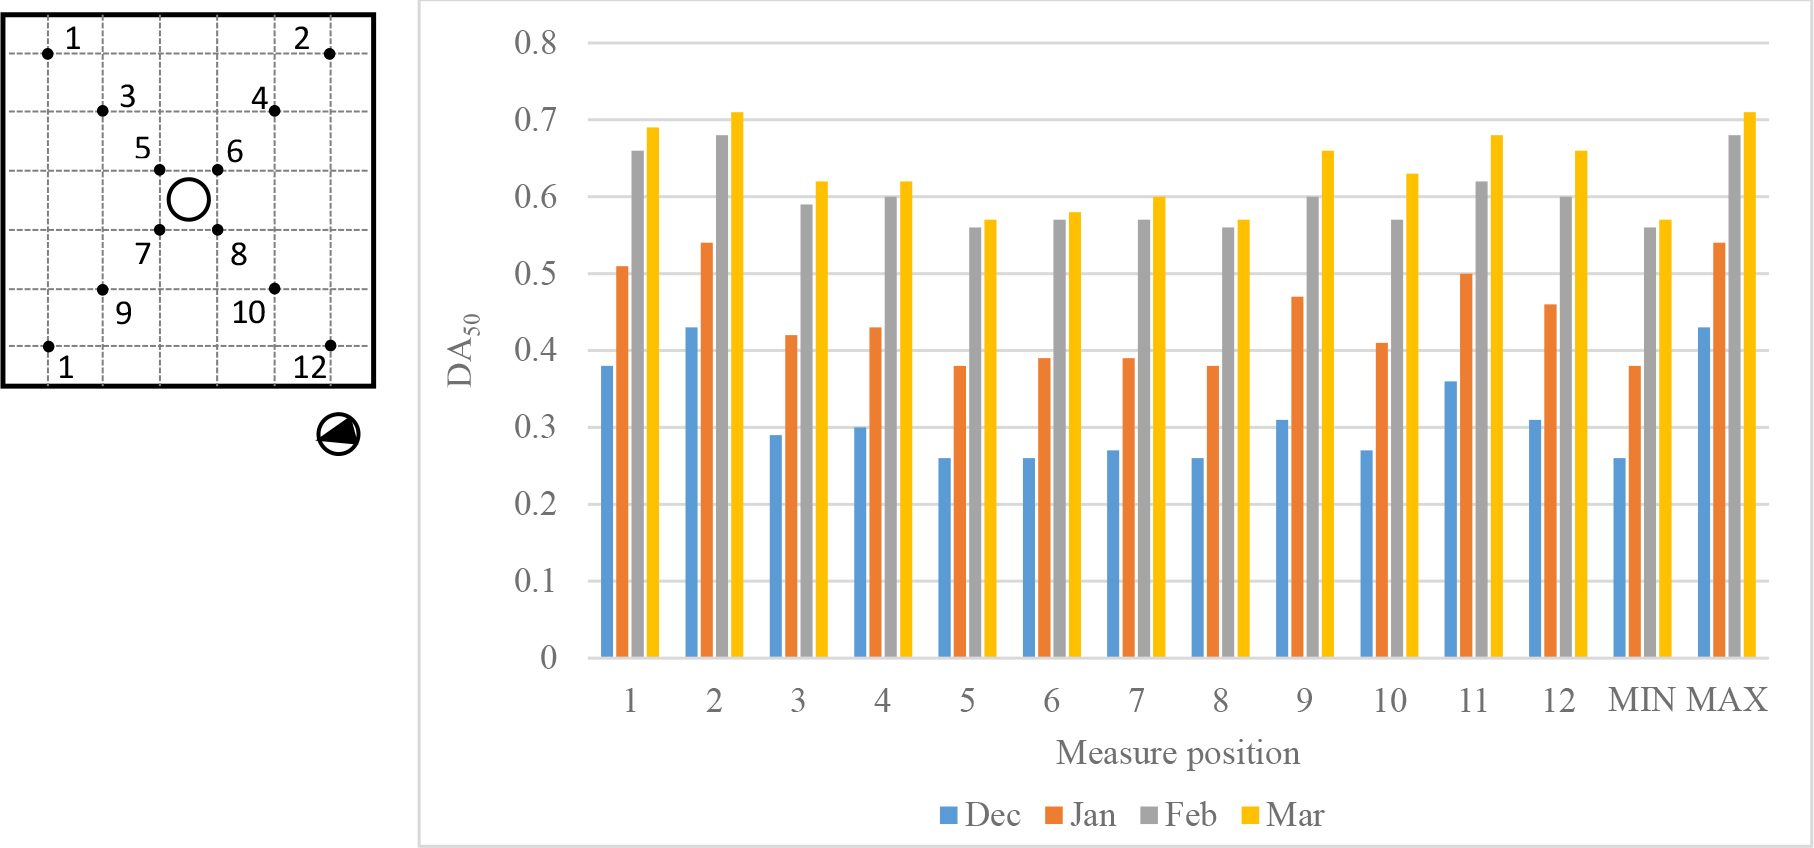
Fig. 12. DA50 from December 2021 to February 2022.
Figure 13
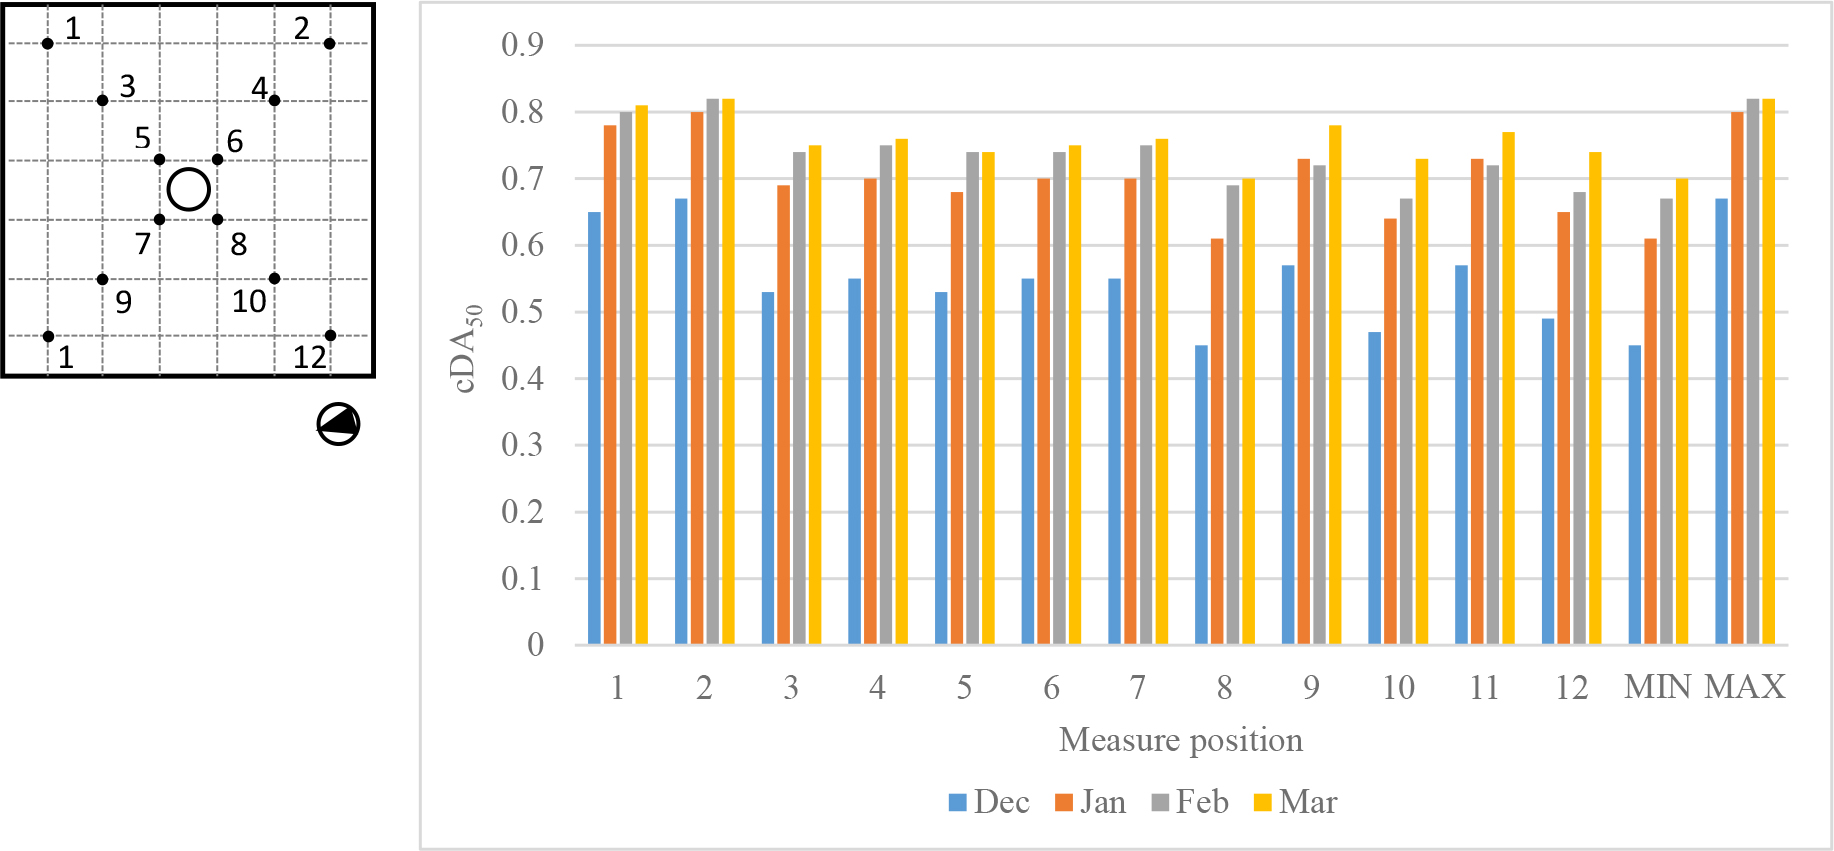
Fig. 13. cDA50 from December 2021 to February 2022.
Table 2 and Fig. 10 show an increasing trend of DA100 from December to March. Minimum values range from 0.02 (December) to 0.32 (March) while maximum values range from 0.22 to 0.55 in the same period. Maximum values take always place in position 2, while minimum values in position 5 close to the system. cDA100 is also constantly increasing from December to March as shown in Table 2 and Fig. 11: minimum values range from 0.30 (December) to 0.59 (March), while maximum values range from 0.48 to 0.73 in the same period. In this case, maximum values are always registered in position 2, while minimum values take place in position 8.
Table 3 and Figs. 12 and 13 show a similar trend of DA50, which is constantly increasing from December to March, with minimum values ranging from 0.26 (December) to 0.57 (March) and maximum values from 0.43 to 0.71. In this case, maximum values take always place in position 2, while minimum values in position 5 close to the system. Regarding cDA100, Table 3 and Fig. 13 show that it is increasing from December to March with minimum values ranging from 0.45 (December) to 0.70 (March), while maximum values range from 0.67 to 0.82 in the same period. In this case, maximum values always occur in position 2, while minimum values take place in position 8, apart from February, in which the minimum value is registered in position 10.
Figures 14-17 and Table 4 show the trend of U0 respectively in December, January, February, and March. This is an important metric because it allows you to determine the degree of uniformity of the light distribution on the work plane. Some authors recommend U0 > 0.8 as the optimal value and U0 > 0.5 as an acceptable value, but these limits usually concern environments with artificial lighting and they are too restrictive for rooms illuminated with natural light, where lower Uo values can be considered acceptable. Based on these considerations the authors opted to use 0.4 and 0.7 as reference values.
Figure 14
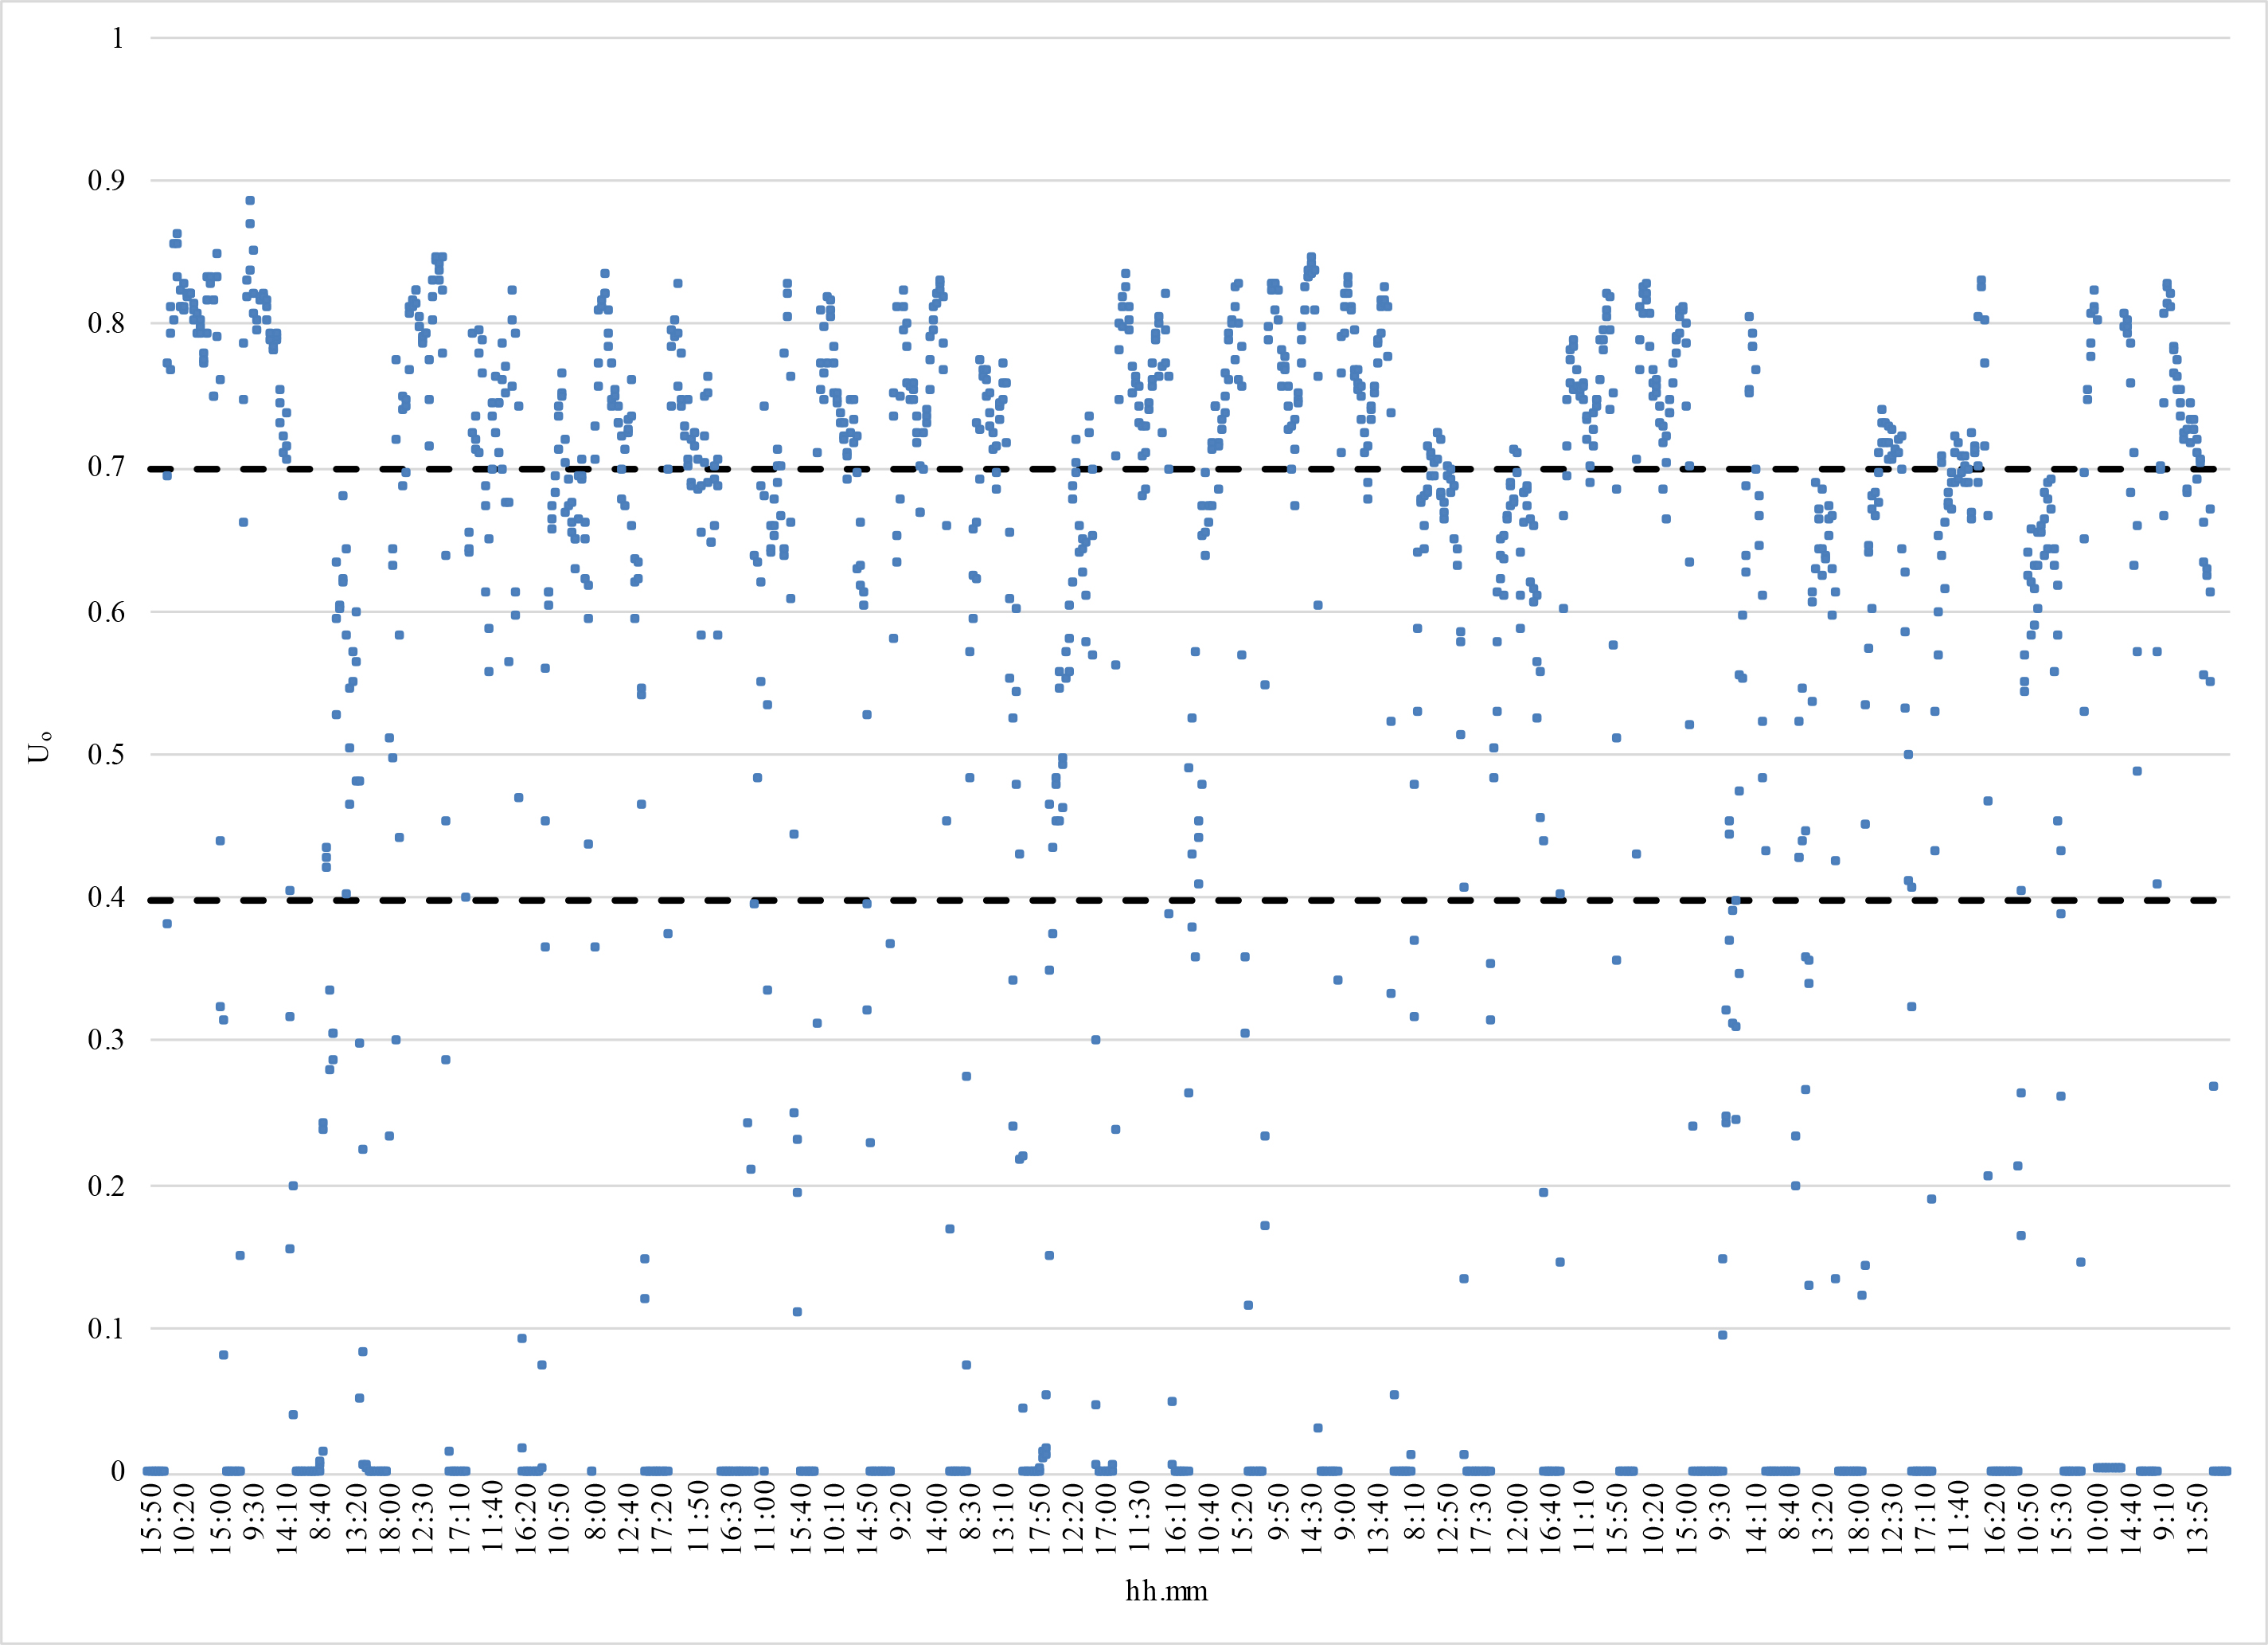
Fig. 14. Illuminance Uniformity U0 – December 2021.
Figure 15
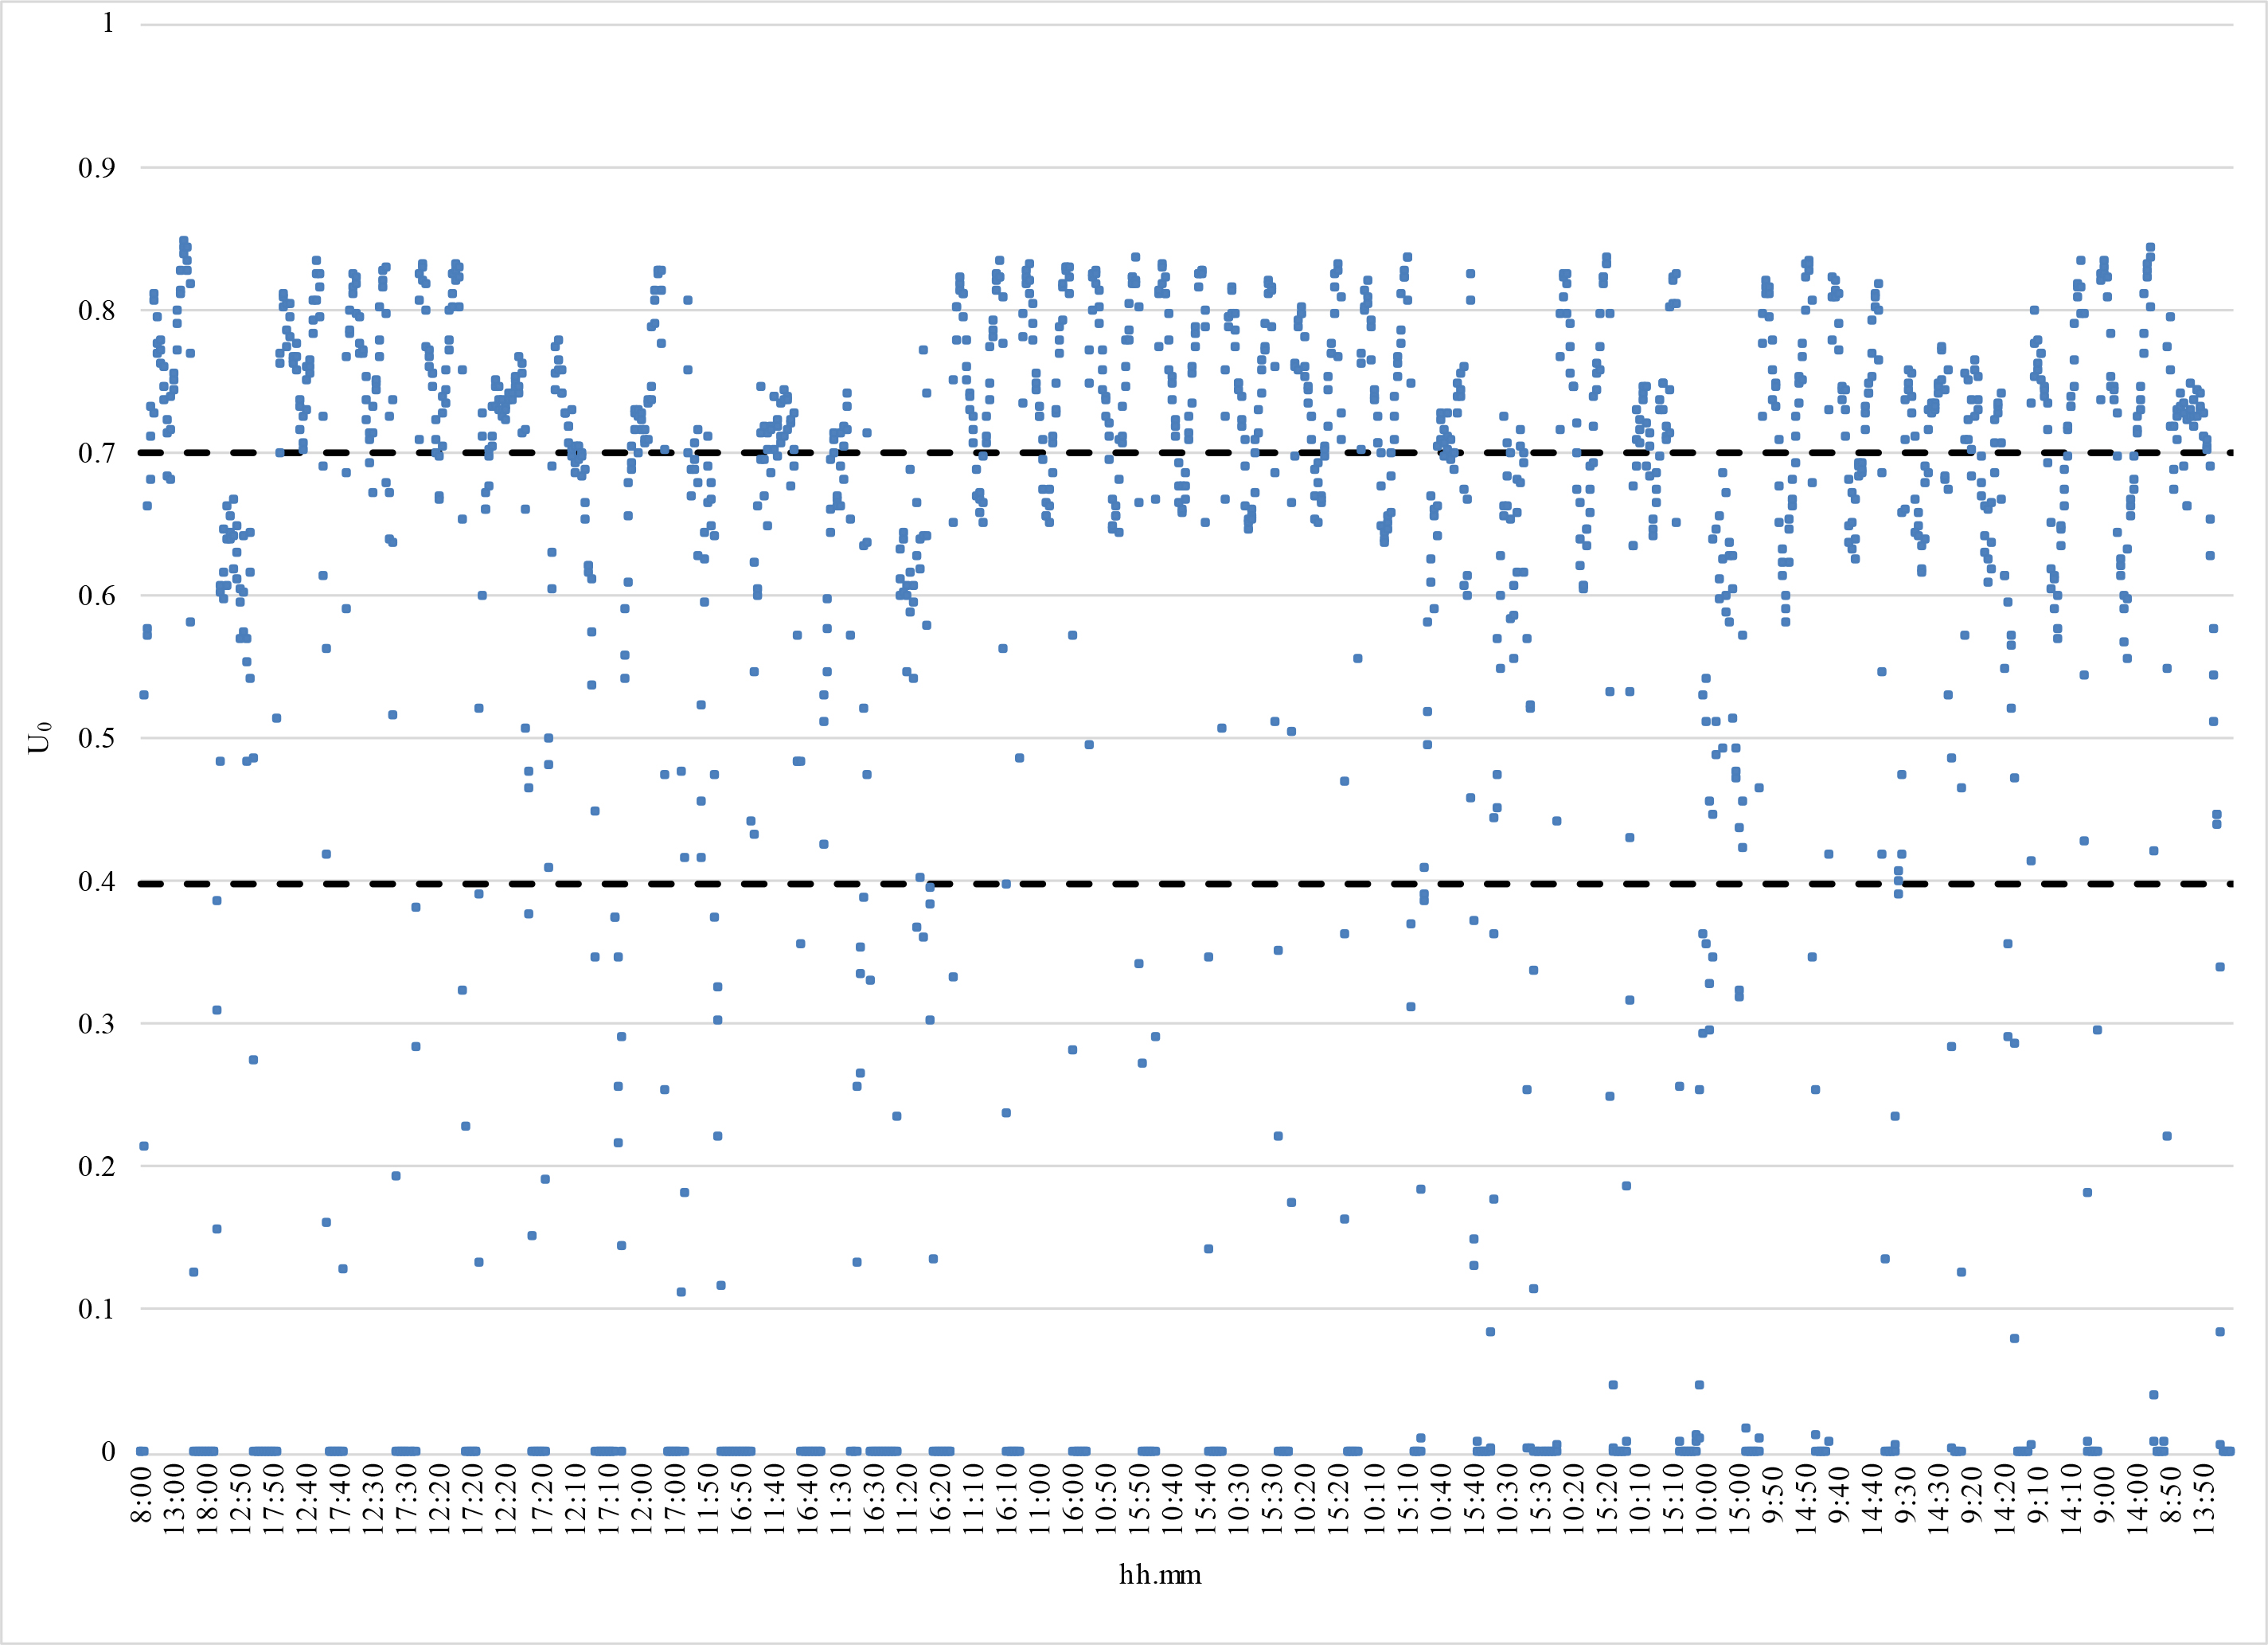
Fig. 15. Illuminance Uniformity U0 – January 2022.
Figure 16
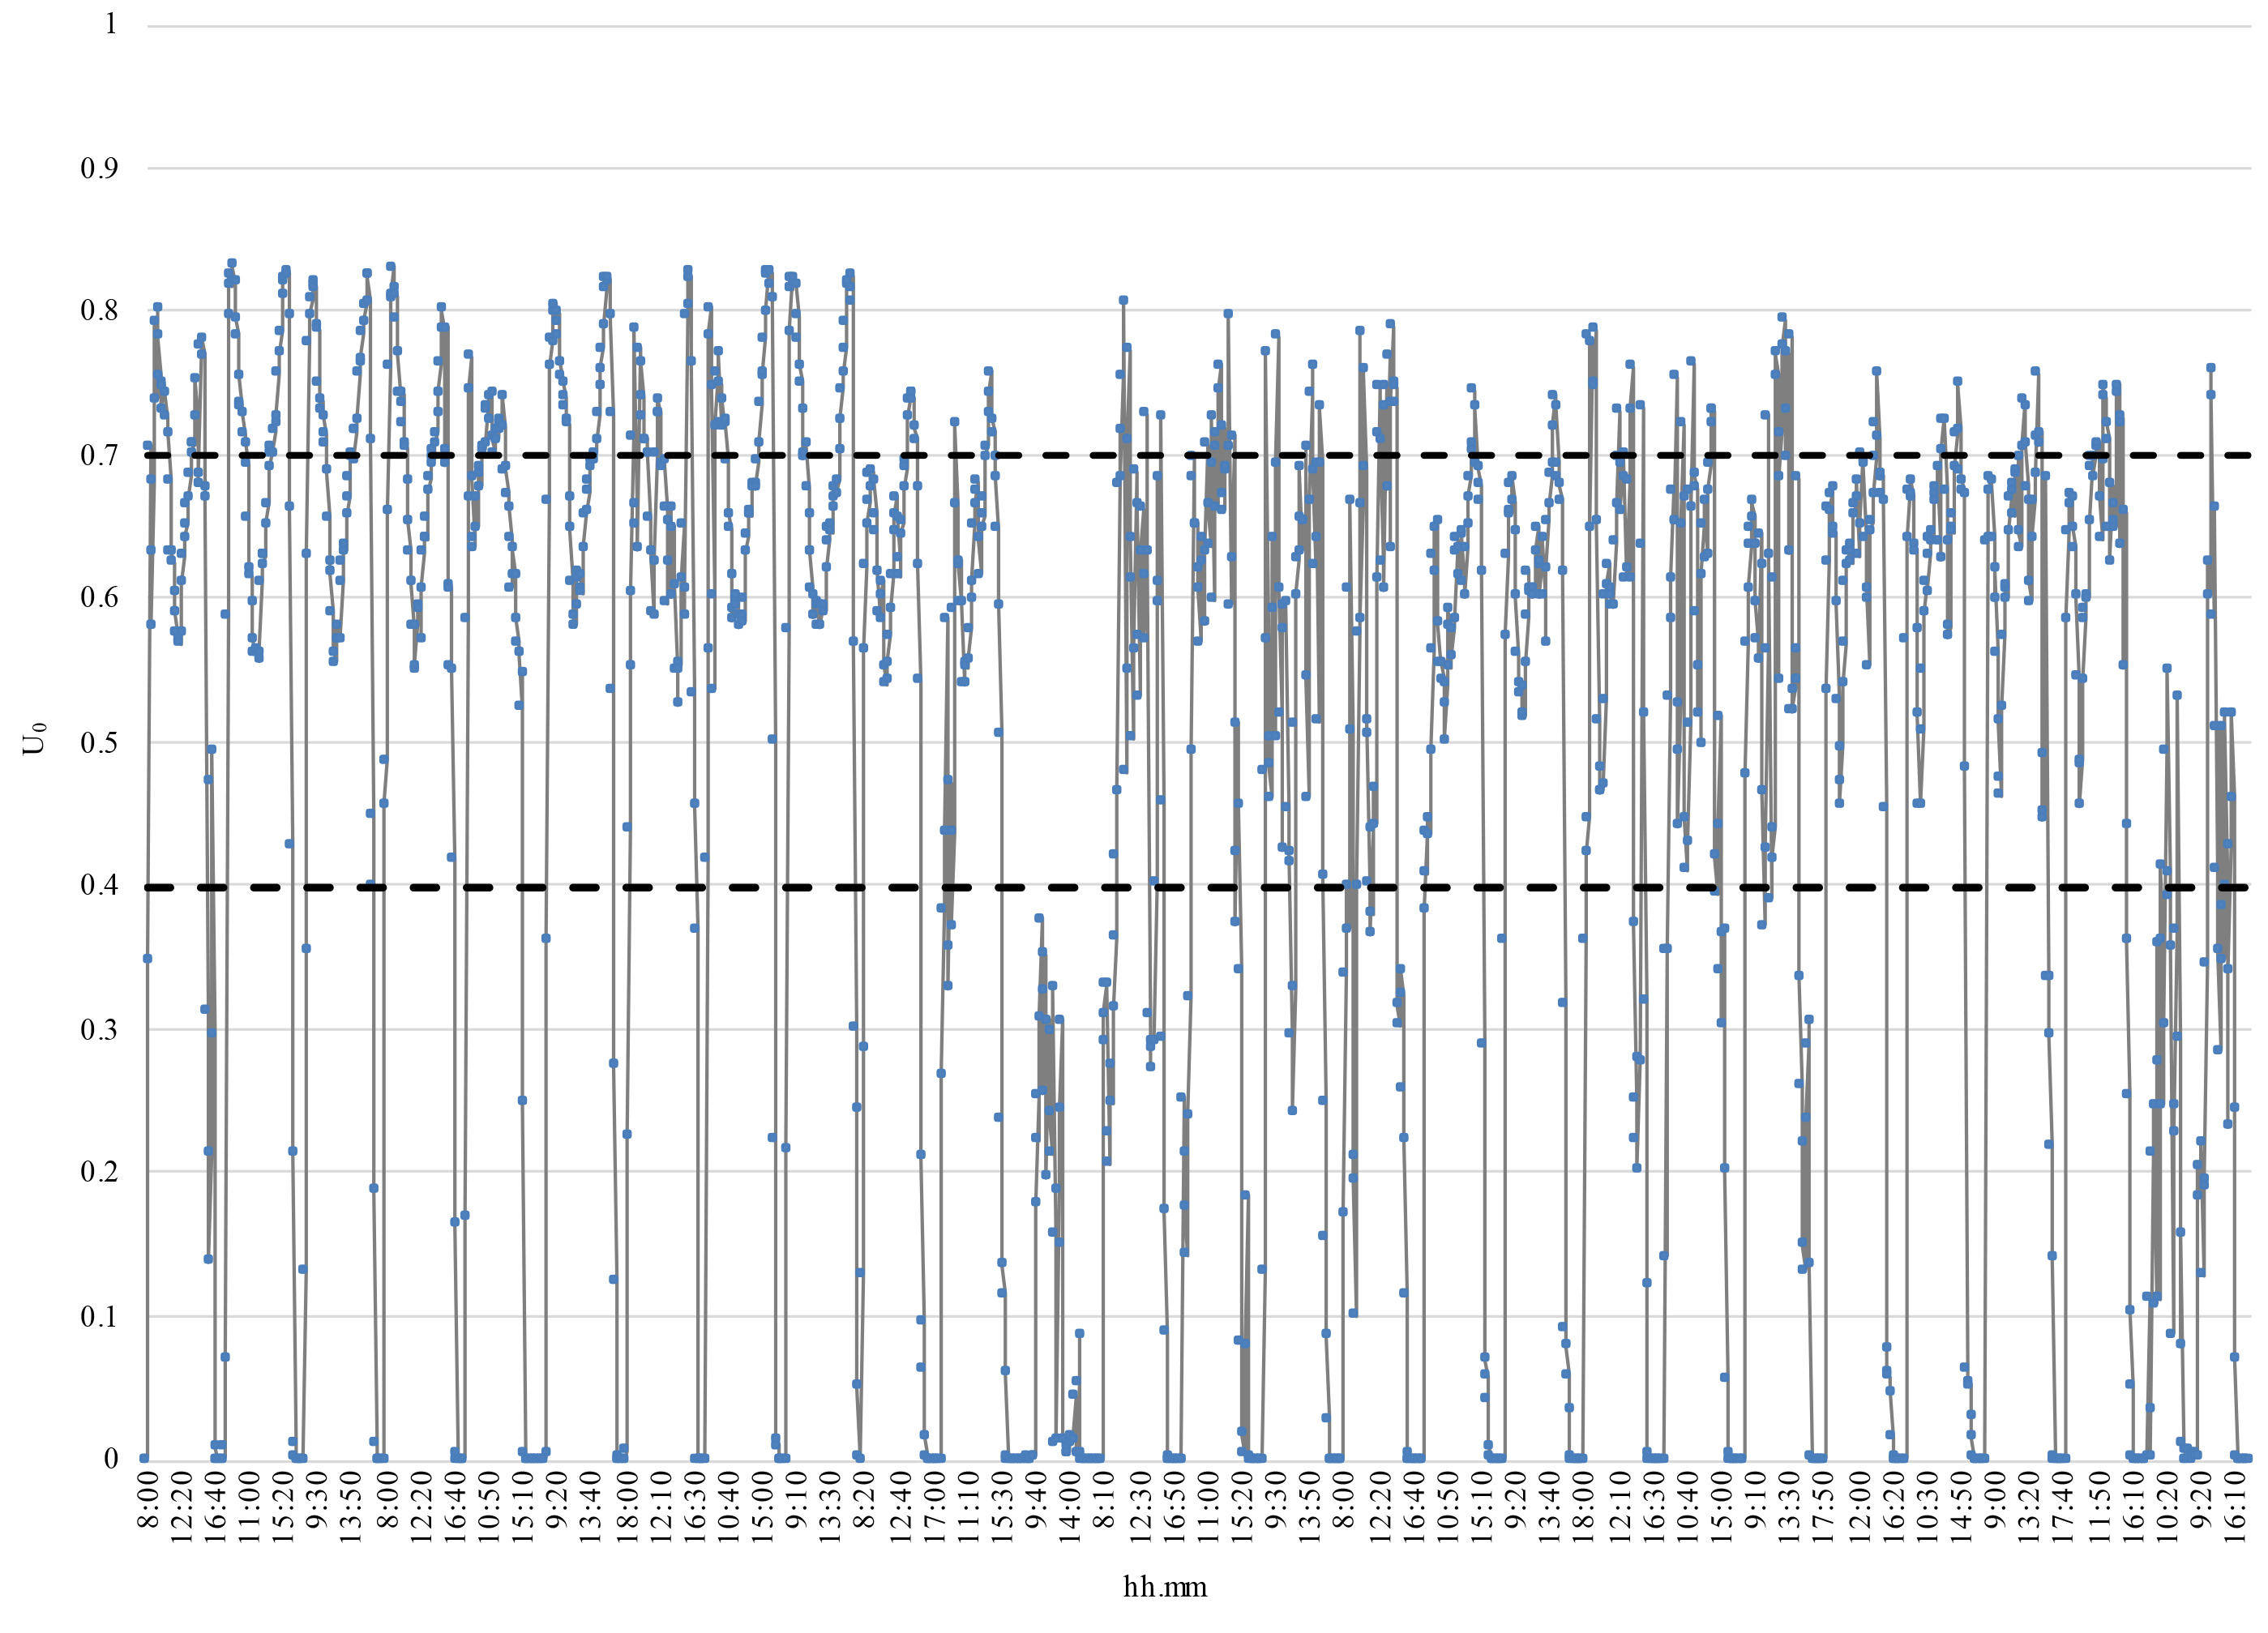
Fig. 16. Illuminance Uniformity U0 – February 2022.
Figure 17
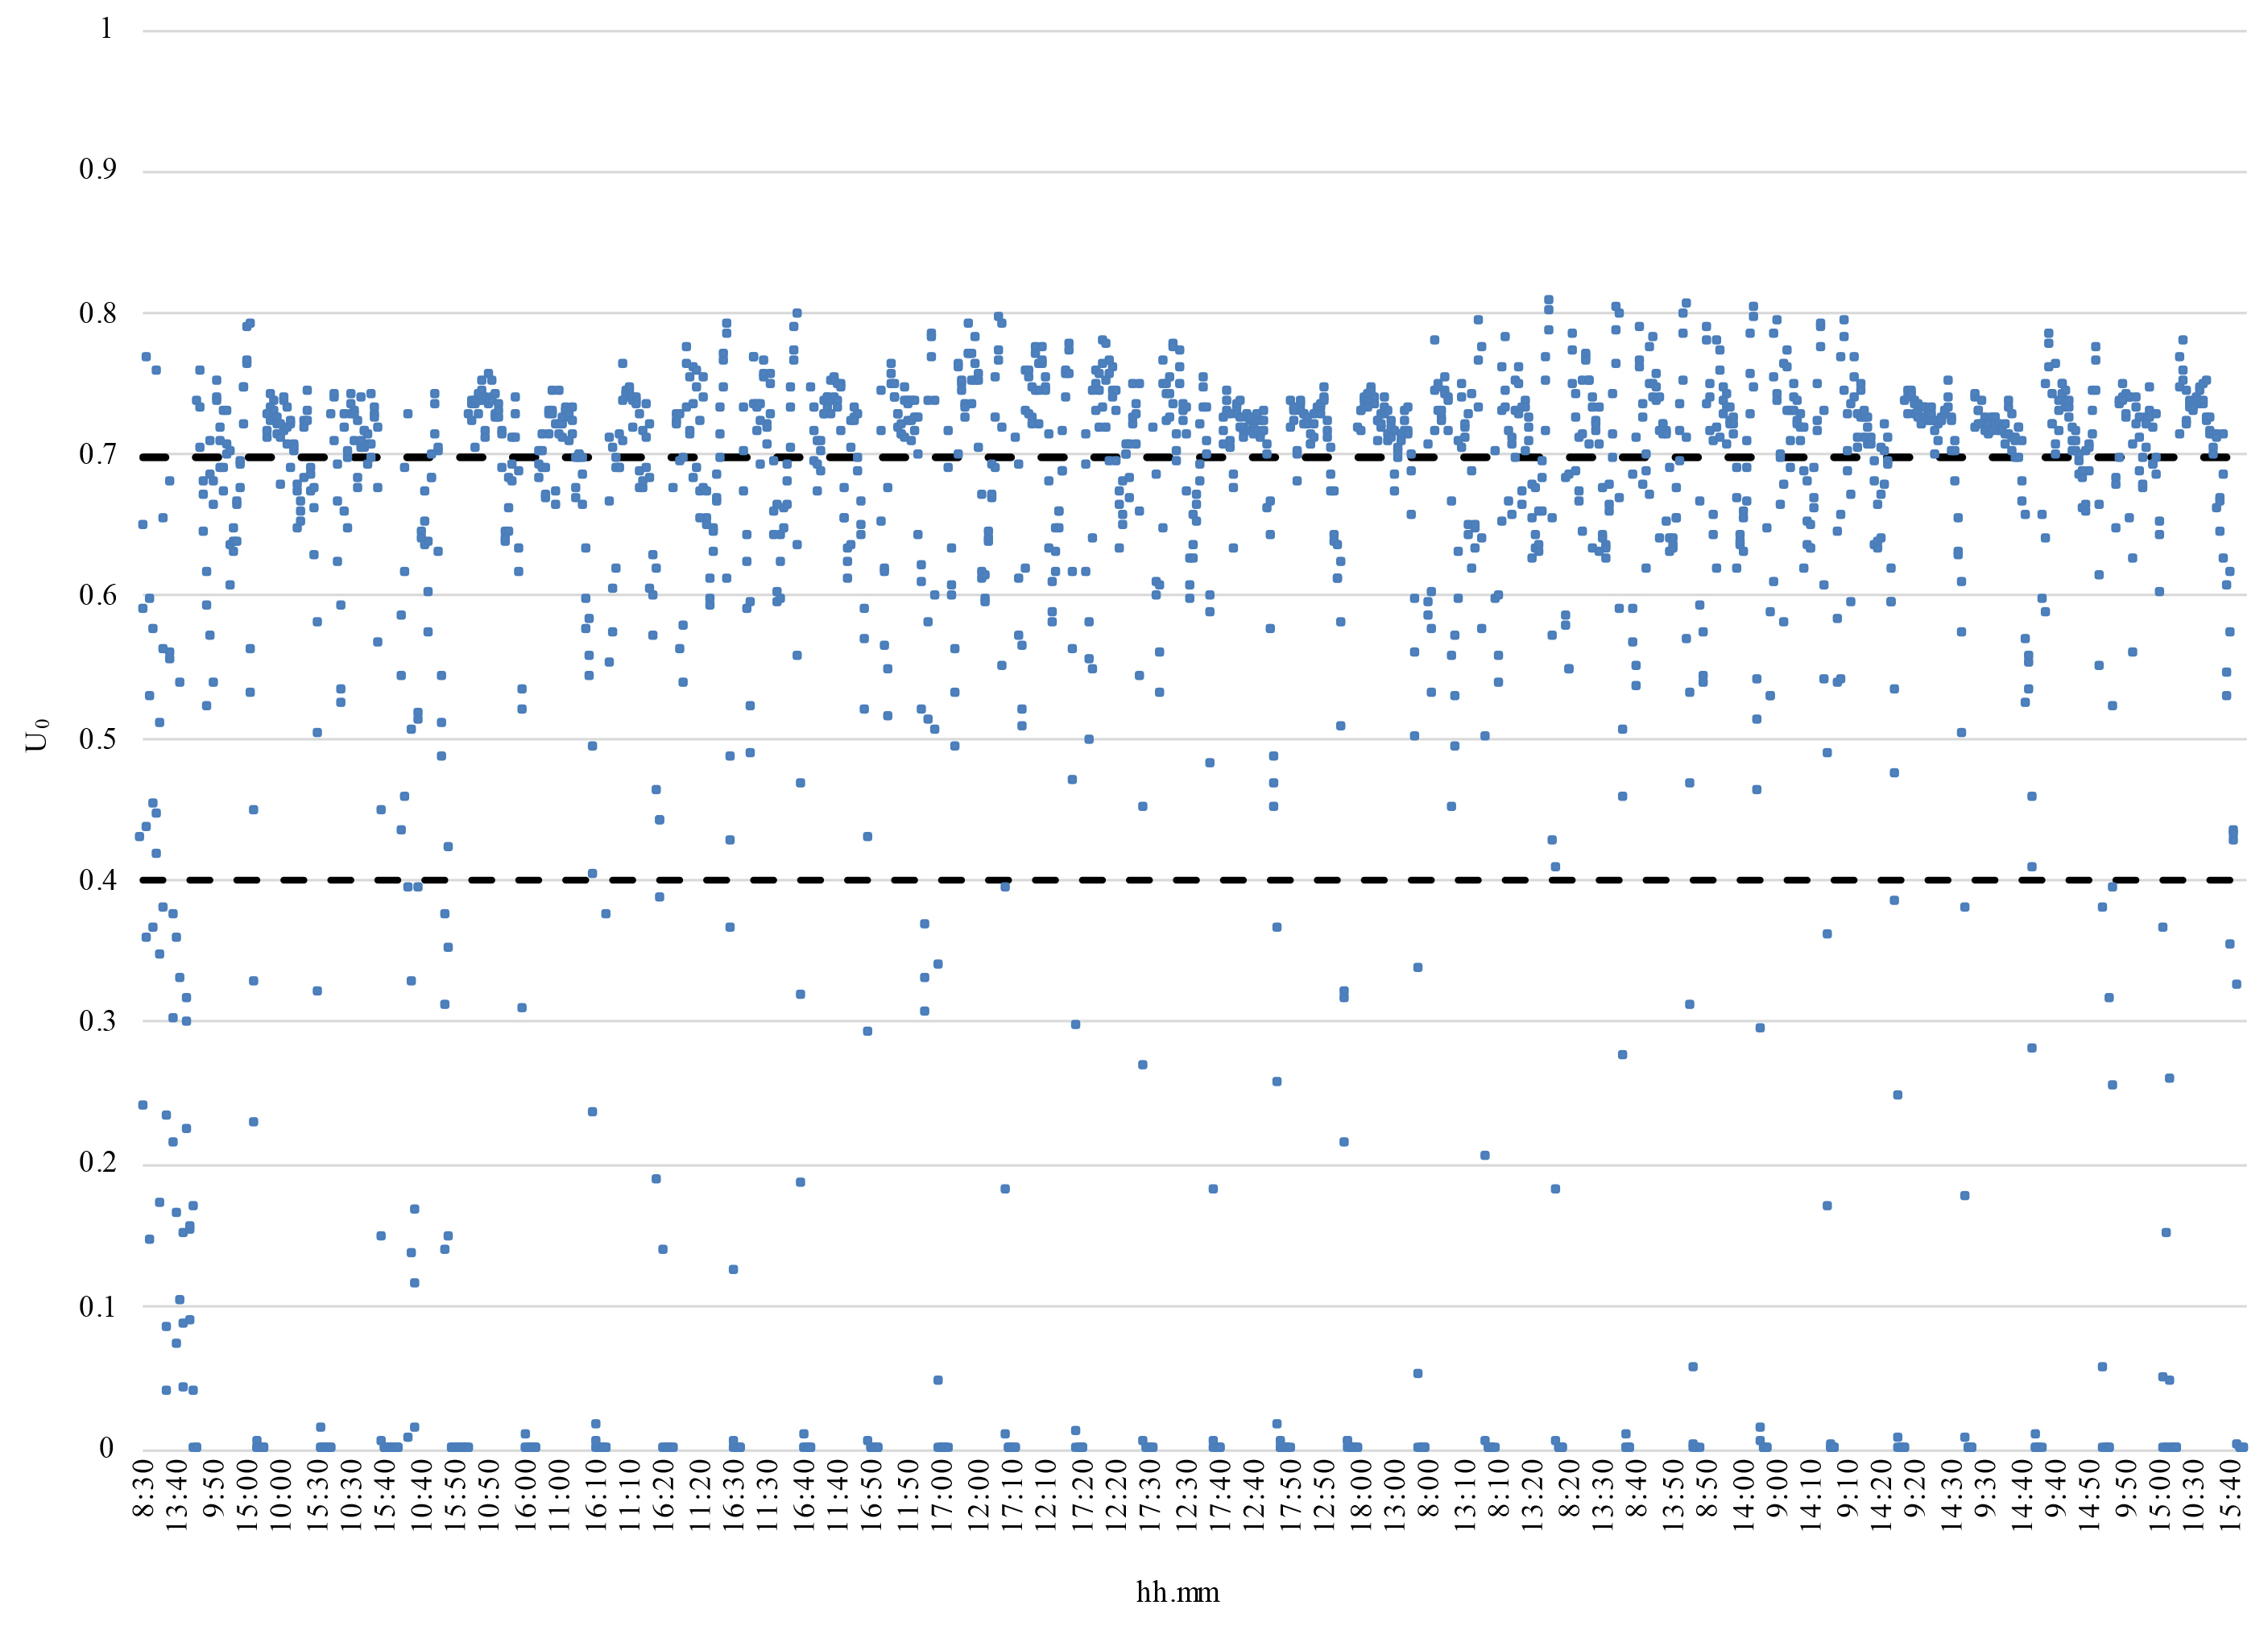
Fig. 17. Illuminance Uniformity U0 – March 2022.
Table 4
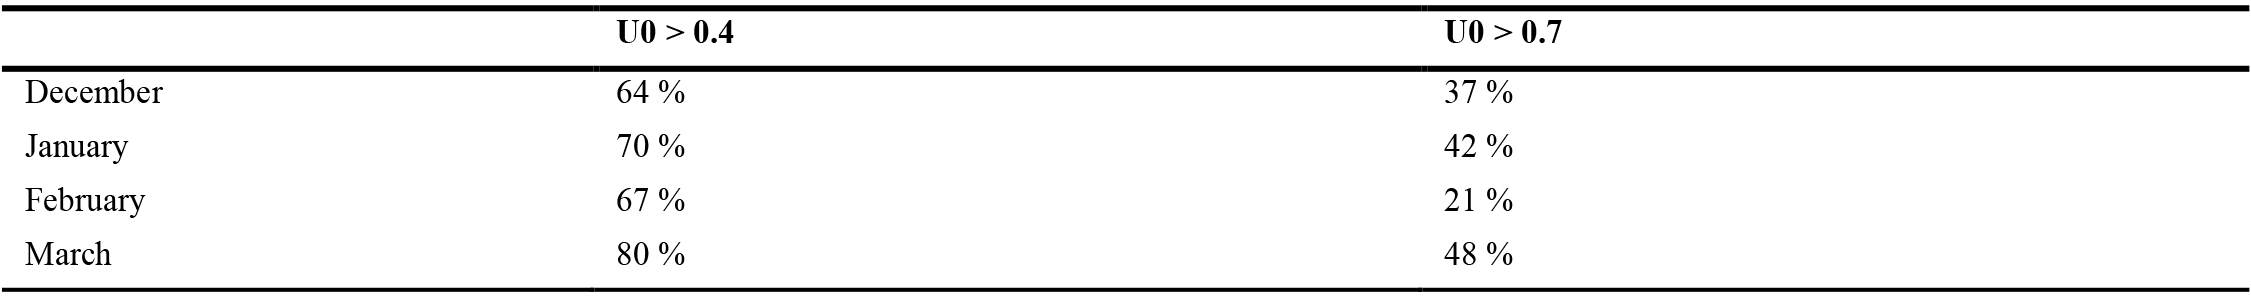
Table 4. Percentage of time in which U0 is higher than 0.4 and 0.7 respectively.
As highlighted by Figures 14 to 17 and Table 4, the Illuminance uniformity U0 is higher than 0.4 in a time ranging from 64 % (December) to 80 % (March) of the test period, while it is higher than 0.7 for a fraction of time ranging between 21 % (February) to 48 % (March). The authors consider these results acceptable for most of the applications listed in paragraph 4.
6. Discussion
The experimental analysis carried out on the reduced scale model of the MDLP between December 2021 and March 2022 permitted us to make some considerations about the characteristics of the system and its lighting performance. The modifications made to the DLP have reduced its footprint and significantly mitigated the risk of glare by preventing people from seeing the brightest top of the MDLP. Furthermore, good results have been obtained in terms of illuminance distribution, daylight autonomy, and illuminance uniformity in the passage way.
The internal illuminance in all the measure positions follows the trend of the external one, with a low time shift, and DR % values range very regularly between 0.3 and 0.7 % on sunny days, and between 0.2 and 0.6 % on cloudy days for most of the time between 8.30 and 16.00.
The MDLP allows reaching a good degree of daylight autonomy if referred to 100 lx and 50 lx, which are the required illuminance values for many applications in underground areas of buildings or plants according to the EN 12464-1.
Experimental data confirm that a good uniformity of light distribution is obtained by the system: maximum values always occur in the corners of the room (particularly in position 2) while minimum values near the system. The Illuminance Uniformity is acceptable, higher than 0.4 most of the time, and higher than 0.7 in favorable cases.
Both DA and cDA values confirm that the performance of the system increases from December to March. This allows thinking that it will be more efficient in spring and summer conditions, even if some problems could be derived from the more intense direct solar radiation that could produce peak values of illuminance in some positions, worsening the uniformity of light distribution.
The authors will pay particular attention analyzing carefully the experimental data for a whole year. They intend to perform numerical analysis to determine the optimal values of the geometric and physical features of the components of the system. This will be one of the objectives of the future developments of the ongoing research.
Furthermore, it should be specified that in this first phase of the study the authors did not investigate the topic of the type and size of the environments in which the system can be installed, but only tried to define the lighting characteristics in a standard configuration of the test-room (square plane with known physical and geometric characteristics). This too will be a subject of further investigations.
7. Conclusions
In this paper, the authors describe the results of an experimental activity carried out on a 1:2 scale model of the MDLP, an innovative daylighting system designed by modifying the DLP.
The experimental activity has been carried out from December 2021 to March 2022 on a 1:2 scale model of the device installed in a square room that simulates the intermediate room of a two levels underground building.
The authors calculated the Daylight Ratio, Daylight Autonomy, continuous Daylight Autonomy, and Illuminance Uniformity to analyze the performance of the system.
The internal illuminance in all the measure positions follows the trend of the external one with both clear and overcast sky, and the DR (%) has a regular trend ranging between 0.3 and 0.7 % on sunny days, and between 0.2 and 0.6 on cloudy days.
The metrics DA and cDA have been calculated for 100 and 50 lx, which are the required illuminances in many applications of underground buildings, according to the rule EN 12464-1.
The Illuminance uniformity is higher than 0.4 most of the test period and higher than 0.7 in favorable conditions.
The experimental activity is still ongoing and the authors intend to collect sufficient data to calculate the main dynamic metrics for a whole year. Furthermore, they aim to carry out a numerical analysis of the performance of the MDLP through suitable simulation soft-wares.
Appendix A
Table A1
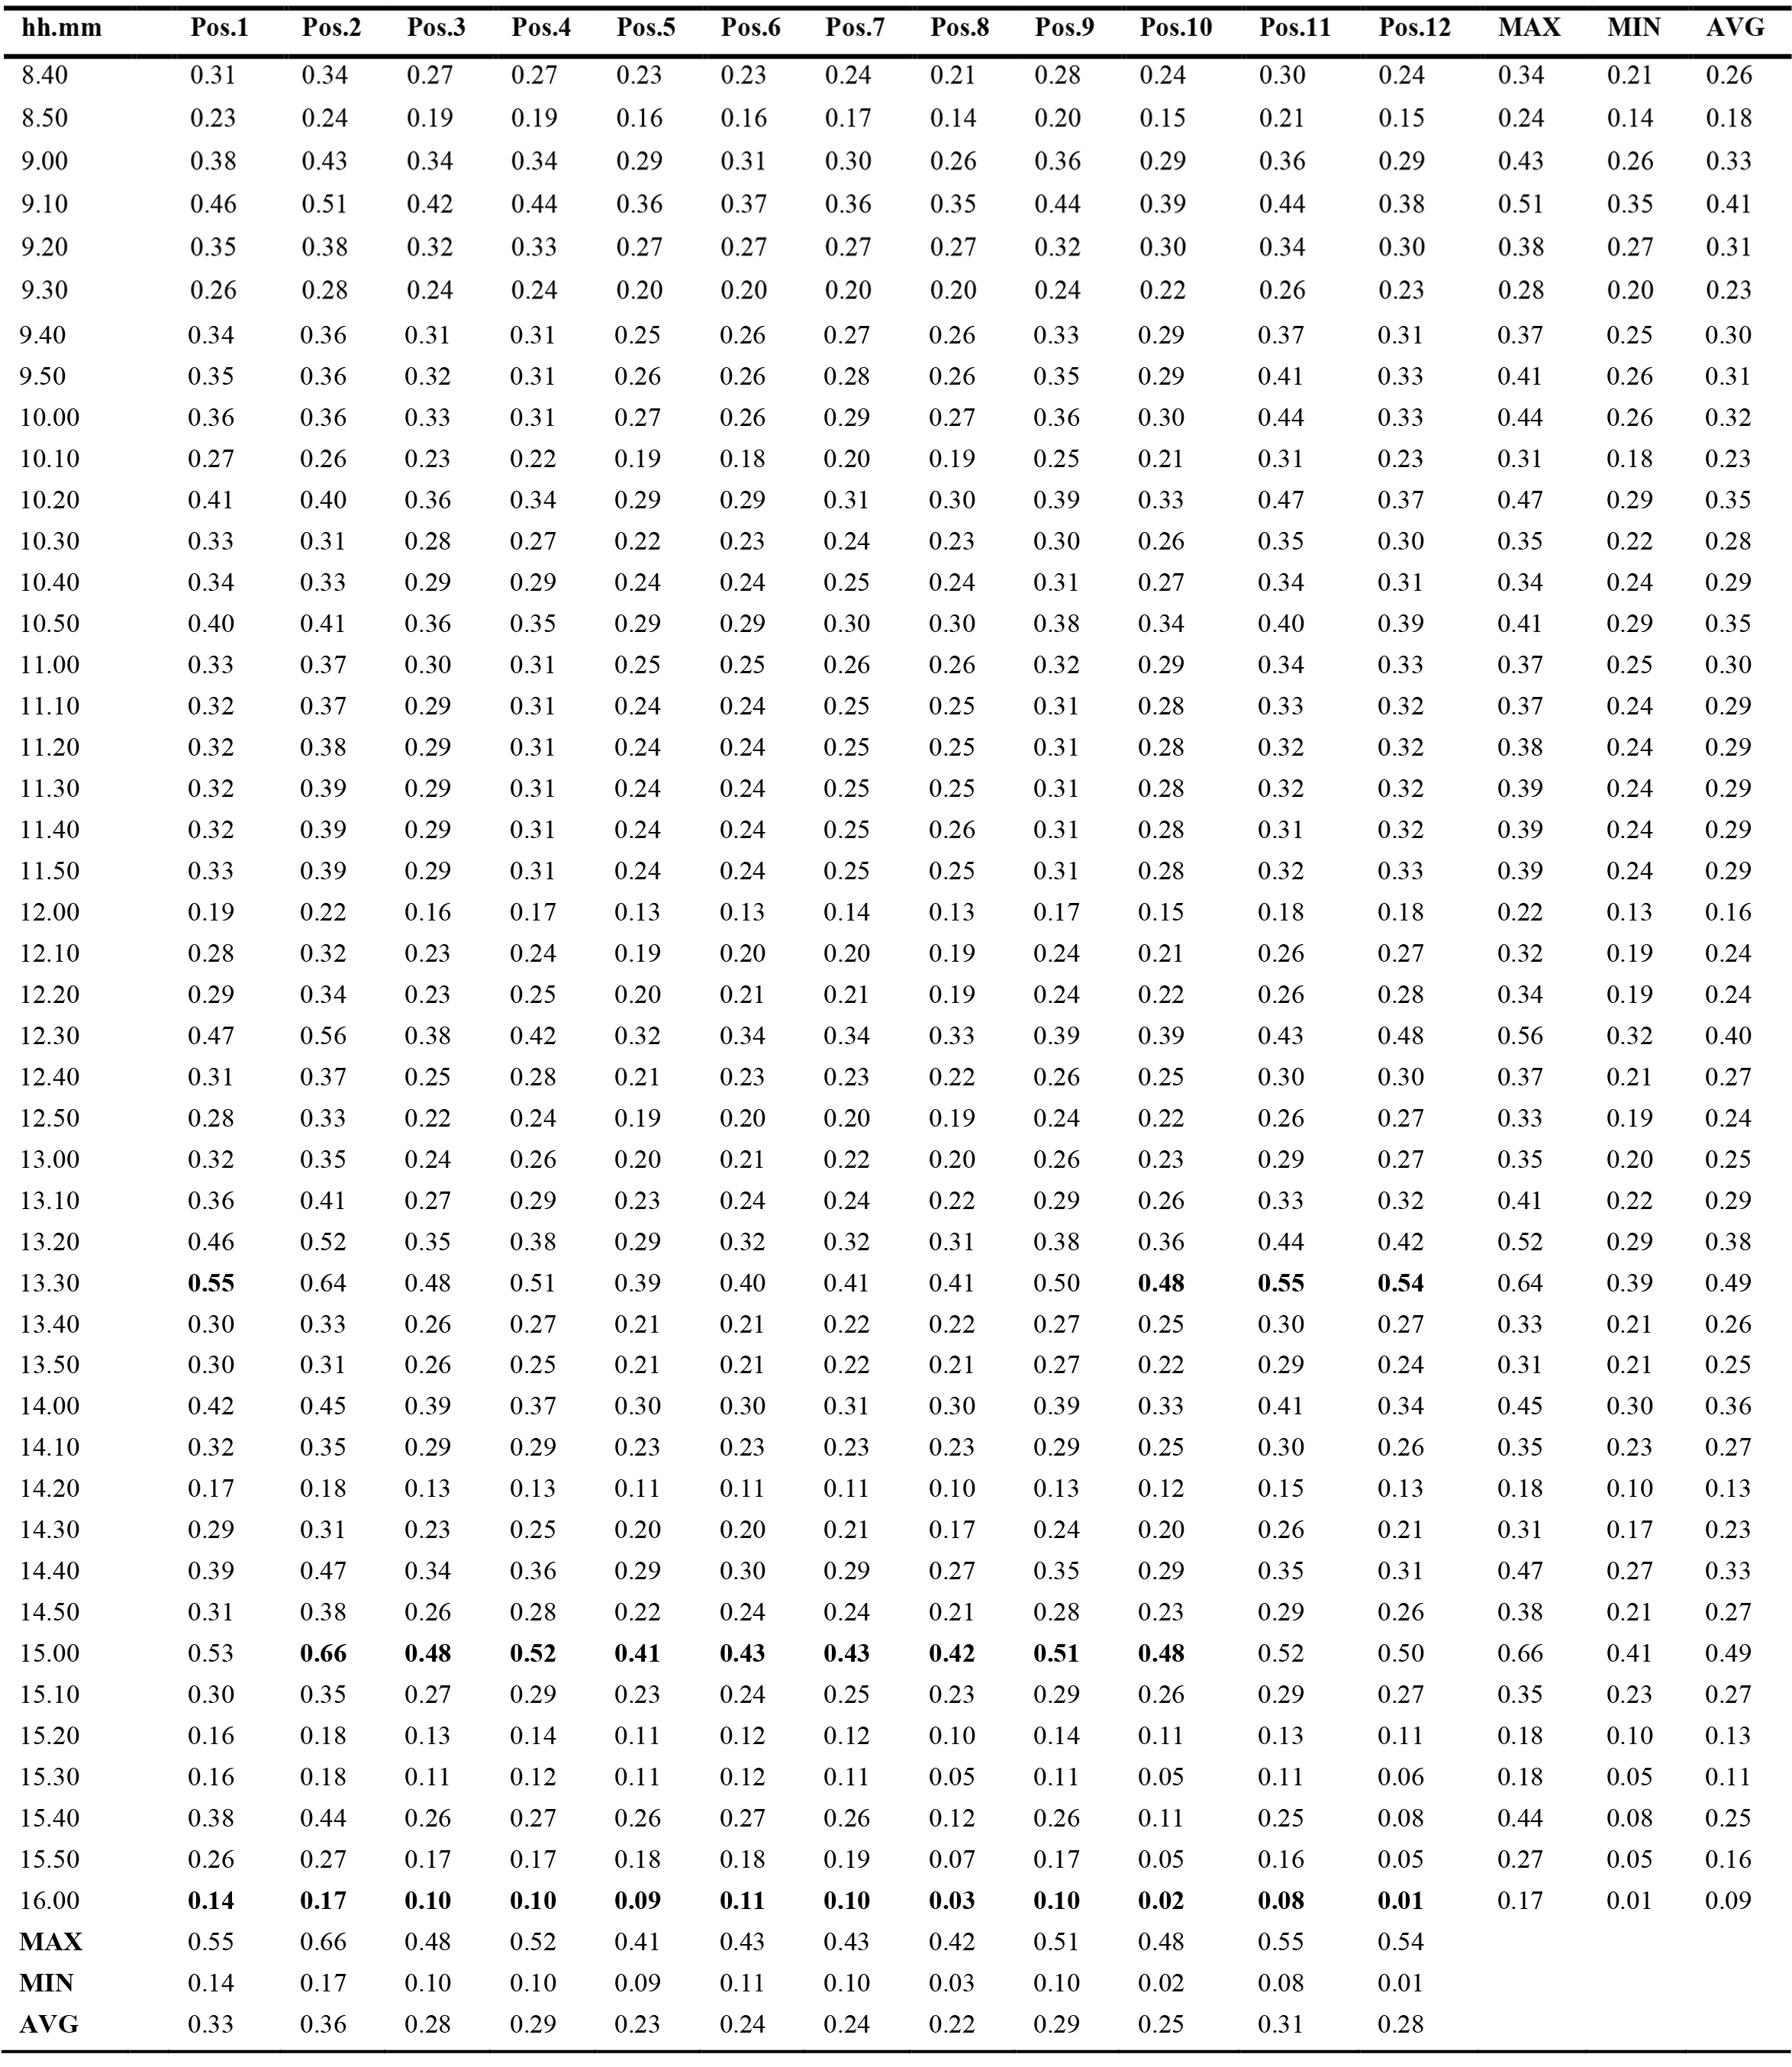
Table A1. DR (%) in all the measure positions on December the 4th.
Table A2
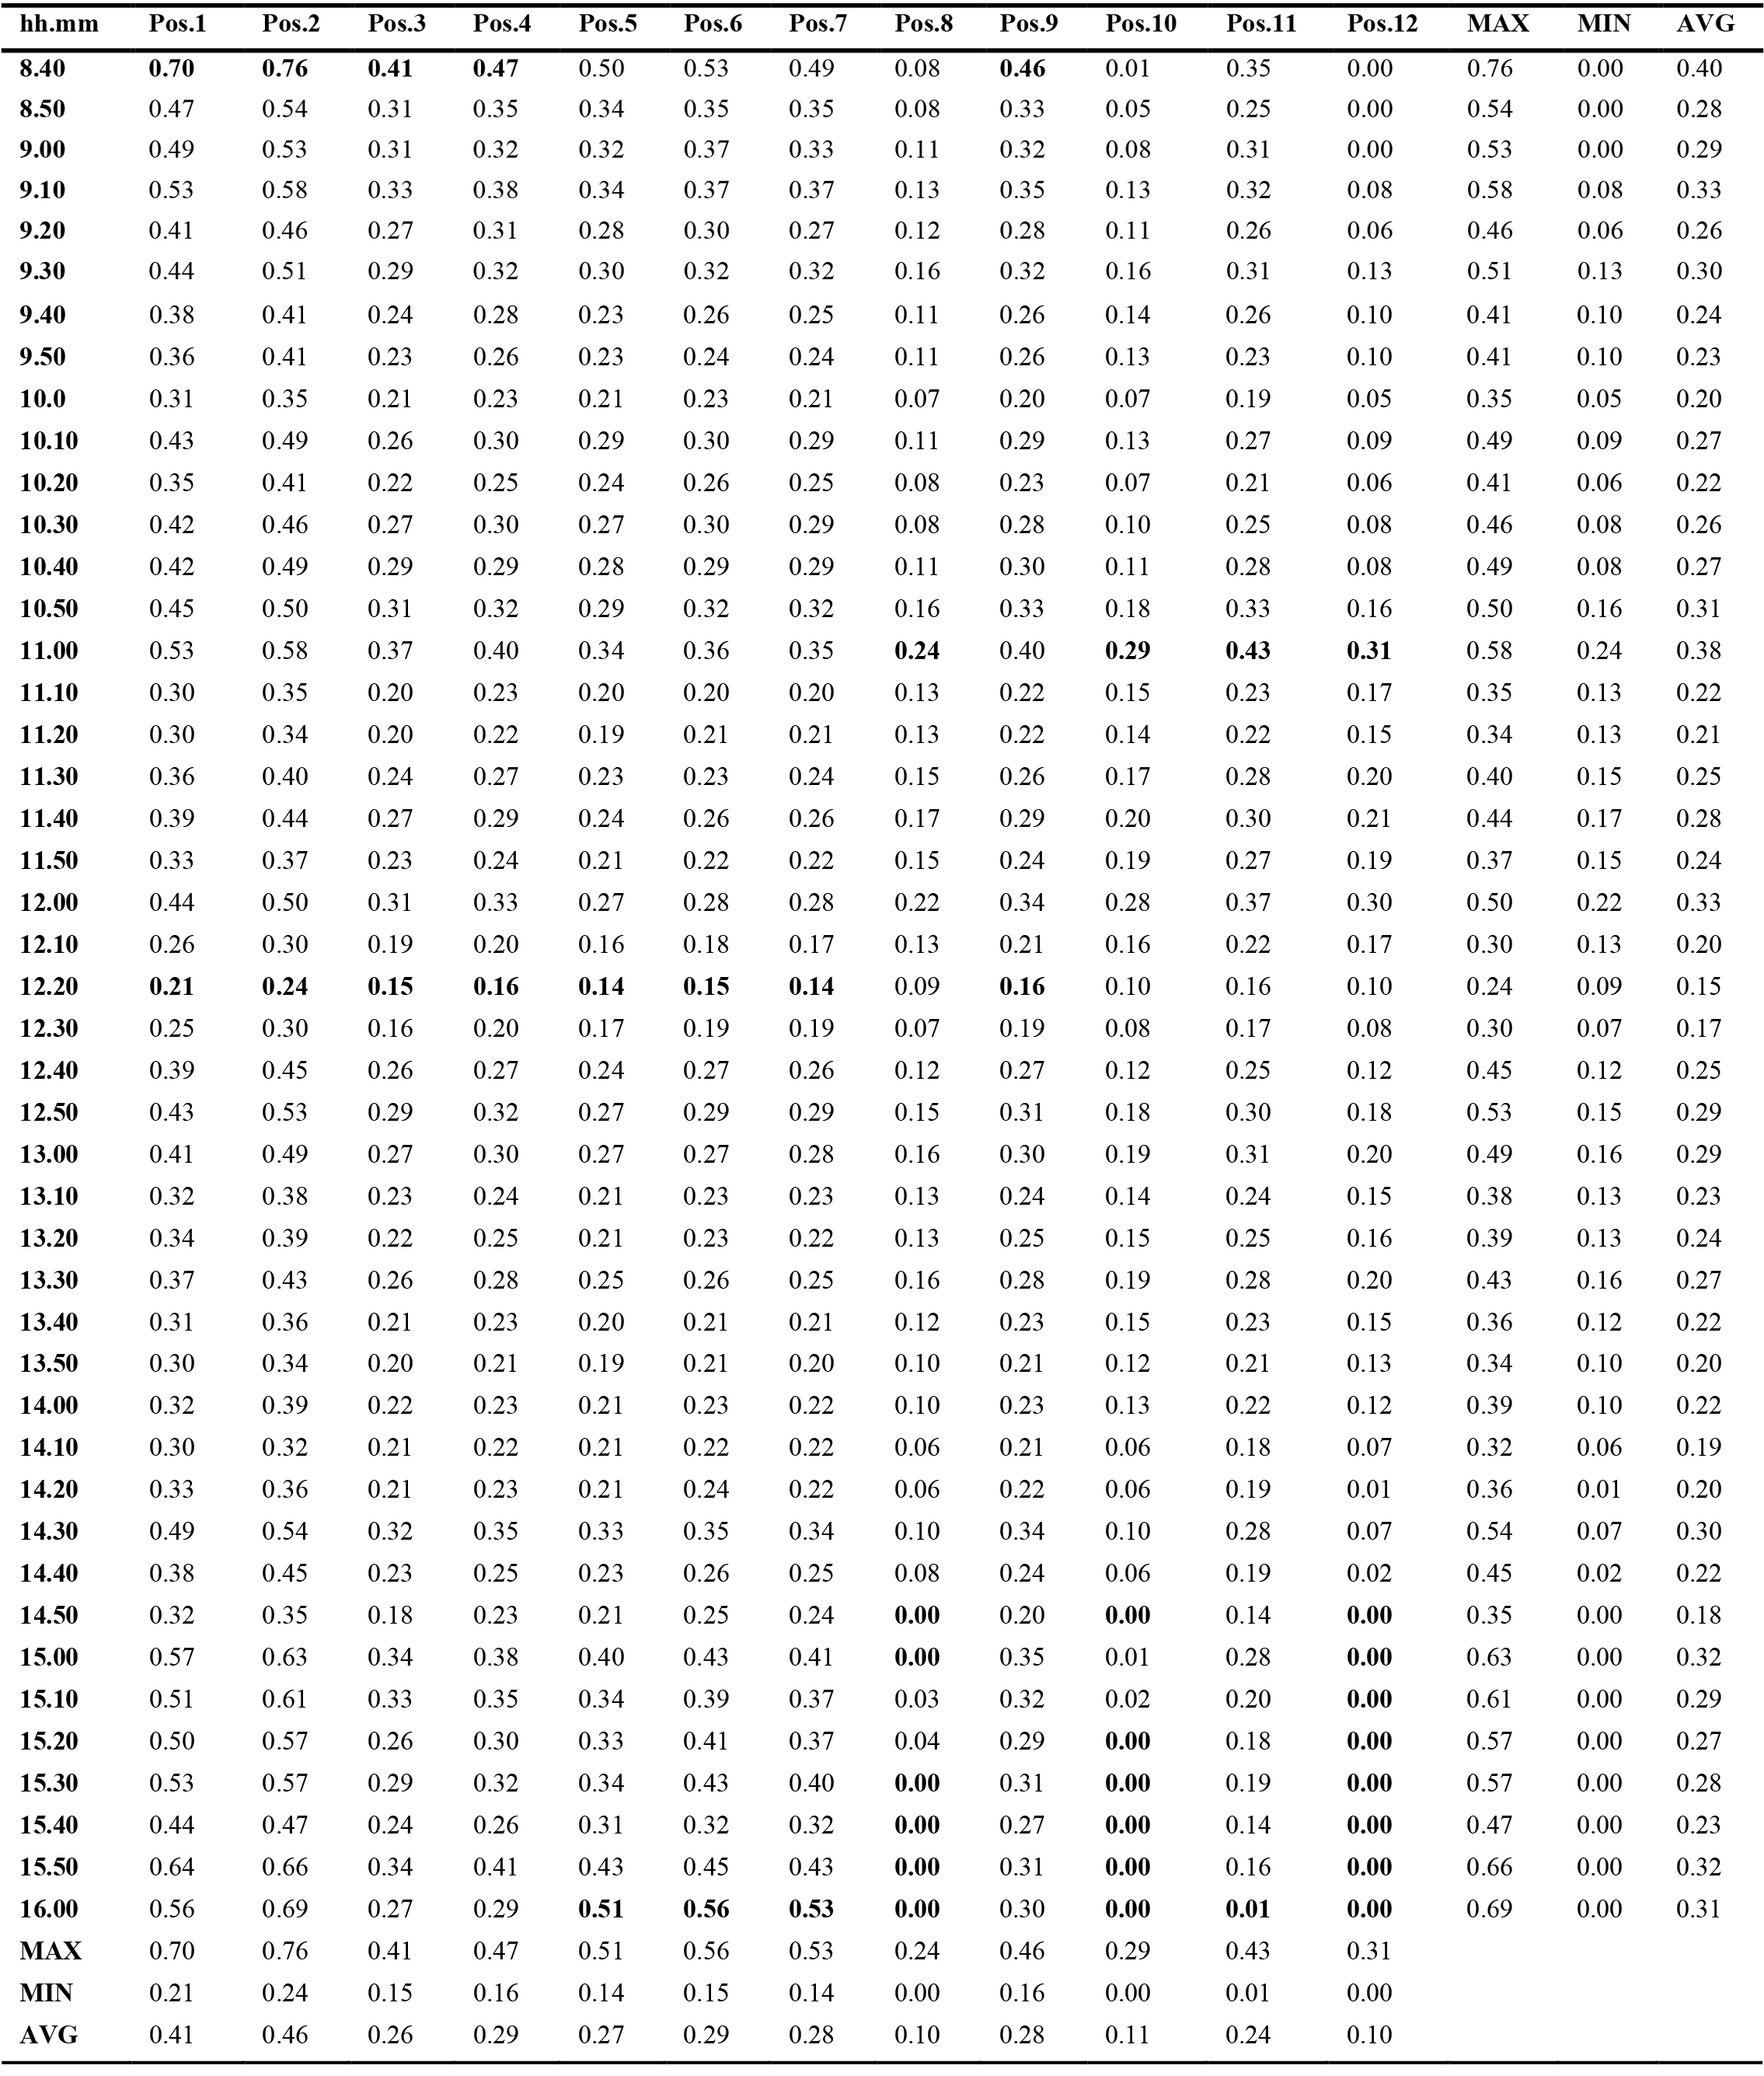
Table A2. DR (%) in all the measure positions on December the 6th.
Contributions
All the authors contributed equally.
Declaration of competing interest
The authors declare no conflict of interest.
References
- P. Zazzini. A. Di Crescenzo. R. Giammichele. Daylight Performance of the Modified Double Light Pipe (MDLP) Through Experimental Analysis on a Reduced Scale Model. Journal of Daylighting 9 (2022) 164-176. https://doi.org/10.15627/jd.2022.13
- C. Blume. C. Garbazza. Spitschan. Effects of light on human circadian rhythms. sleep and mood. Somnologie (Berl) 233 (2019) 147-156. https://doi.org/10.1007/s11818-019-00215-x
- L. Tähkämö. T.Partonen. A.K. Pesonen. Systematic review of light exposure impact on human circadian rhythm. Chronobiology International. 36 2 (2019) 151-170. https://doi.org/10.1080/07420528.2018.1527773
- Z. Hamedani. E. Solgi. H. Skates. T. Hine. R. Fernando. J. Lyons. K. Dupre. Visual discomfort and glare assessment in office environments: a review of light-induced physiological and perceptual responses. Building and Environment 153 (2019) 267-280. https://doi.org/10.1016/j.buildenv.2019.02.035
- M.Bodart. A. De Herde. G. Lobal. Energy savings in office buildings by the use of daylighting. Energy and Buildings 34 (2002) 421-429. https://doi.org/10.1016/S0378-7788(01)00117-7
- J. Mardaljevic. M. Heschong. E. Lee. Daylight metrics and energy savings. Lighting Research and Technology 41 (2009) 261-283. https://doi.org/10.1177/1477153509339703
- A. M. Momani. B.Yatim. M. Alauddin. M. Ali. The impact of the daylight saving time on electricity consumption: a case study from Jordan. Energy Policy 37 (2009) 2042-2051. https://doi.org/10.1016/j.enpol.2009.02.009
- I. Pyonchan. N. Abderrezek. K. Moncef. Estimation of lighting energy savings from daylighting. Building and Environment 44 (2009) 509-514. https://doi.org/10.1016/j.buildenv.2008.04.016
- O. T. Masoso. L. J. Grobler. The dark side of occupants' behaviour on building energy use. Energy and Buildings 42 (2010) 173-177. https://doi.org/10.1016/j.enbuild.2009.08.009
- L. Bellia. F. Fragliasso. A. Pedace. Evaluation of daylight availability for energy savings. Journal of Daylighting 2 (2015) 12-20. https://doi.org/10.15627/jd.2015.2
- E.J. Gago. T. Muneer. M. Knez. H. Köster. Natural light controls and guides in buildings. Energy saving for electrical lighting. reduction of cooling load. Renewable and Sustainable Energy Reviews 41 (2015) 1-13. https://doi.org/10.1016/j.rser.2014.08.002
- J. Mahawan. A. Thongtha. Experimental Investigation of Illumination Performance of Hollow Light Pipe for Energy Consumption Reduction in Buildings. Energies 14 2 (2021) 260-216. https://doi.org/10.3390/en14020260
- R. Canziani. F. Peron. G. Rossi. Daylight and energy performances of a new type of light pipe. Energy and Buildings 36 11 (2004) 1163-1176. https://doi.org/10.1016/j.enbuild.2004.05.001
- D. Jenkins. T. Muneer. J. Kubie. A design tool for predicting the performances of light pipes. Energy and Buildings 37 5 (2005) 485-492. https://doi.org/10.1016/j.enbuild.2004.09.014
- M. Mayhoub. Innovative daylighting systems challenges: A critical study. Energy and Buildings 80 (2014) 394-405. https://doi.org/10.1016/j.enbuild.2014.04.019
- H. von Wachenfelt. V. Vakouli. A.P. Diéguez. N.Gentile. M-C. Dubois. K-H. Jeppsson. Lighting Energy Saving with Light Pipe in Farm Animal Production. Journal of Daylighting 2 2 (2015) 21-31. https://doi.org/10.15627/jd.2015.5
- B. Obradovic. B. S. Matusiak. Daylight Transport Systems for Buildings at High Latitudes. Journal of Daylighting 6 2 (2019) 60-79. https://doi.org/10.15627/jd.2019.8
- D. S. Bisht. H. Garg. R.R. Shravana Kumar. Enhancing the performance of a passive tubular daylighting device using a parabolic-profile collector. Lighting Research and Technology 52 (2020) 495-523. https://doi.org/10.1177/1477153519872794
- A.A. Freewan. L. Shao. S. Riffat. Optimizing performance of the light shelf by modifying ceiling geometry in highly luminous climates. Solar Energy 82 (2008) 343-353. https://doi.org/10.1016/j.solener.2007.08.003
- L. Yaik-Wah. A. Mohd Hamdan. The effects of direct sunlight on light shelf performance under tropical sky. Indoor and Built Environment 24 6 (2015) 788-802. https://doi.org/10.1177/1420326X14536066
- A. Meresi. Evaluating daylight performance of light shelves combined with external blinds in south-facing classrooms in Athens. Greece. Energy and Buildings 116 (2016) 190-205. https://doi.org/10.1016/j.enbuild.2016.01.009
- G.A. Warrier. B. Raphael. Performance evaluation of light shelves. Energy and Buildings 140 (2017) 19-27. https://doi.org/10.1016/j.enbuild.2017.01.068
- A. Kontadakis. A. Tsangrassoulis. L. Doulos. S. Zerefos. A Review of Light Shelf Designs for Daylit Environments. Sustainability 10 1 (2018) 71. https://doi.org/10.3390/su10010071
- P. Zazzini. A. Romano. A. Di Lorenzo. V. Portaluri. A. Di Crescenzo. Experimental Analysis of the Performance of Light Shelves in Different Geometrical Configurations through the Scale Model Approach. Journal of Daylighting 7 (2020) 37-56. https://doi.org/10.15627/jd.2020.4
- G. Oakley. S.B. Riffat. L. Shao. Daylight performance of light pipes. Solar Energy 69 2 (2000) 89-98. https://doi.org/10.1016/S0038-092X(00)00049-9
- D.J. Carter. The measured and predicted performance of passive solar light pipe systems. Lighting Research and Technology 34 1 (2002) 39-51. https://doi.org/10.1191/1365782802li029oa
- A. Rosemann. H. Kaase. Light pipe applications for daylighting systems. Solar Energy 78 (2005) 772-780. https://doi.org/10.1016/j.solener.2004.09.002
- S. Ahmed. A. Zain-Ahmed. S. A. Rahman. M.H. Sharif. Predictive tools for evaluating daylighting performance of light pipes. International Journal of Low-Carbon Technologies 1 (2006) 315-328. https://doi.org/10.1093/ijlct/1.4.315
- S. Dutton. L. Shao. Raytracing simulation for predicting light pipe transmittance. International Journal of Low-Carbon Technologies 2 4 (2007) 339-358. https://doi.org/10.1093/ijlct/2.4.339
- M. Paroncini. B. Calcagni. F. Corvaro. Monitoring of a light-pipe system. Solar Energy 81 9 (2007) 1180-1186. https://doi.org/10.1016/j.solener.2007.02.003
- D.H.W. Li. E.K.W. Tsang. C.C.O. Tam. An analysis of light-pipe system via full-scale measurements. Applied Energy 87 3 (2010) 799-805. https://doi.org/10.1016/j.apenergy.2009.09.008
- Y. Su. N. Khan. S.B. Riffat. O. Gareth. Comparative monitoring and data regression of various sized commercial light pipes. Energy and Buildings 50 (2012) 308-314. https://doi.org/10.1016/j.enbuild.2012.03.053
- K. Vasilakopouloua. D. Kolokotsa. M. Santamouris. I. Kousis. H. Asproulias. I. Giannaraki. Analysis of the experimental performance of light pipes. Energy and Buildings 151 (2017) 242-249. https://doi.org/10.1016/j.enbuild.2017.06.061
- D. Kesten. S. Fiedler. F. Thumm. A. Löffler. U. Eicker. Evaluation of daylight performance in scale models and a full-scale mock-up office. International Journal of Low-Carbon Technologies 5 3 (2010) 158-165. https://doi.org/10.1093/ijlct/ctq023
- M. Bodart. A. Deneyer. A. De Herde. P.P Wouters. Design of a new single-patch sky and sun simulator. Lighting Research & Technology 38-1 (2006) 73-87. https://doi.org/10.1191/1365782806li157oa
- O. Boccia. P. Zazzini. Daylight in buildings equipped with traditional or innovative sources: a critical analysis on the use of the scale model approach. Energy and Buildings 86 (2015) 376-393. https://doi.org/10.1016/j.enbuild.2014.10.003
- A. Goharian. M. Mahdavinejad. A Novel Approach to Multi-Apertures and Multi-Aspects Ratio Light Pipe. Journal of Daylighting 7 (2020) 186-200. https://doi.org/10.15627/jd.2020.17
- C. Baroncini. F. Chella. P. Zazzini. Numerical and experimental analysis of the double light pipe. a new system for daylight distribution in interior spaces. International Journal of Low Carbon Technologies 3 2 (2008) 110-125. https://doi.org/10.1093/ijlct/3.2.110
- C. Baroncini. O. Boccia. F. Chella. P. Zazzini. Experimental analysis on a 1:2 scale model of the double light pipe. an innovative technological device for daylight transmission. Solar Energy 84 2 (2010) 296-307. https://doi.org/10.1016/j.solener.2009.11.011
- V. Garcia-Hansen. I. Edmonds. Methods for the illumination of multilevel buildings with vertical light pipes. Solar Energy 117 (2015) 74 88. https://doi.org/10.1016/j.solener.2015.04.017
- A. Nabil. J. Mardaljevic. Useful daylight illuminances: a replacement for daylight factors. Energy and Buildings 38 7 (2006) 905-913. https://doi.org/10.1016/j.enbuild.2006.03.013
Copyright © 2022 The Author(s). Published by solarlits.com.

1694
Total views
Citations
SHARE ON


