Volume 9 Issue 1 pp. 48-63 • doi: 10.15627/jd.2022.4
An Investigation-Based Optimization Framework of Thermal Comfort Analysis in Underground Enclosed Spaces Affected by Multiple Parameters for Energy Performance in Tropics
Ali Ahmed Salem Bahdad,*,a,b Sharifah Fairuz Syed Fadzila
Author affiliations
a School of Housing, Building and Planning, Universiti Sains Malaysia, 11800, Penang, Malaysia
b Department of Architectural Engineering & Environmental Planning, College of Engineering and Petroleum, Hadhramout University, Mukalla, Yemen
*Corresponding author.
alibahaddad@gmail.com (A. A. S. Bahdad)
sfsf@usm.my (S. F. S. Fadzil)
History: Received 7 March 2022 | Revised 12 April 2022 | Accepted 20 April 2022 | Published online 13 May 2022
Copyright: © 2022 The Author(s). Published by solarlits.com. This is an open access article under the CC BY license (http://creativecommons.org/licenses/by/4.0/).
Citation: Ali Ahmed Salem Bahdad, Sharifah Fairuz Syed Fadzil, An Investigation-Based Optimization Framework of Thermal Comfort Analysis in Underground Enclosed Spaces Affected by Multiple Parameters for Energy Performance in Tropics, Journal of Daylighting 9 (2022) 48-63. https://dx.doi.org/10.15627/jd.2022.4
Figures and tables
Abstract
Optimization becomes more valuable when the optimal variables decision can consider sensitivity analysis. To get optimum results quickly, this study established a synthetic sensitivity analysis and multi-objective optimization approach, which is combined with an energy simulation framework characterized by parallel processing. To discover the final optimal solutions, the optimization procedures were carried out under two scenarios. To investigate the impact of each design variable on the optimization goals in order to select the variables with the greatest impact for inclusion in the final optimization, a sensitivity analysis was carried out. In the first scenario, the link between design variables and objective functions is thoroughly examined, and the ultimate impacts of optimum design variables are examined. The purpose of this study is to look at the effect of thermal envelopes on energy performance for subterranean enclosed spaces in Malaysia's tropics, to determine the best design parameter values for enclosed underground spaces and to introduce suitable variables for thermal comfort and energy performance. The optimization results confirm that while considering two objective functions of thermal and energy performance by using different optimization parameters design that as one of the objectives decreases, the other objective increases. The final optimal solutions showed that, it is possible to decrease the cooling energy for underground spaces, by up to 58.33% of total hours of the year, respectively, while maintaining occupants’ thermal comfort in the acceptable range, by up to 26.84%.
Keywords
Underground enclosed spaces, Multi-objective optimization, Sensitivity analysis, Thermal comfort
1. Introduction
Finding the optimal combination for thermal and energy performance from a vast variety of potential solutions is the major problem in building design performance [1]. A multi-objective composite development encourages the creation of performance-based designs in order to deliver the best solution possible. Performance-based design is primarily concerned with creating a thorough quantitative assessment for a building project, and hence, numerous target purposes for a building performance might be considered [2,3]. These objective functions fall into three categories: economic, environmental and social, and they are employed to meet a set of performance goals [4]. In terms of environmental considerations, the two fundamental and contradictory aims of building designers are the consumption of energy and the thermal comfort of the interior environment. Increasing the thermal comfort of building occupants will eventually result in an increase in building energy usage [5]. Several studies have looked into the thermal comfort of aboveground enclosed spaces for energy performance under various climatic conditions. Similar studies concentrating on underground enclosed spaces (UGES), on the other hand, are scarce [6-8]. There is now a lot of study being done on the effects of the thermal, acoustic and lighting environment on employee health, comfort and productivity in aboveground structures. Because of the unique nature of the interior environment of UGES, study findings from aboveground enclosed spaces cannot be fully applicable to underground spaces, as shown in Fig. 1 [9]. However, the number of underground spaces papers on these performances is increasing at an exponential rate, with a significant rise since 2006 [9]. This pattern confirms the rise in interest in underground structures over the previous decade, as well as the urbanisation trend. Given the enormous population growth in urban cities over the last few decades, underground constructions have become more vital in the development and enhancement of metropolises. As an alternative to metropolitan area growth, a number of underground buildings have been developed in metropolises across the world [10]. With the growth of the city and the rising use of UGES for various purposes, the performance of UGES thermal for energy performance should be examined.
Recently, several researchers sought to examine the thermal performance and energy performance of UGES using various research approaches, achieving a design that meets both thermal and energy performance by utilising many design parameters of the building envelope [11] such as experimental, numerical simulation, and multi-objectives optimization. According to all investigations, the energy performance of UGES is governed by a wide range of significant parameters including design typology, building purpose, covering soil depth and type, HVAC systems, thermal insulation and air infiltration [10]. Liu, Jiang [12] proved that extra insulation is necessary at the corners rather than the centre area of the surface, and that insulation material should be near to the soil surface. Yuan, Cheng [13] investigated the impact of building materials on the temperature and heat flux of basement envelopes, concluding that the thermal conductivity of building materials is a key element in the heat transmission of the envelopes. The study carried out by Dong, Wu [9] primarily focused on the impacts of unidirectional thermal, acoustic and lighting environment management on employee comfort. Yu, Kang [11] investigates and analyses the impact of several ground coupled heat transfer models on underground construction energy consumption forecast. Zhu and Tong [14] conducted thermal calculations on a sample of Yaokang earth-sheltered houses with supplementary heating systems, concluding that the structures represent a step forward in low-energy building design. Tan, Roberts [15] researched the thermal comfort conditions in underground areas in four major Chinese cities with varying climates in order to determine the impact of various climatic factors. Choi and Krarti [16] used the Interzone Temperature Profile Estimation technique to propose an analytical solution for the best thermal insulation distribution for subterranean constructions. It was demonstrated that the ideal thermal insulation distribution may reduce total heat loss from subterranean structures by up to 35% when compared to uniform insulation distributions. Yu, Kang [11] used The Ground Domain Xing model to investigate the impact of thermal features of subsurface building envelopes on yearly energy consumption for five climatic zones in China. The findings suggest that improved thermal efficiency of subsurface building envelopes might increase yearly energy consumption in various climatic zones.
Figure 1
![Number of previous studies on underground buildings with different objectives (2000–2020) [9].](figures/9-48-1.jpg)
Fig. 1. Number of previous studies on underground buildings with different objectives (2000–2020) [9].
Among several studies, studies were found to have been conducted to enhance the thermal and energy performance of enclosed underground spaces. However, none of them provided a thorough study that included design optimization of design parameters with specifics of interior comfort, particularly multi-objectives such as thermal comfort and energy performance based on optimization method. Whereas most studies focused on traditional solutions to study the effect of only one variable, or multi-variables to determine the best solution based on a specific single goal. However, due of the multiple aspects and techniques involved, achieving a design that meets both of these objectives is difficult. It is feasible that classic methods of thumb or the trial-and-error approach can yield good results, but it is extremely unlikely that they will yield optimal results. Global optimization approaches such as genetic algorithms might be used to significantly reduce building energy use while maintaining comfortable interior conditions [17]. The ability to use the multi-objective optimization approach to solve the decision problems that consider as many possibilities as feasible is generally accepted [18]. Nevertheless, the efforts made by earlier research paper on underground spaces to promote and create awareness on thermal analysis for energy performance, some gaps still exist in literature. Previous researches have largely considered the thermal and energy performance issues of UGES. But an all-encompassing view of multi-objectives optimization the performance of such these spaces is lacking in previous studies, due to the complexity of decision-making problems with multiple objectives. Another gap of these researches is that they do not perform the sensitivity analysis (SA) or the uncertain analysis to select the optimal variables. Every design parameter has a significant possibility of having uncertainty about some of its variables for the optimized objectives. Thus, when the optimal variables decision may take SA into account, optimization becomes more beneficial. The SA or the robustness test can be used to solve this problem, by testing the effects of each variable on the design objective. Because the key design factors defined might impact each performance index, SA is an important aspect of building performance analysis. It is usually done early in the design process, when there is more flexibility. To facilitate the optimization issue and substantially save time, the most critical design variables are usually picked before the optimization procedure [19].
To close these scientific gaps, the research presented in this paper addresses the shortcomings of previous studies by developing a synthetic approach based on SA and multi-objective optimization method (MOPM), which is combined with an energy simulation framework characterized by parallel processing in order to achieve optimum results as quickly as possible. This method achieves a balanced overall solution through an optimization study that examines the order and impact of various parameters of UGES design in order to define the best design options that have the greatest impact on improving thermal comfort and reducing energy consumption for cooling. The aim of this study is to investigate the impact of thermal comfort on energy performance for UGES in Malaysia's tropics, allowing for the optimization of design parameter values for enclosed underground space and the introduction of reasonable variables for thermal comfort and energy performance. The efficiency requirements of building envelopes in UGES, on the other hand, may vary significantly with variations in climate. As a result, research on the efficiency requirements for UGES in various climates is required to provide a foundation for the energy-saving design of the envelopes, which is currently lacking in the tropics. Despite previous studies' significant contributions, to the best of the authors' knowledge, there is no research that provides a comprehensive framework for analysing thermal outcomes of UGES energy performance based on SA and MOPM that is capable of addressing peculiar thermal and energy conditions of tropics. The novelty of this paper is the addition of the two conflict goals as an objective to achieve an optimal solution, in other words, improve the thermal comfort to achieve energy performance, something that has never been considered by previous studies for UGES. SA is performed to illustrate the sensitive of the variables to respond to the climate conditions to provide an optimum condition of thermal and energy.
2. Research methodology
Aiming to improve the indoor thermal comfort and energy performance of the underground spaces through optimizing multi-objectives simultaneously which has been limited introduced in literature yet, a novel hybrid approach that integrates fieldwork experiment and parametric optimization is developed in this research. The optimization framework in this study is divided in three sequential steps. First, fieldwork experiment. Thus, understanding the thermal behavior and energy performance of underground space has been made feasible thanks to the experimental investigation. The second step described the monitoring and measurement procedures carried out in an enclosed underground space. The experimental data was used to validate the energy model. In the third step, an energy model of the base case study was created and validated. After calibration, the EnergyPlus model of the building is used by the optimization procedure to find optimal solutions. In the third step, the optimization using Pareto front solutions under EnergyPlus environment using DesignBuilder was run by using the energy model to evaluate potential solutions. The Pareto Front approach provides a sequence of solutions from the Pareto front, with fewer target conflicts compared with other solutions. Two optimization scenarios were used for optimization. The analysis and optimization started at the first scenario; a comprehensive analysis was run to analyse the influence of each design variable on the optimization objectives to selecting the variables that have a large effect to be used in the second step of optimization. For this purpose, SA method was applied. Usually, the most important design variables are chosen before the optimization process to simplify the optimization problem, and dramatically reduce time. Thus, SA is an important part of building performance analysis since the main design variables established can affect each performance index [20]. SA is divided into local and global methods of sensitivity. The local Sensitivity Analysis is focused on just one design parameter per time, whereas Global Sensitivity Analysis is focused on changes in all the design parameters at the same time, and it is more accurate because it takes into account the relationship between input factors [21]. More details for SA can be found in [22-24]. For this stage of optimization in this study, a local sensitivity analysis was performed to understand the effect of every design factor in the thermal comfort and energy performance to determine the most influential design parameters. To carefully examine the relationship between the parameters and design objectives, the range of values of every parameter has been modified and optimized individually, with all the other variables being unchanged. SA is presented to evaluate the effect of design parameters (including Soil thickness, Space Hight, Thickness of external wall, U-Value of the external wall, and U-Value of the roof) on indoor air temperature for thermal comfort and energy usage intensity for cooling loads, which can order of influence of design parameters on building performance can be obtained to investigate the contribution of each variable to the variance of the building performance metrics. This method had been found in previous studies [19,20,23,25,26]. Then, in the second scenario analyses the final effects of optimal design variables selected from first stage of optimization. Figure 2 summarized the optimization framework in this study. The figure showed the overall process of the method to evaluate potential solutions of the optimum indoor thermal comfort and energy performance.
Figure 2
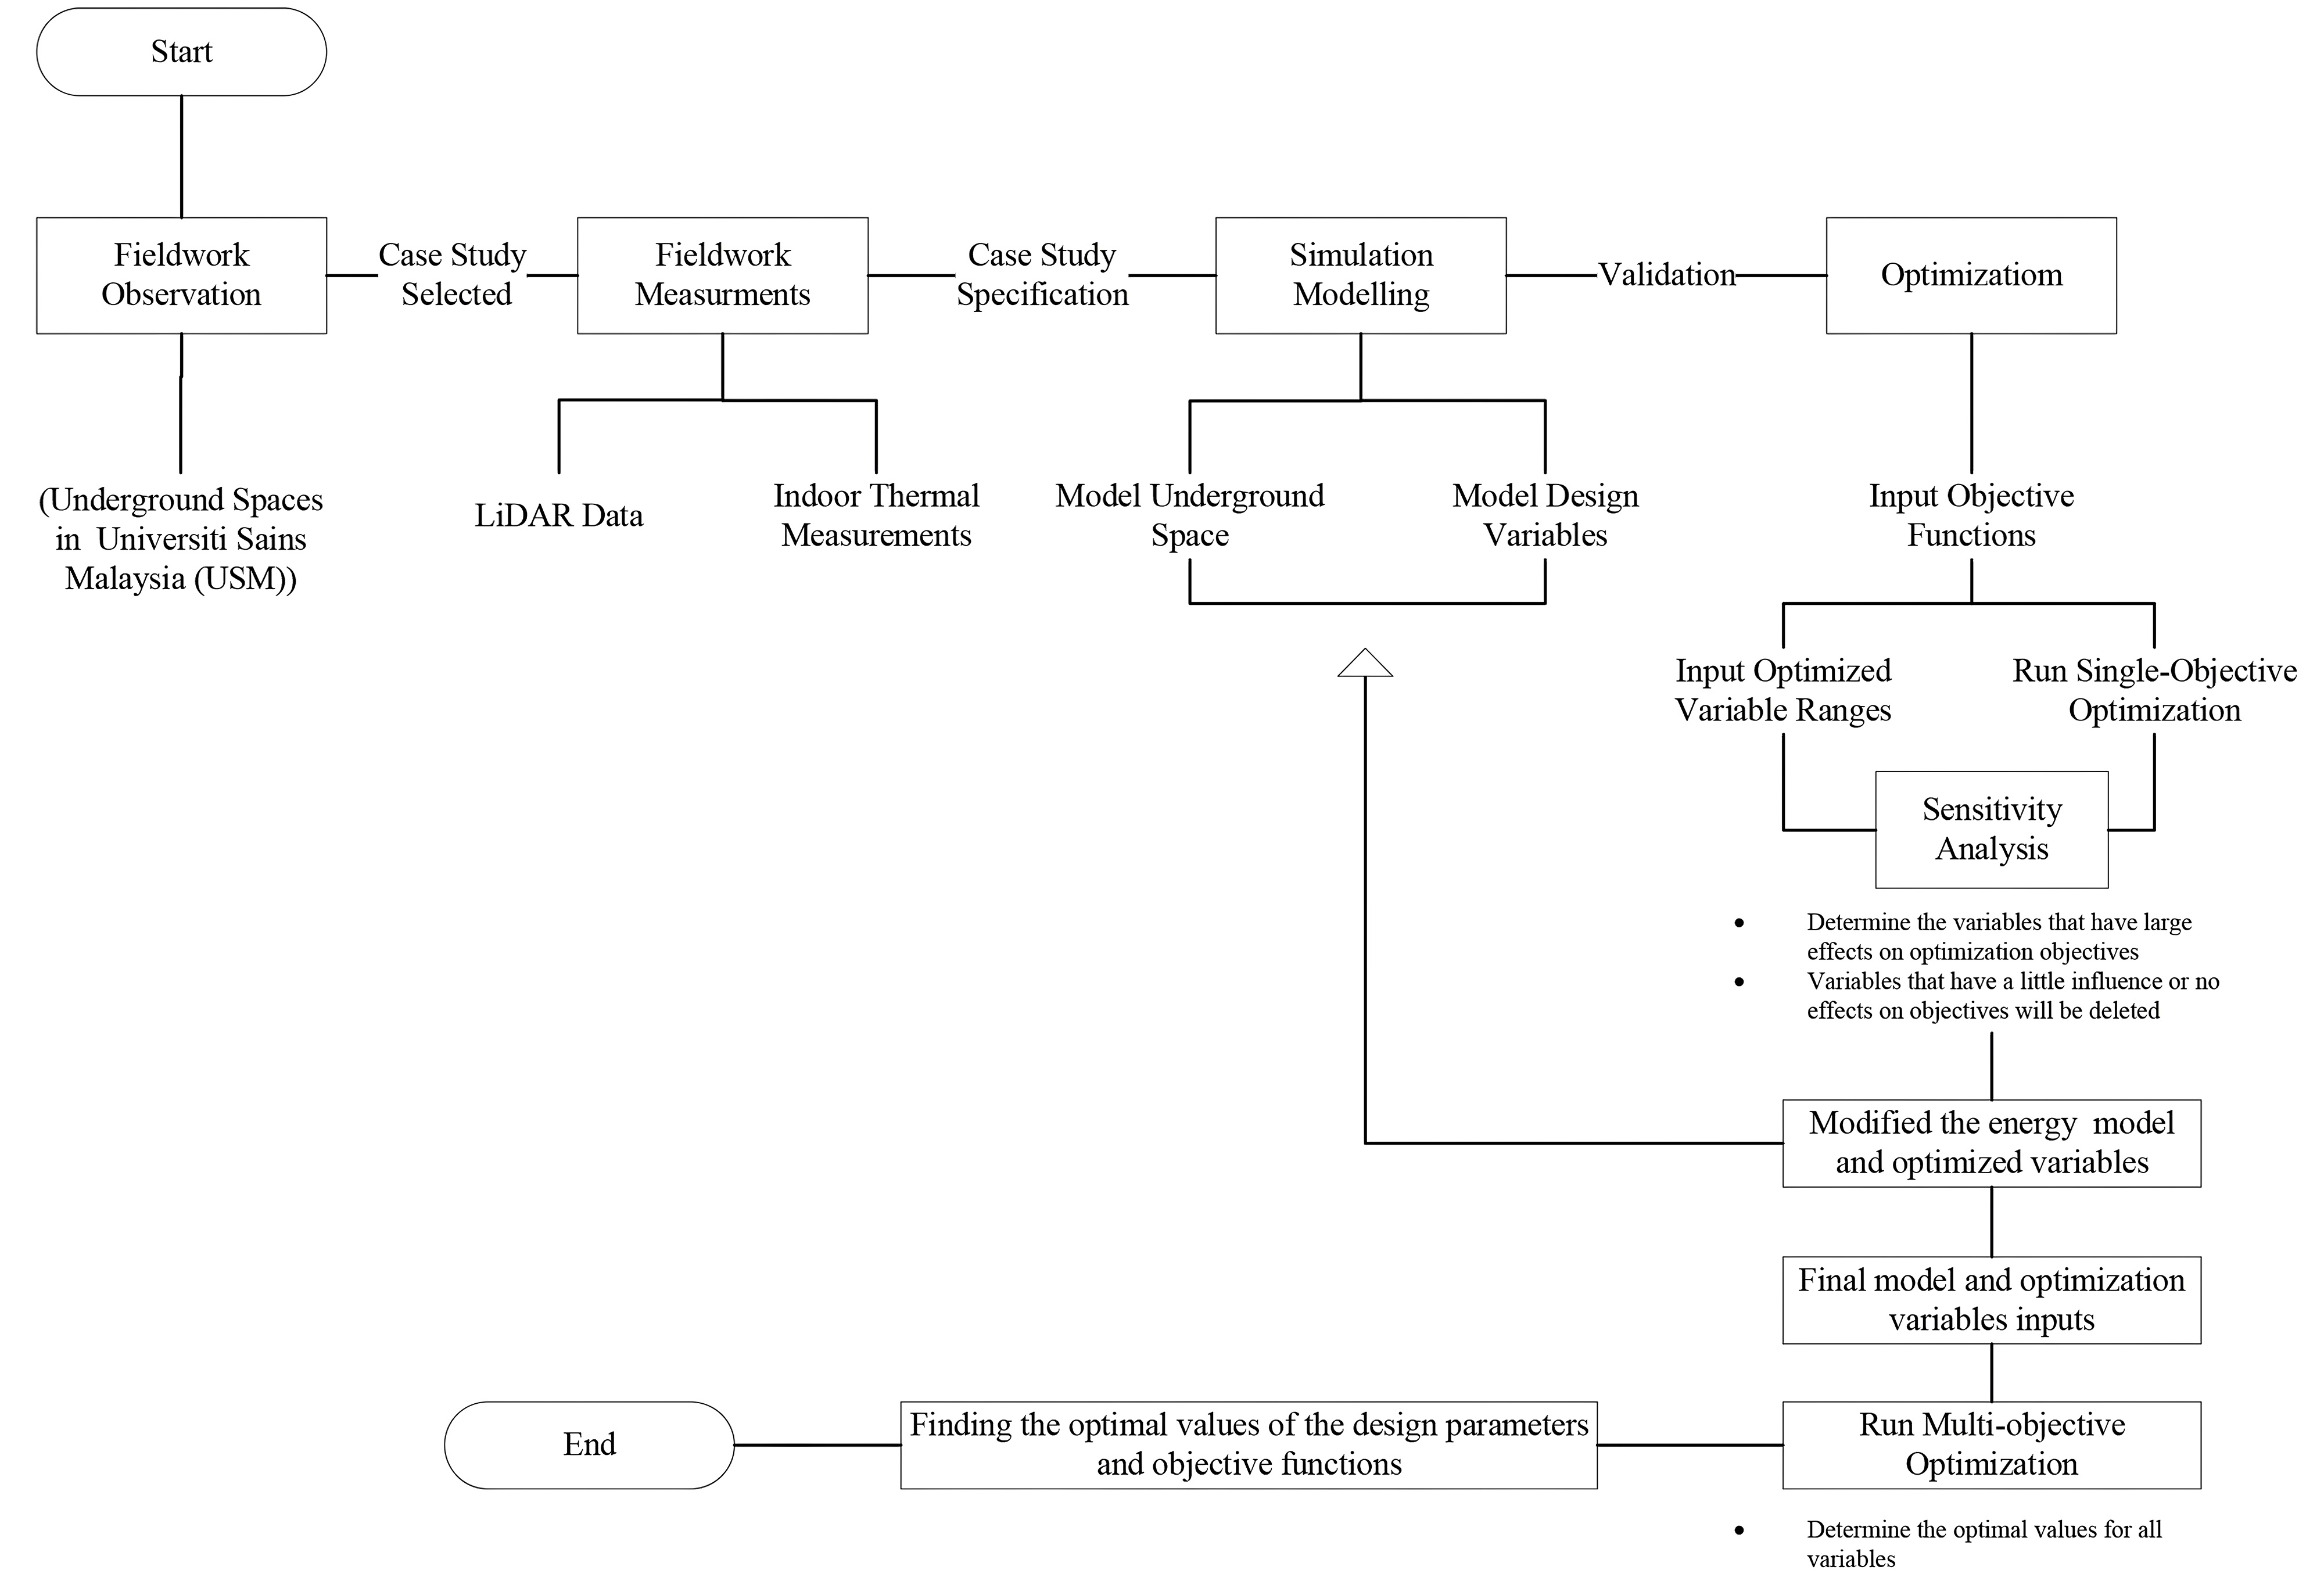
Fig. 2. The research framework.
2.1. Case study description
The base building of this study is one of the two (identical) real simplified UGES (Bunkers) as shown in Fig. 3, located on the main Campus of Universiti Sains Malaysia (USM) in Penang city (coordinates: 5.4164° N, 100.3327° E; altitude: 14 m). The underground space was modelled as same as in-built, with 4.00m depth below the ground. The space is a one-storey rectangular concrete-frame space, with 147.13 m2 of space area, with net interior dimensions of 7.32m width × 20.10 m depth × 3.00 m height. The space has a tunnel which is 1.67 m high and 0.60 m wide around the main space (Fig. 3). Because the space is totally buried beneath the surface, it is presumed that there is no infiltration or solar gain. Furthermore, mechanical ventilation ignores the effect of fresh air on heat transmission between the building and its surroundings. As a result, while calculating the yearly hourly air temperature and cooling energy performance, the hourly air load is not included in the simulation.
Figure 3
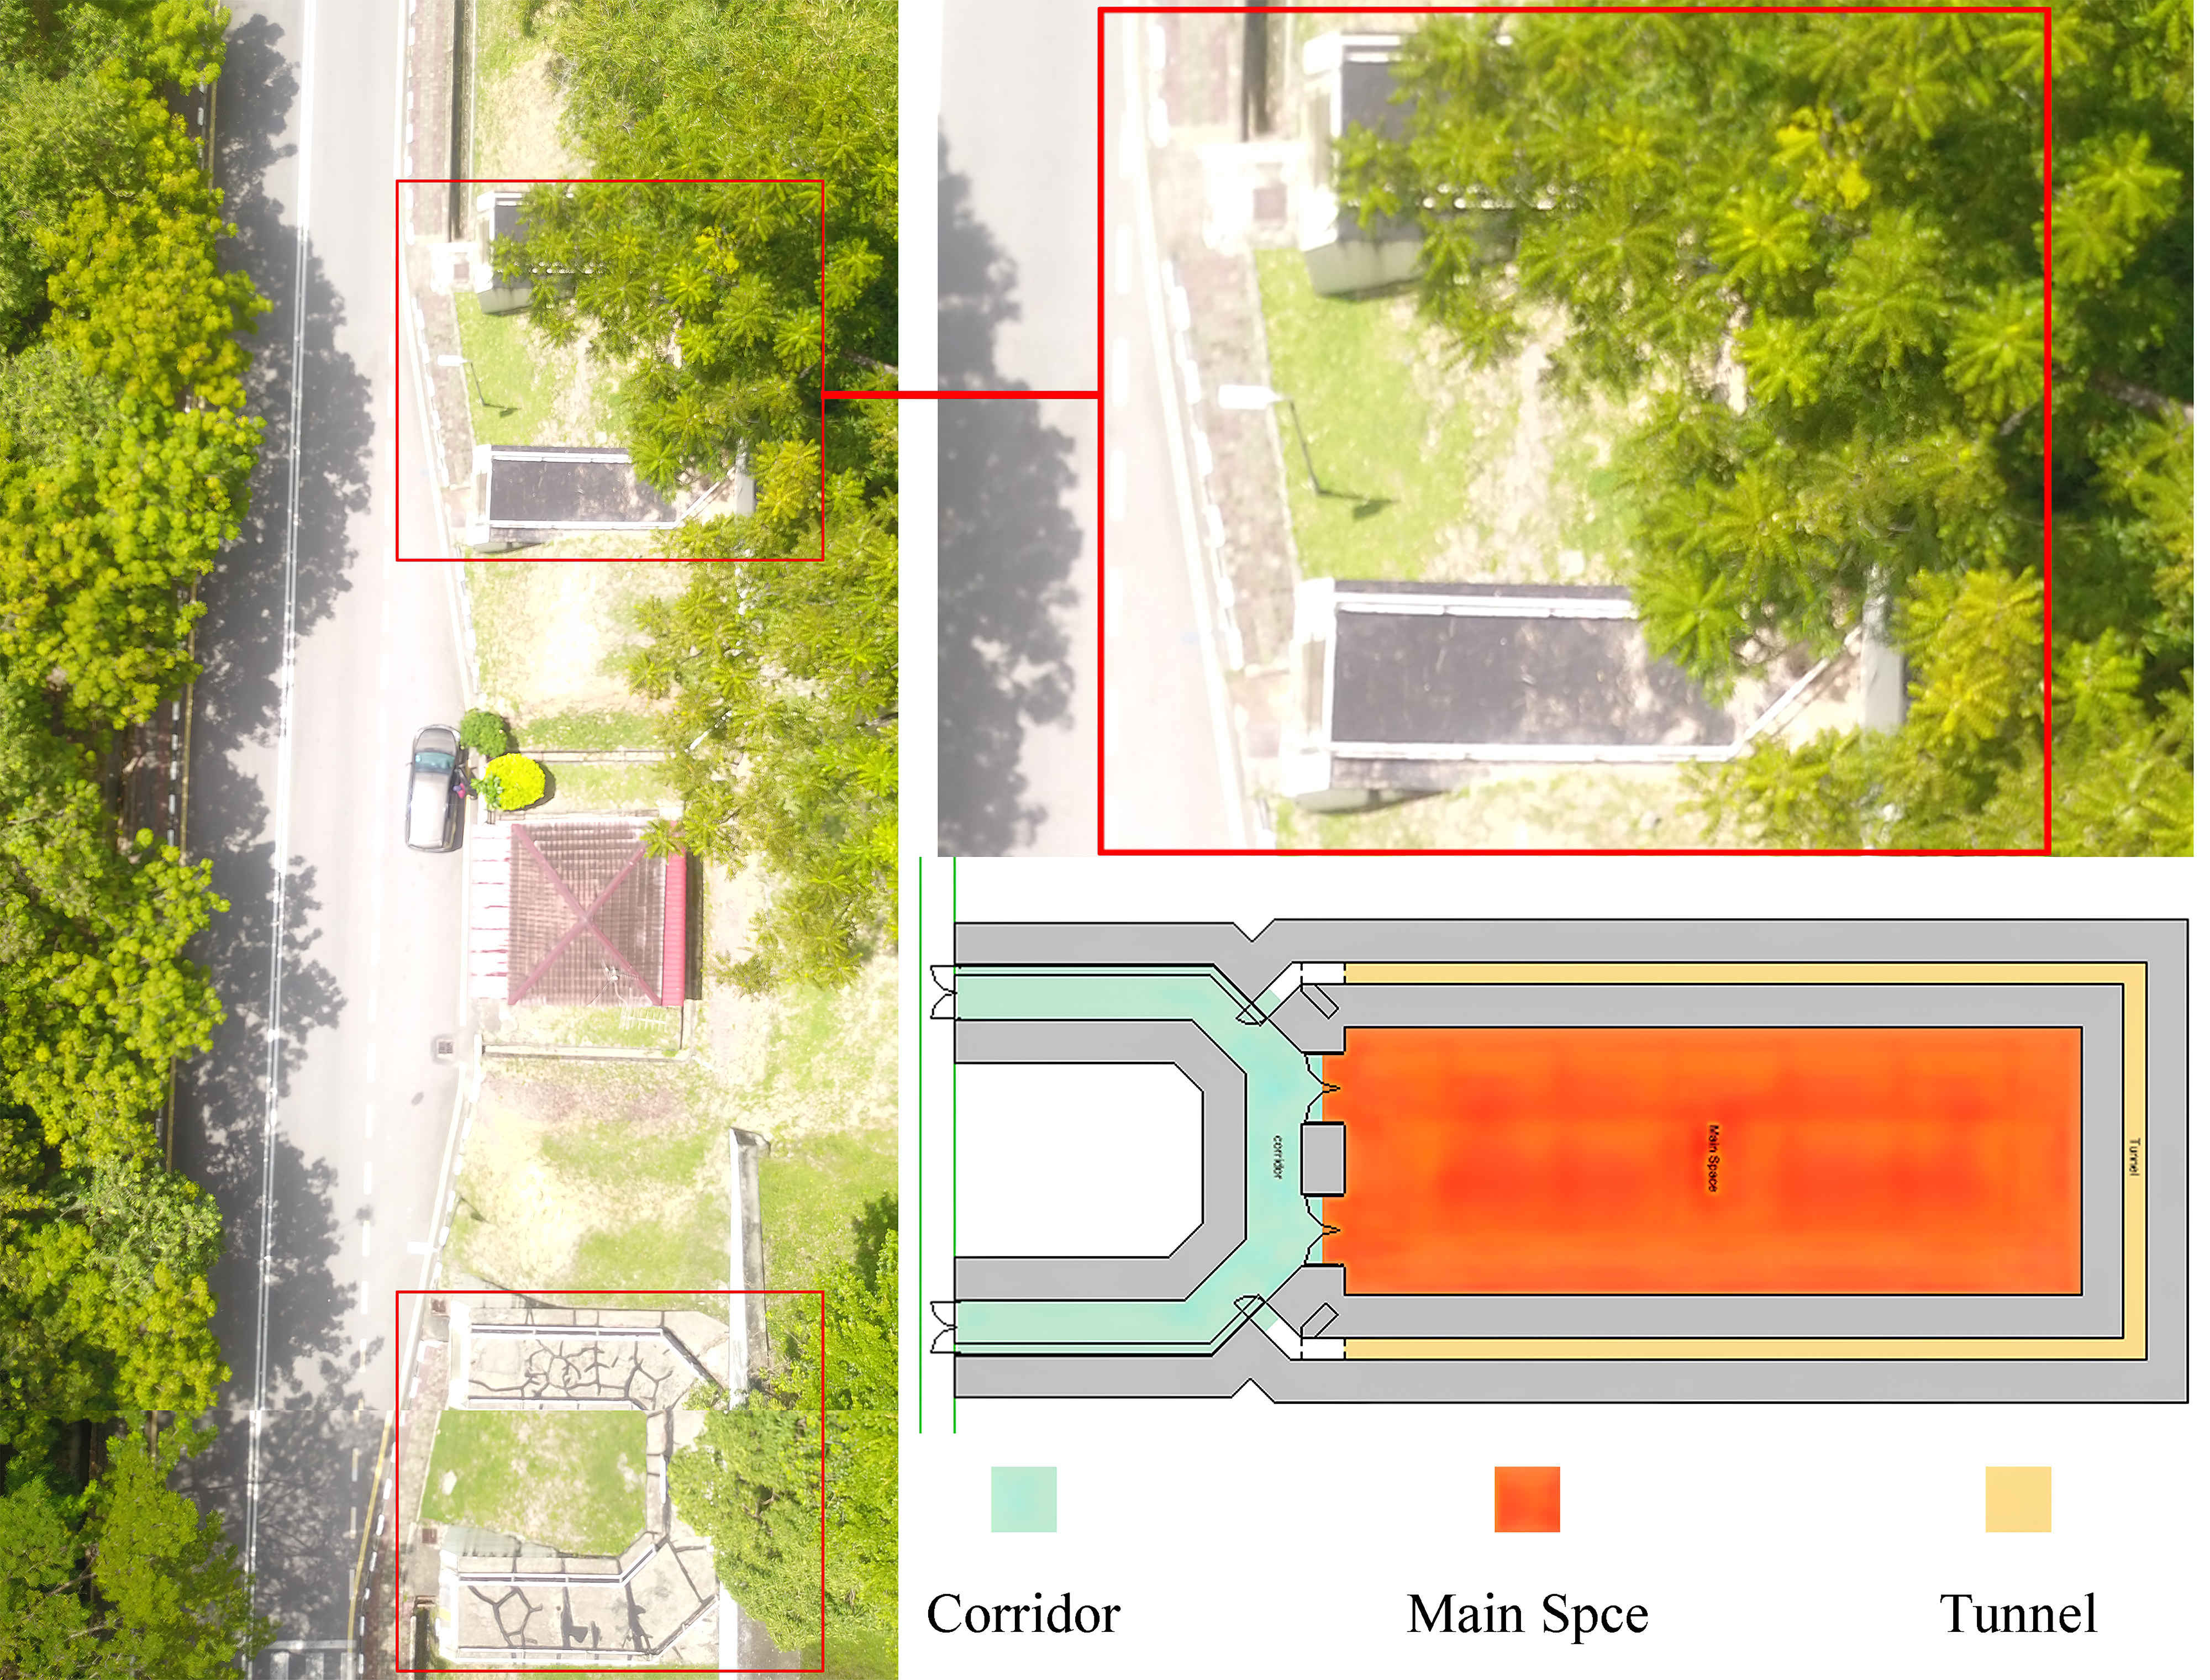
Fig. 3. Case study situation and plan.
2.2. Field measurement
The city of Penang is the same as other cities of Malaysia and has a tropical constant climate (hot-humid) during the year. Qahtan, Keumala [27] reported that Malaysia receives an annual total radiation of over 4,31 kWh/m2 at approximately 10 hours per day. This causes a higher indoor temperature. Monthly sunlight durations ranged from 9 to 13 hours, with monthly solar radiation averages ranging from 4 to 4.6 kWh/m2. In February and September, the maximum monthly average was 4.52 and 4.6 kWh/m2 respectively [28]. The yearly mean air temperature is 27 °C, the monthly mean maximum temperatures vary from 33.5 °C in March/April to 31.9 °C in December. On the other hand, the monthly mean minimum temperatures range from 23.1 °C in January to 24.3 °C in May [29]. Field measurements were taken to provide data for the simulation model's validation as well as to analyse the building's performance in terms of indoor air temperature. The experiment is performed in two stages. In the first stage, the remote sensing data and buildings’ metadata are processed. The purpose of this stage is to determine the topography of the land and measure the level of the soil above the surface of the building. Drone with GoPro camera was used. During the second stage, the thermal performance was quantified via indoor air temperature. Measurements were taken 24 hours a day to investigate the thermal behaviour of interior air temperature. A data recorder and three sensors installed in the centre of the room (at front, centre, and rear) were used to record the observed air temperatures every 30 minutes, as shown in Fig. 4 at height of 1.00m from the floor, according to the ASHREA-55-2010 standard [30]. Thus, the thermal measurements were limited to three days the hottest period (October 13th, 14th, and 15th, 2021) whilst no occupants were present. Cooling, air conditioning, and ventilation systems were turned off, and doors were closed as well. Measuring instrument was SDL350: Hot Wire CFM Thermo-Anemometer/Data Logger (Temperature Range: 32 to 122°F (0 to 50°C), Resolution:0.1°, and Accuracy ±1.5ºF (±0.8ºC) as shown in Fig. 5.
Figure 4
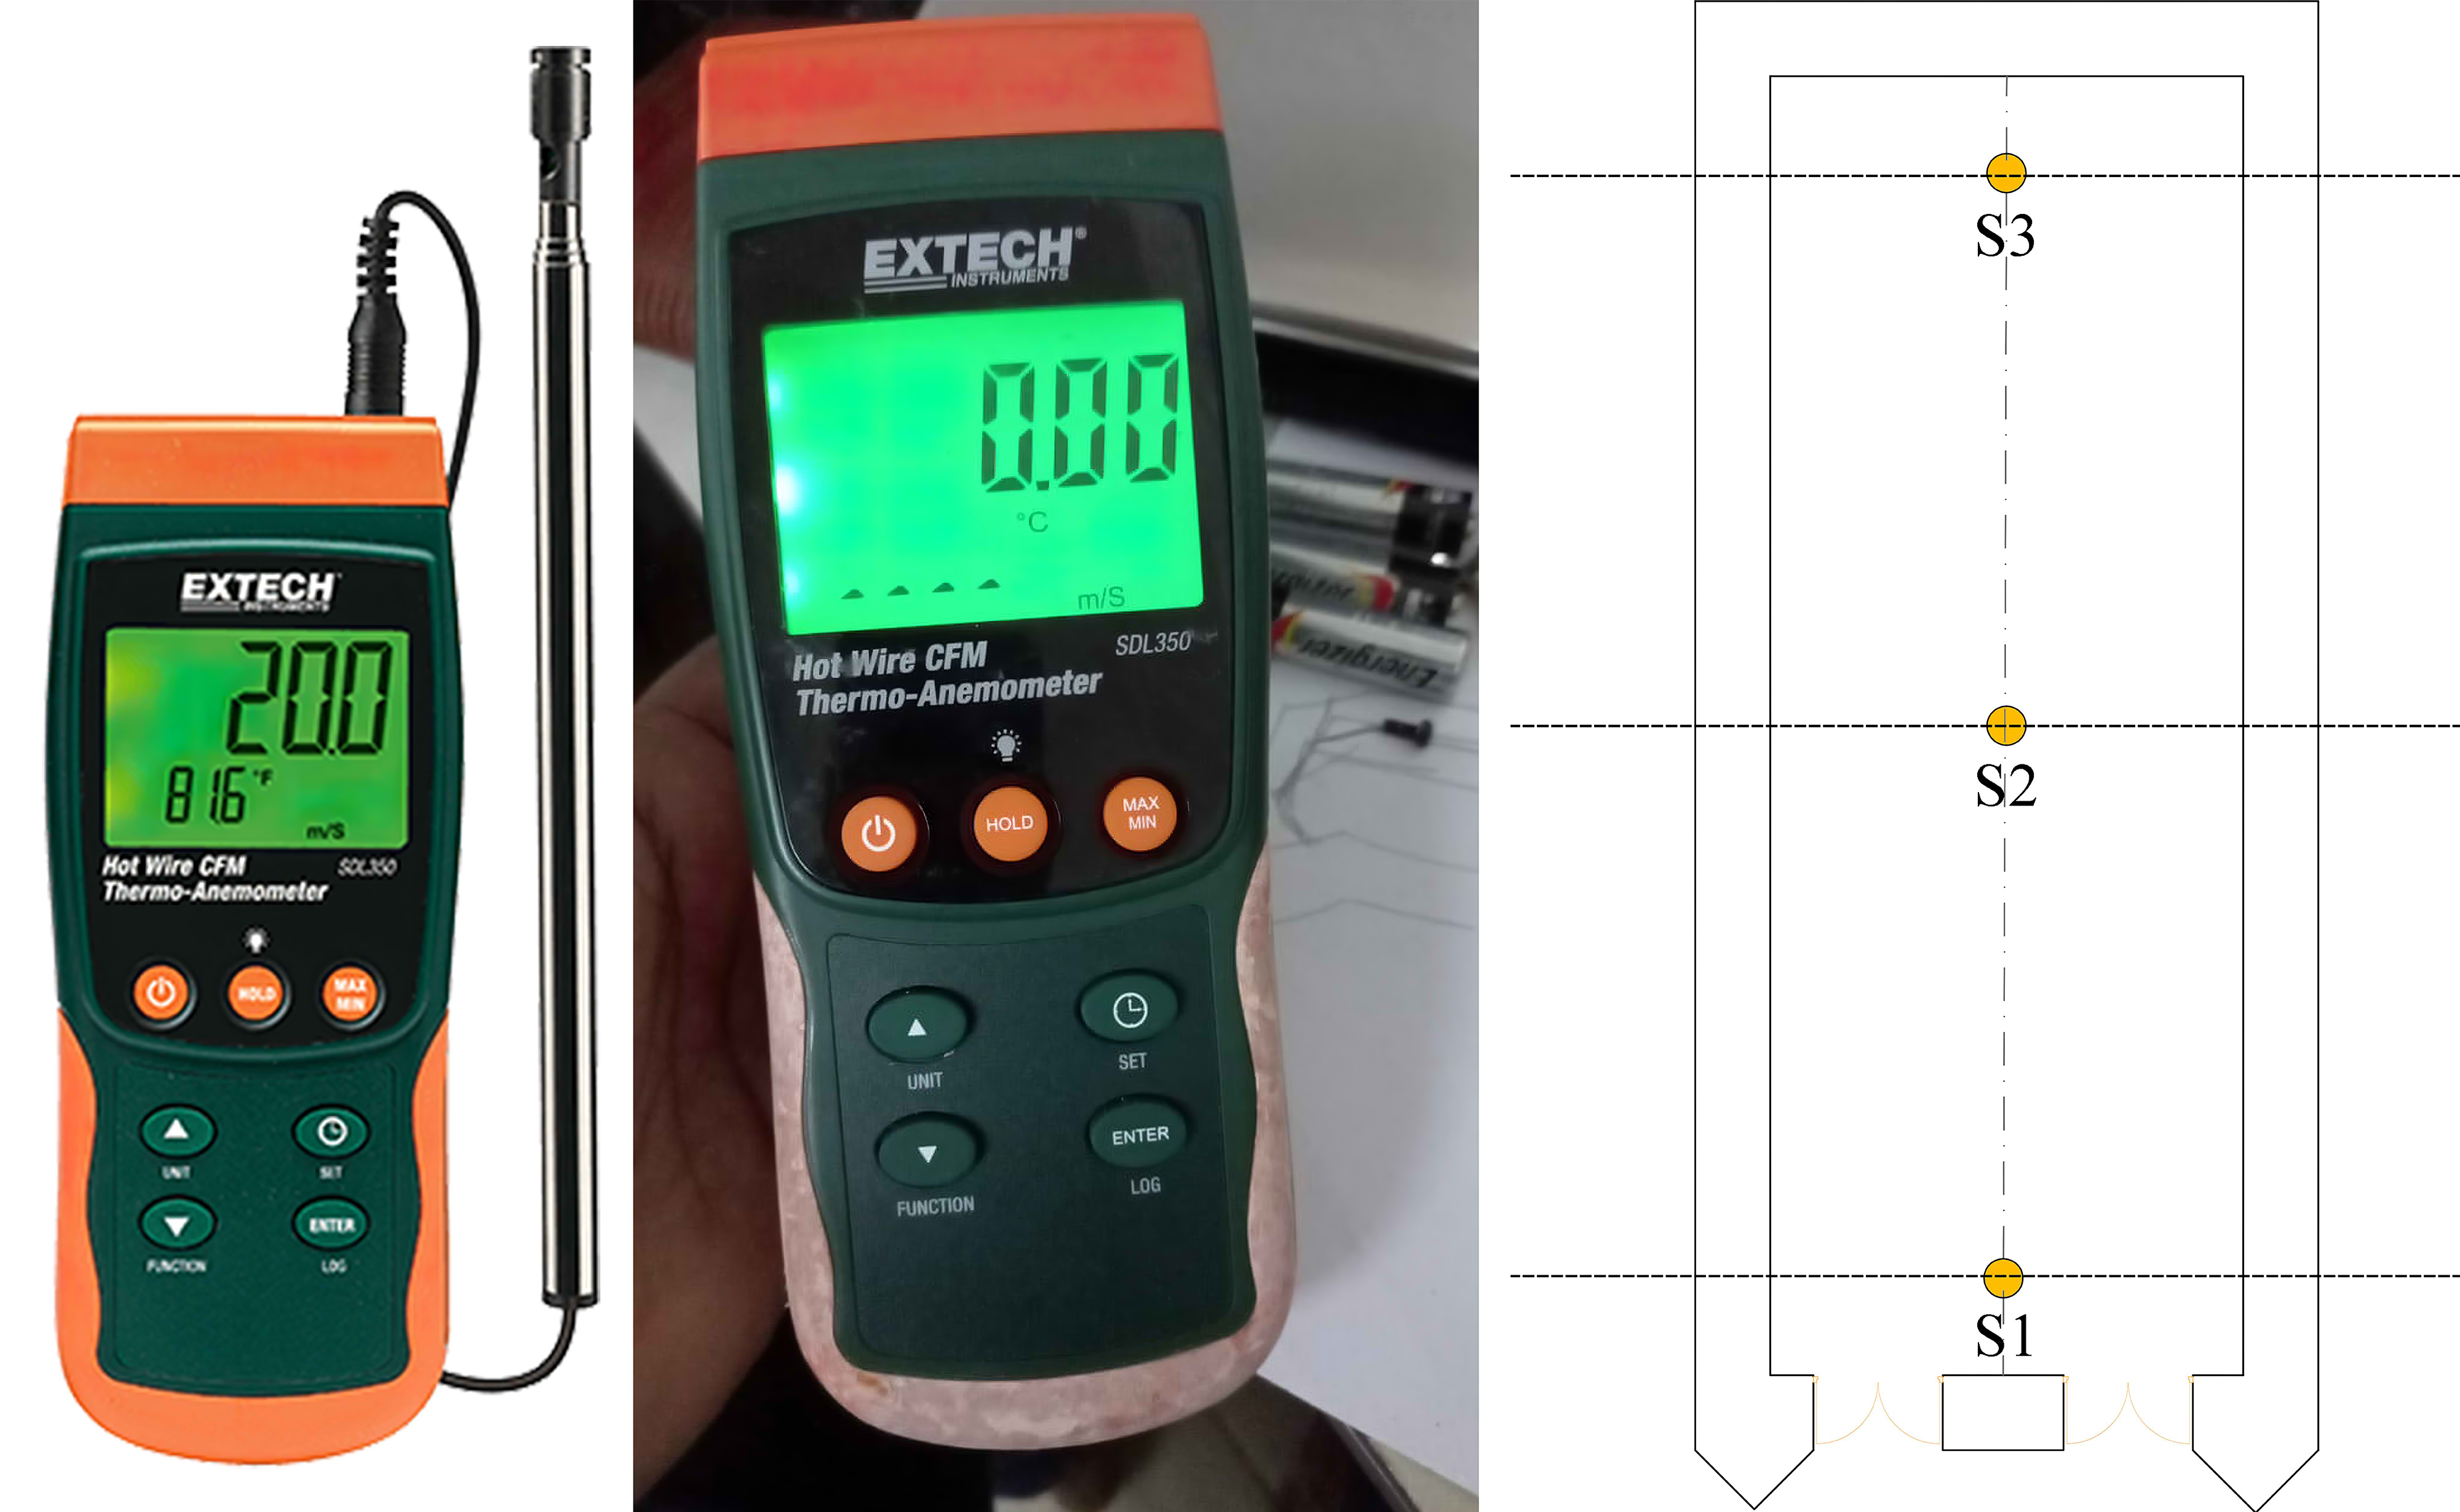
Fig. 4. “SDL350” instrument for indoor air temperature measurements and sensor points.
Figure 5
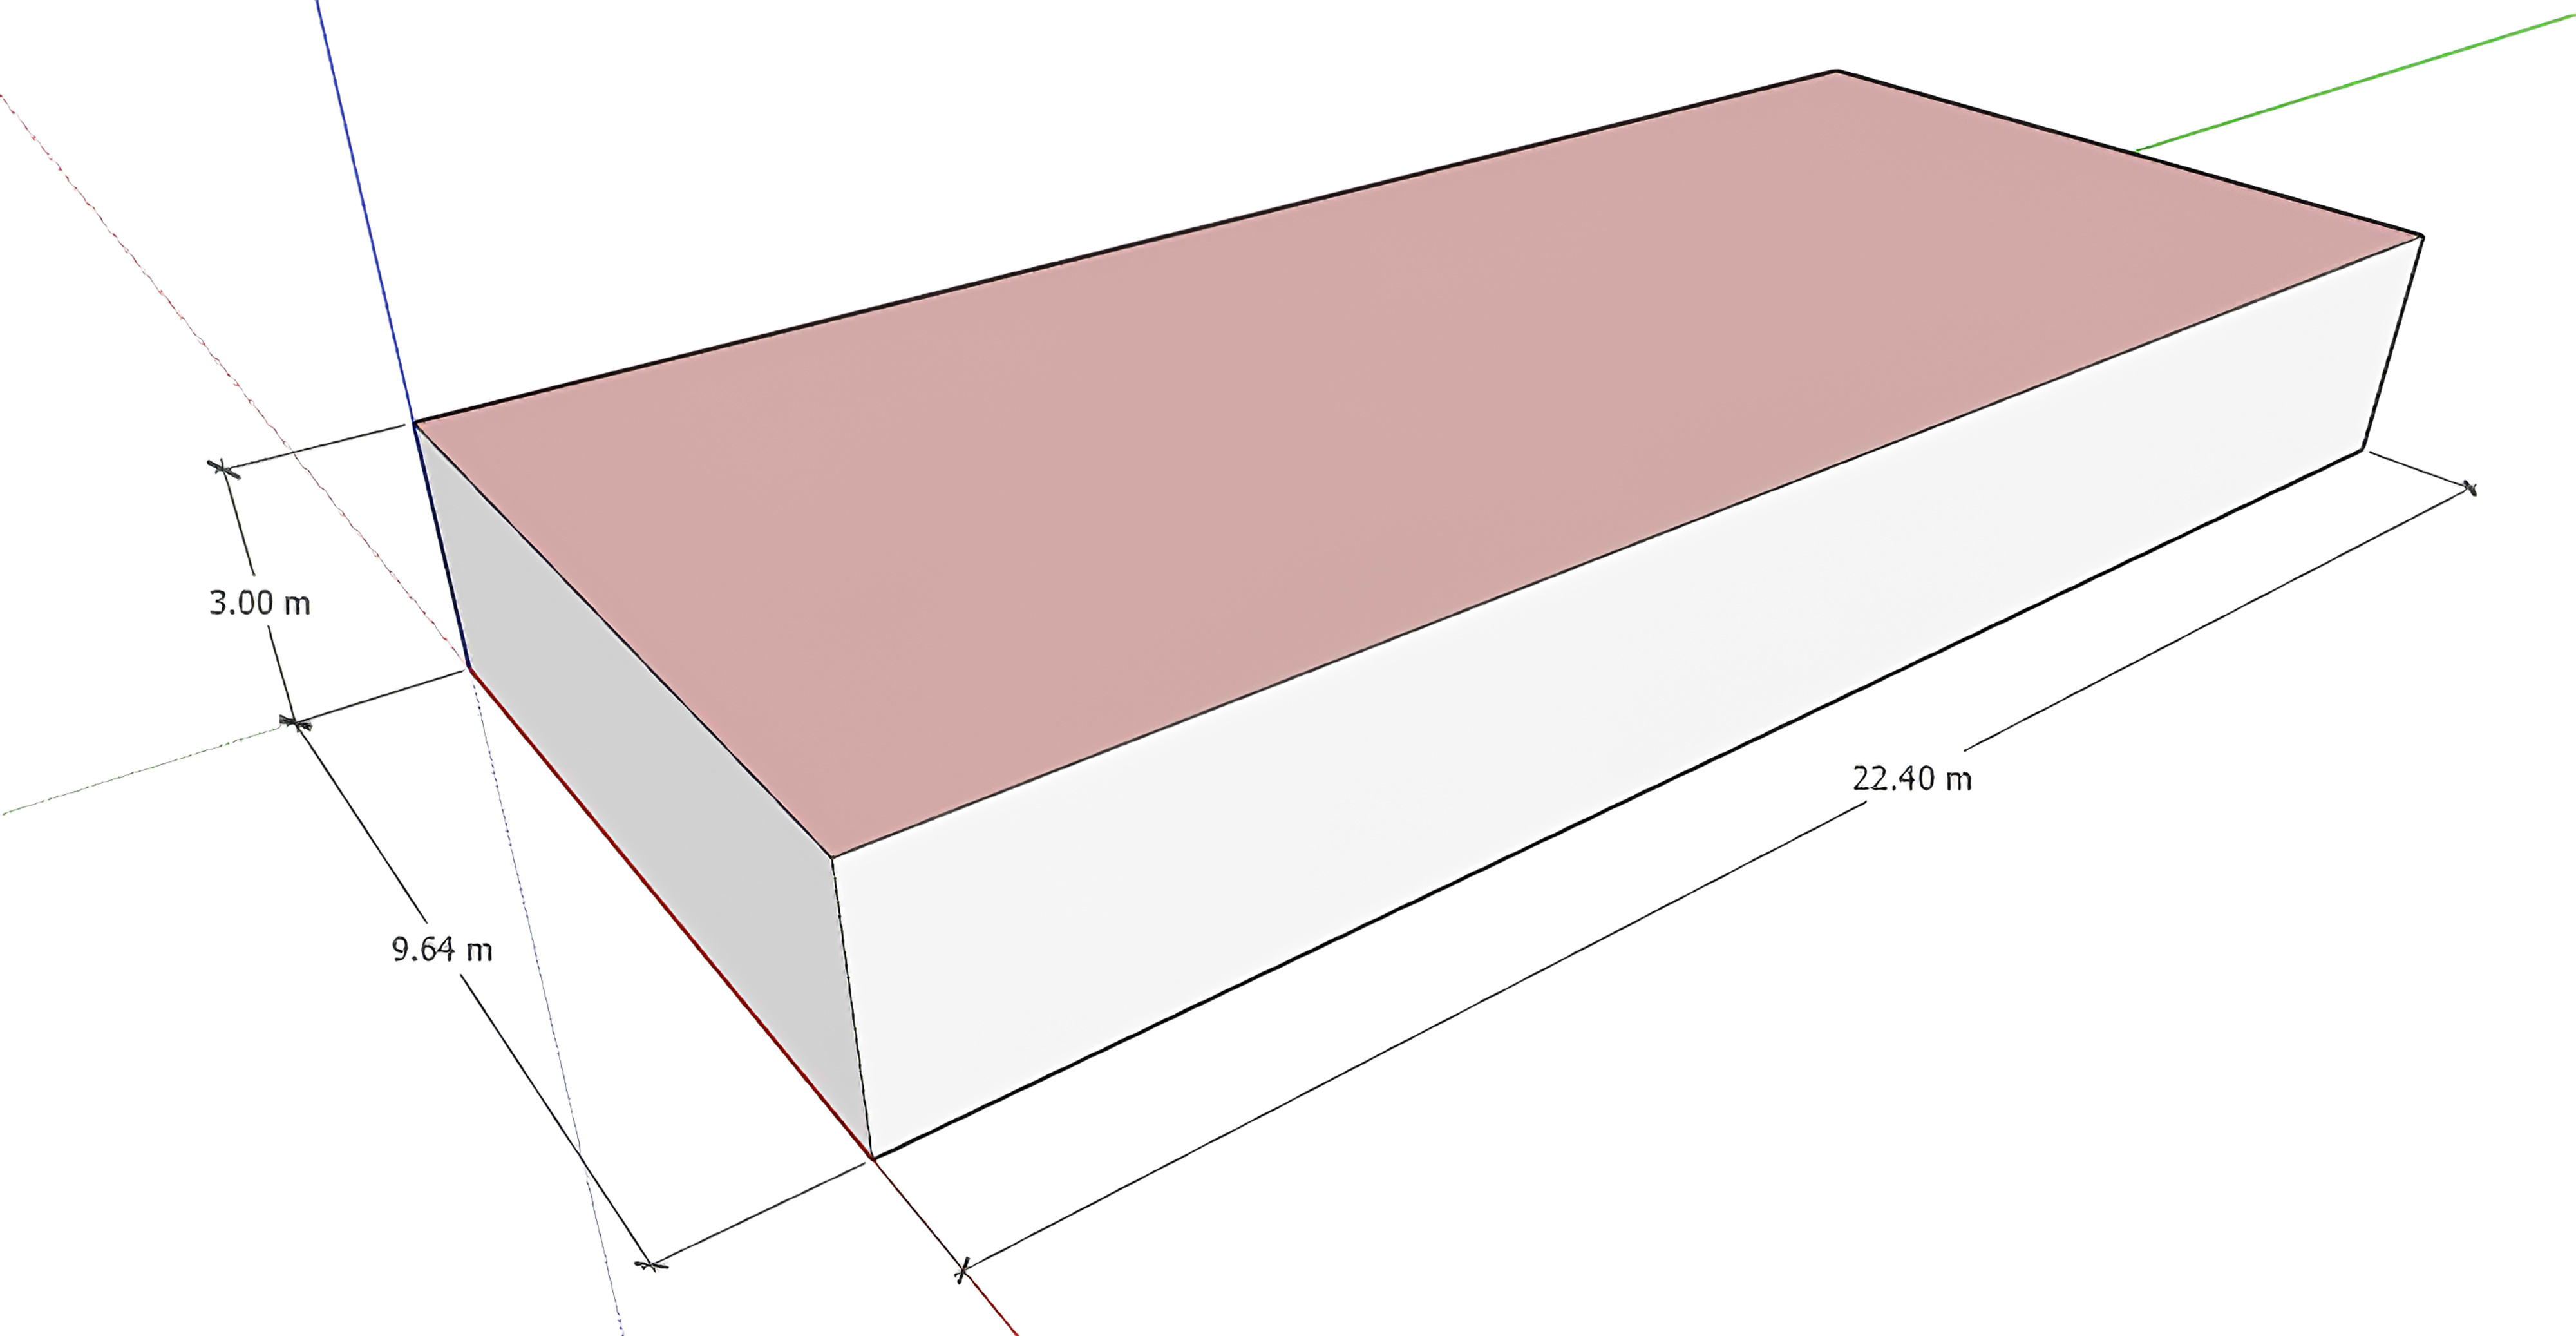
Fig. 5. Simplified underground space.
3. Simulation and optimization
3.1. Design variables and optimization scenarios
Optimization variables for indoor UGES involved in envelope optimization mostly comprise structure (walls, floors, and roofs), space layout, and the depth of solid as insulation layer as well, because the depth has a significant impact on the UGES internal heat environment [10]. Wall thermal conductivity, wall solar absorptivity, wall thickness, wall material density, and wall specific heat are the most important related variables to consider. The height, depth, and width of the space are the most important variables in space layout design. Design variables in this study may be chosen based on the real optimization demands and have an influence on both thermal comfort and energy performance. The variables considered can be determined, as shown in Table 1, with a total of five optimization variables based on into two groups: space-related, and soil thickness-related based on six scenarios of optimizations (A to G) under two optimization scenarios. The variables were chosen based on experience and common values in the literature. For example; Shi, Zhang [10] study the annual hourly heating and cooling loads were calculated and the relationships between the annual energy consumption and the U values of the envelopes were detected for underground office buildings in various climates of China.
Table 1
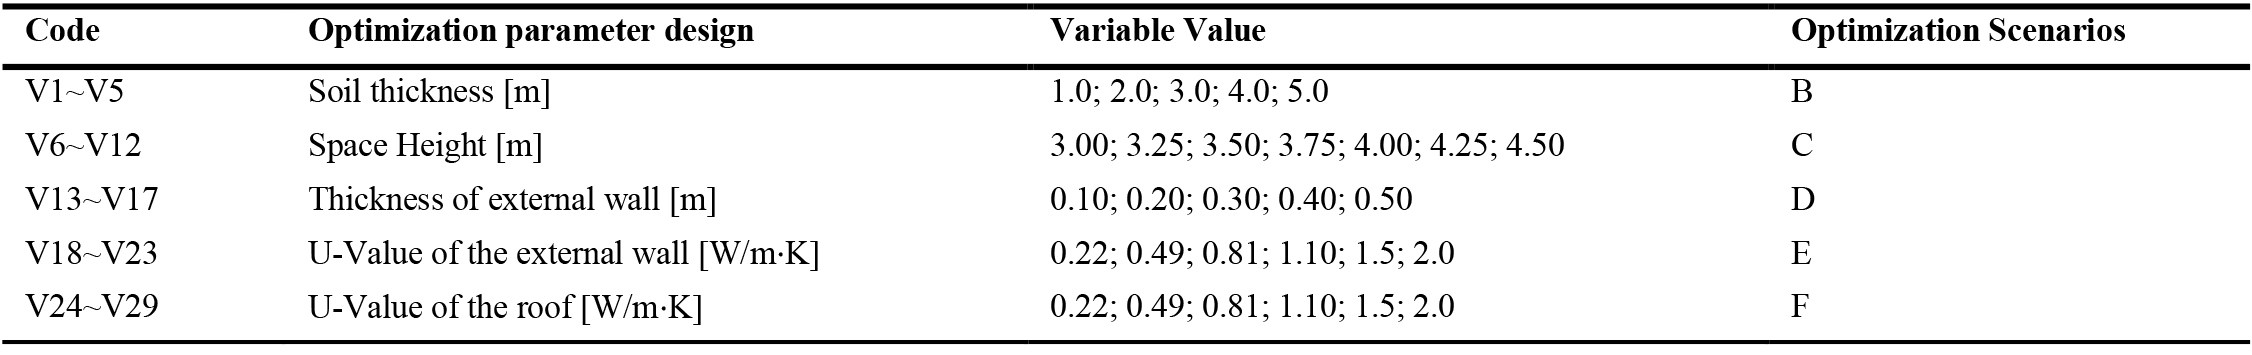
Table 1. Characterization of optimization variables.
First, scenario A is run to compute the indoor air temperature of the reference case (RC), as shown in Fig. 3, without taking into account the cooling equipment’s, parameters and schedules of internal heat sources in the UGES. This setting was utilised because the cooling system was not turned on during the field measurements, and no people were present. In relation to scenarios B–F, the characteristics and schedules of internal heat sources, as given in Table 2, which were specified in accordance with the design standard for aboveground enclosed space, are taken into account. These values were carefully chosen based on previous studies [10,31]. And the indoor temperature and energy performance are calculated. Scenario B to F were run separately, suing single-optimization objective (single variable optimization), one by one, keeping all other variables constant in every optimization run to investigate the influence of each variable alone on both objectives to determine the variables that have large effects on optimization objectives and the variables that have little influence or no effects on all optimization objectives can be deleted as appropriate in the final optimization to reduce the large number of variables. After determining the variables that have a large effect, scenario G was run using MOPM to determine the optimal values for all variables in one time. Scenario B was carried out in order to study the impact of soil thickness on both objectives and to identify its appropriate thickness. This is followed by the execution of scenario C, which was performed to optimize the space height based on the optimal soil thickness value results from scenario B, in order to determine its optimal Height, while keeping other variables constant. In the third and fourth scenarios D and E were performed to optimize the thickness and U-value of the exterior walls based on the optimal variables from Scenario B and C, and B, C, and D respectively, to determine its optimal thickness and U-value. Finally in the last scenario, scenario F was performed to optimize the U-value of the roof based on the optimal variables from scenarios B, C, D, and E, and to determine its optimal U-value. The details of the six optimization scenarios are presented in Table 2.
Table 2
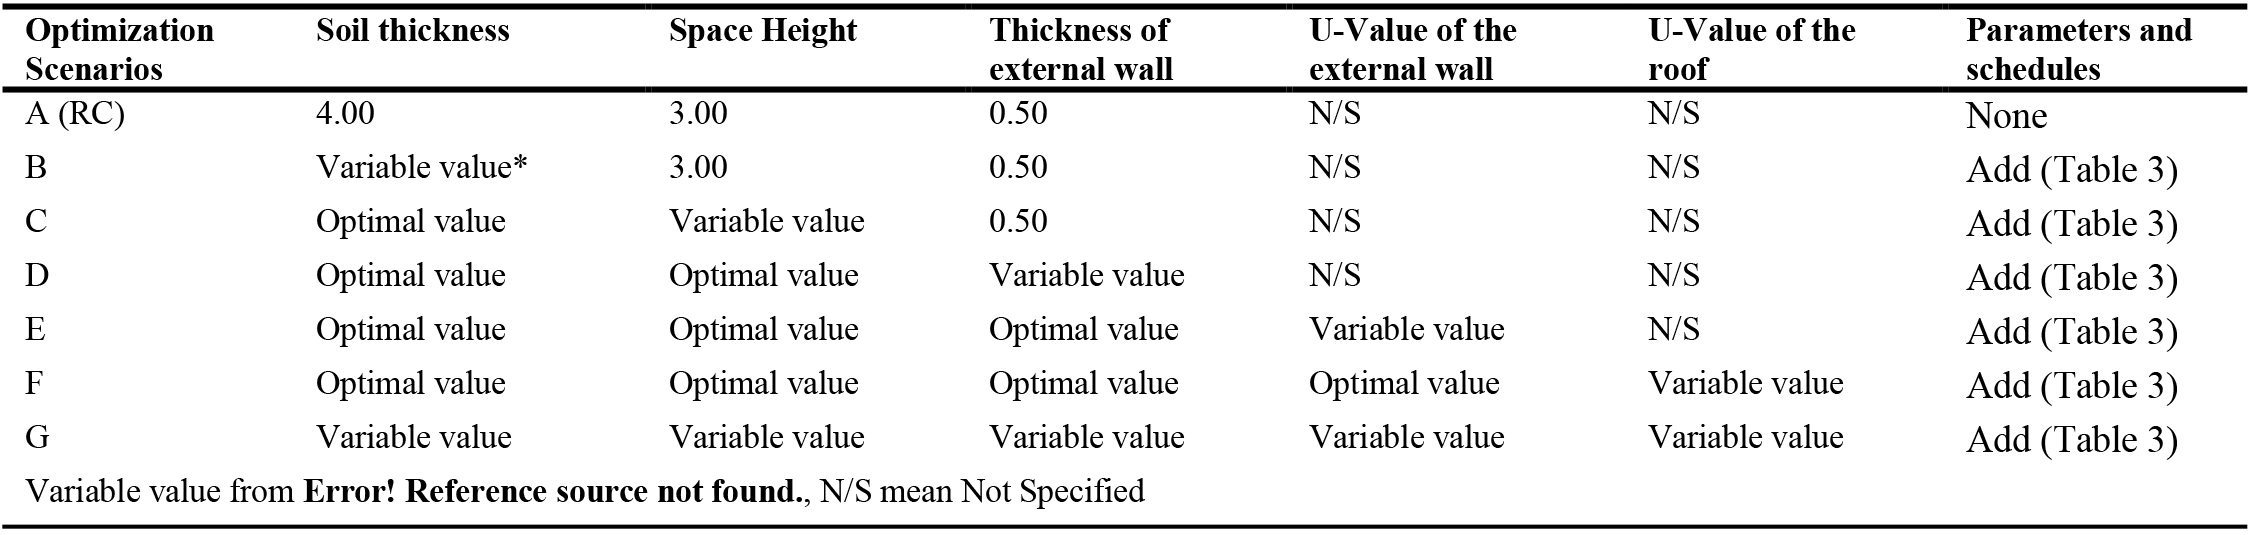
Table 2. Commonly applied daylighting systems without shading.
3.2. Simulation tool and establishing energy model
The simulation study was carried out in a single year to predict the influence of UGES on thermal comfort and cooling energy performance in tropics climate of Malaysia in real underground space. According to the defined optimization objectives and variables in the previous sections, and in order to simulate the real condition of the UGES, a well-known and validated software was adopted to reproduce indoor air temperature and energy performance for cooling. The optimization was done with Design Builder, a software that uses EnergyPlus to calculate building energy, lighting, and comfort performance of a building. EnergyPlus is a well validated energy simulation engine [32]. Design Builder is utilised to streamline the construction, modelling, and simulation processes for maximum productivity by allowing users to swiftly assess the function and performance of building designs, as well as create outcomes in a variety of settings [31]. The Initial simulation model as shown in Fig. 5, was generated in the Design builder based on collected geometry and construction data, and same building which was used for on-site investigations was modelled and calibrated using the measured data to validate. The component of the modelling procedure that does not contain optimization variables has been adequately simplified to minimise computation time. The DesignBuilder was used in this study, due to having fully demonstrated its potential to obtain the optimum parameters of the design parameters, aiming to assess thermal comfort and cooling energy performance using optimization method to generate Pareto front solutions, using MOPM. Thermal and energy simulations were run in numerous phases, with space characteristics such as the number of persons per floor area, cooling set point, and so on. Table 3 depicts the assumptions, which include the schedule, density (people per square metre), internal gains (W/m2), and cooling set-point (°C). Weather files based on the EnergyPlus weather file were created to conduct the simulations (epw). Design Builder's energy-use data was used to validate assumptions about occupancy patterns and ventilation regimes. These assumptions were selected based on previous studies [11,31].
Table 3
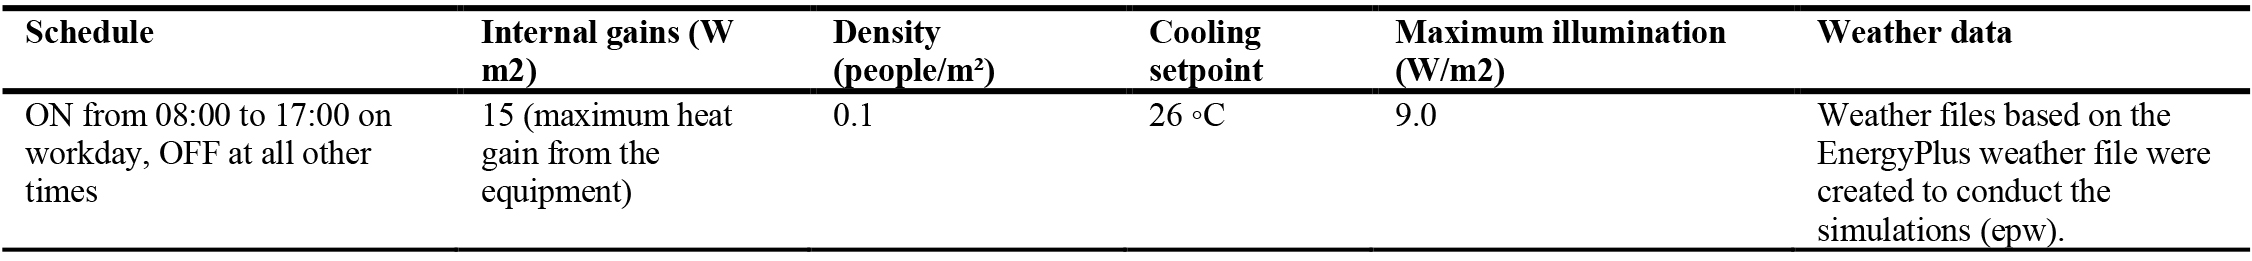
Table 3. Assumptions of Internal heat sources for an underground space.
3.3. Objective functions
To optimize the performance of the reference case underground space, thermal comfort and energy performance was considered over an entire year. Thermal comfort metric was employed to measure thermal comfort is the percentage of Thermal Comfort Hours (TCH) [33], throughout the occupied time in the entire year. Thermal comfort hour is defined in this study as an hour during which the indoor air temperature is within the range of the cooling set-point that controls the operation of the HVAC system. In order to demonstrate the "best-case scenario" for thermal comfort in tropical areas dominated by cooling demands, since the indoor temperature is varying according to applied temperature control system setpoints, the interior thermal mass of model is of interest for this process [34]. Thus, the room was modelled as a thermal zone and set to be fully air conditioned throughout the year. According to Nasrollahzadeh [35] for mechanically conditioned buildings, cooling setpoint is between 23 to 26°C, respectively, which these points can be changed to maximum, or minimum based on a given range. Thus, in this study the indoor setpoint temperature of 26°C (Table 3) during the day was based on most previous studies [36-38]. Due to the geographical location, the necessity for energy for heating is essentially non-existent in a tropical climate, therefore, energy performance was assessed by analysing the energy usage intensity (EUI) on a monthly basis for cooling loads in this study. Thus, the EUI is the normalised cooling load (Kwh), which measures cooling energy consumption in tropical climates [39].
4. Results and discussion
4.1. Experimental measurement and model validation
In order to validate the accuracy of the energy model with EnergyPlus, the study compared simulated indoor air temperature with the experiment results of the reference case. Experimental measurement was conducted from Oct. 13 to Oct. 15, 2021, and the data were recorded for 24h every day with the Data Loggers (SDL350) in the three uninterrupted days as mentioned before. Figure 6 shows the changes of the indoor measured air temperature and the indoor simulated air temperature. The measured and simulated temperatures follow similar patterns. In accordance with prior researches, the statistical coefficient of determination (R2) and Root Mean Square Error (RMSE) were employed to assess the error between predicted and measured values in order to validate the modelled results. RMSE is also included because it is commonly used and provides a quantifiable result (it should be close to 0). As shown in Fig. 7, the coefficient of determination (R2) of indoor air temperature is 0.8438 approaching to the values between 0.89 and 0.99 and is in line with previous studies i.e. Acero and Herranz-Pascual [40] and Tsoka, Tsikaloudaki [41]. Furthermore, the Root Mean Square Error (RMSE) of indoor air temperature is RMSE = 0.135 (Fig. 7), approaching to that of 0.46 in the previous study by Aboelata [42]. However, the coefficient of variation of RMSE is less than ± 15% [43]. Therefore, the model is considered reasonable and reliable.
Figure 6
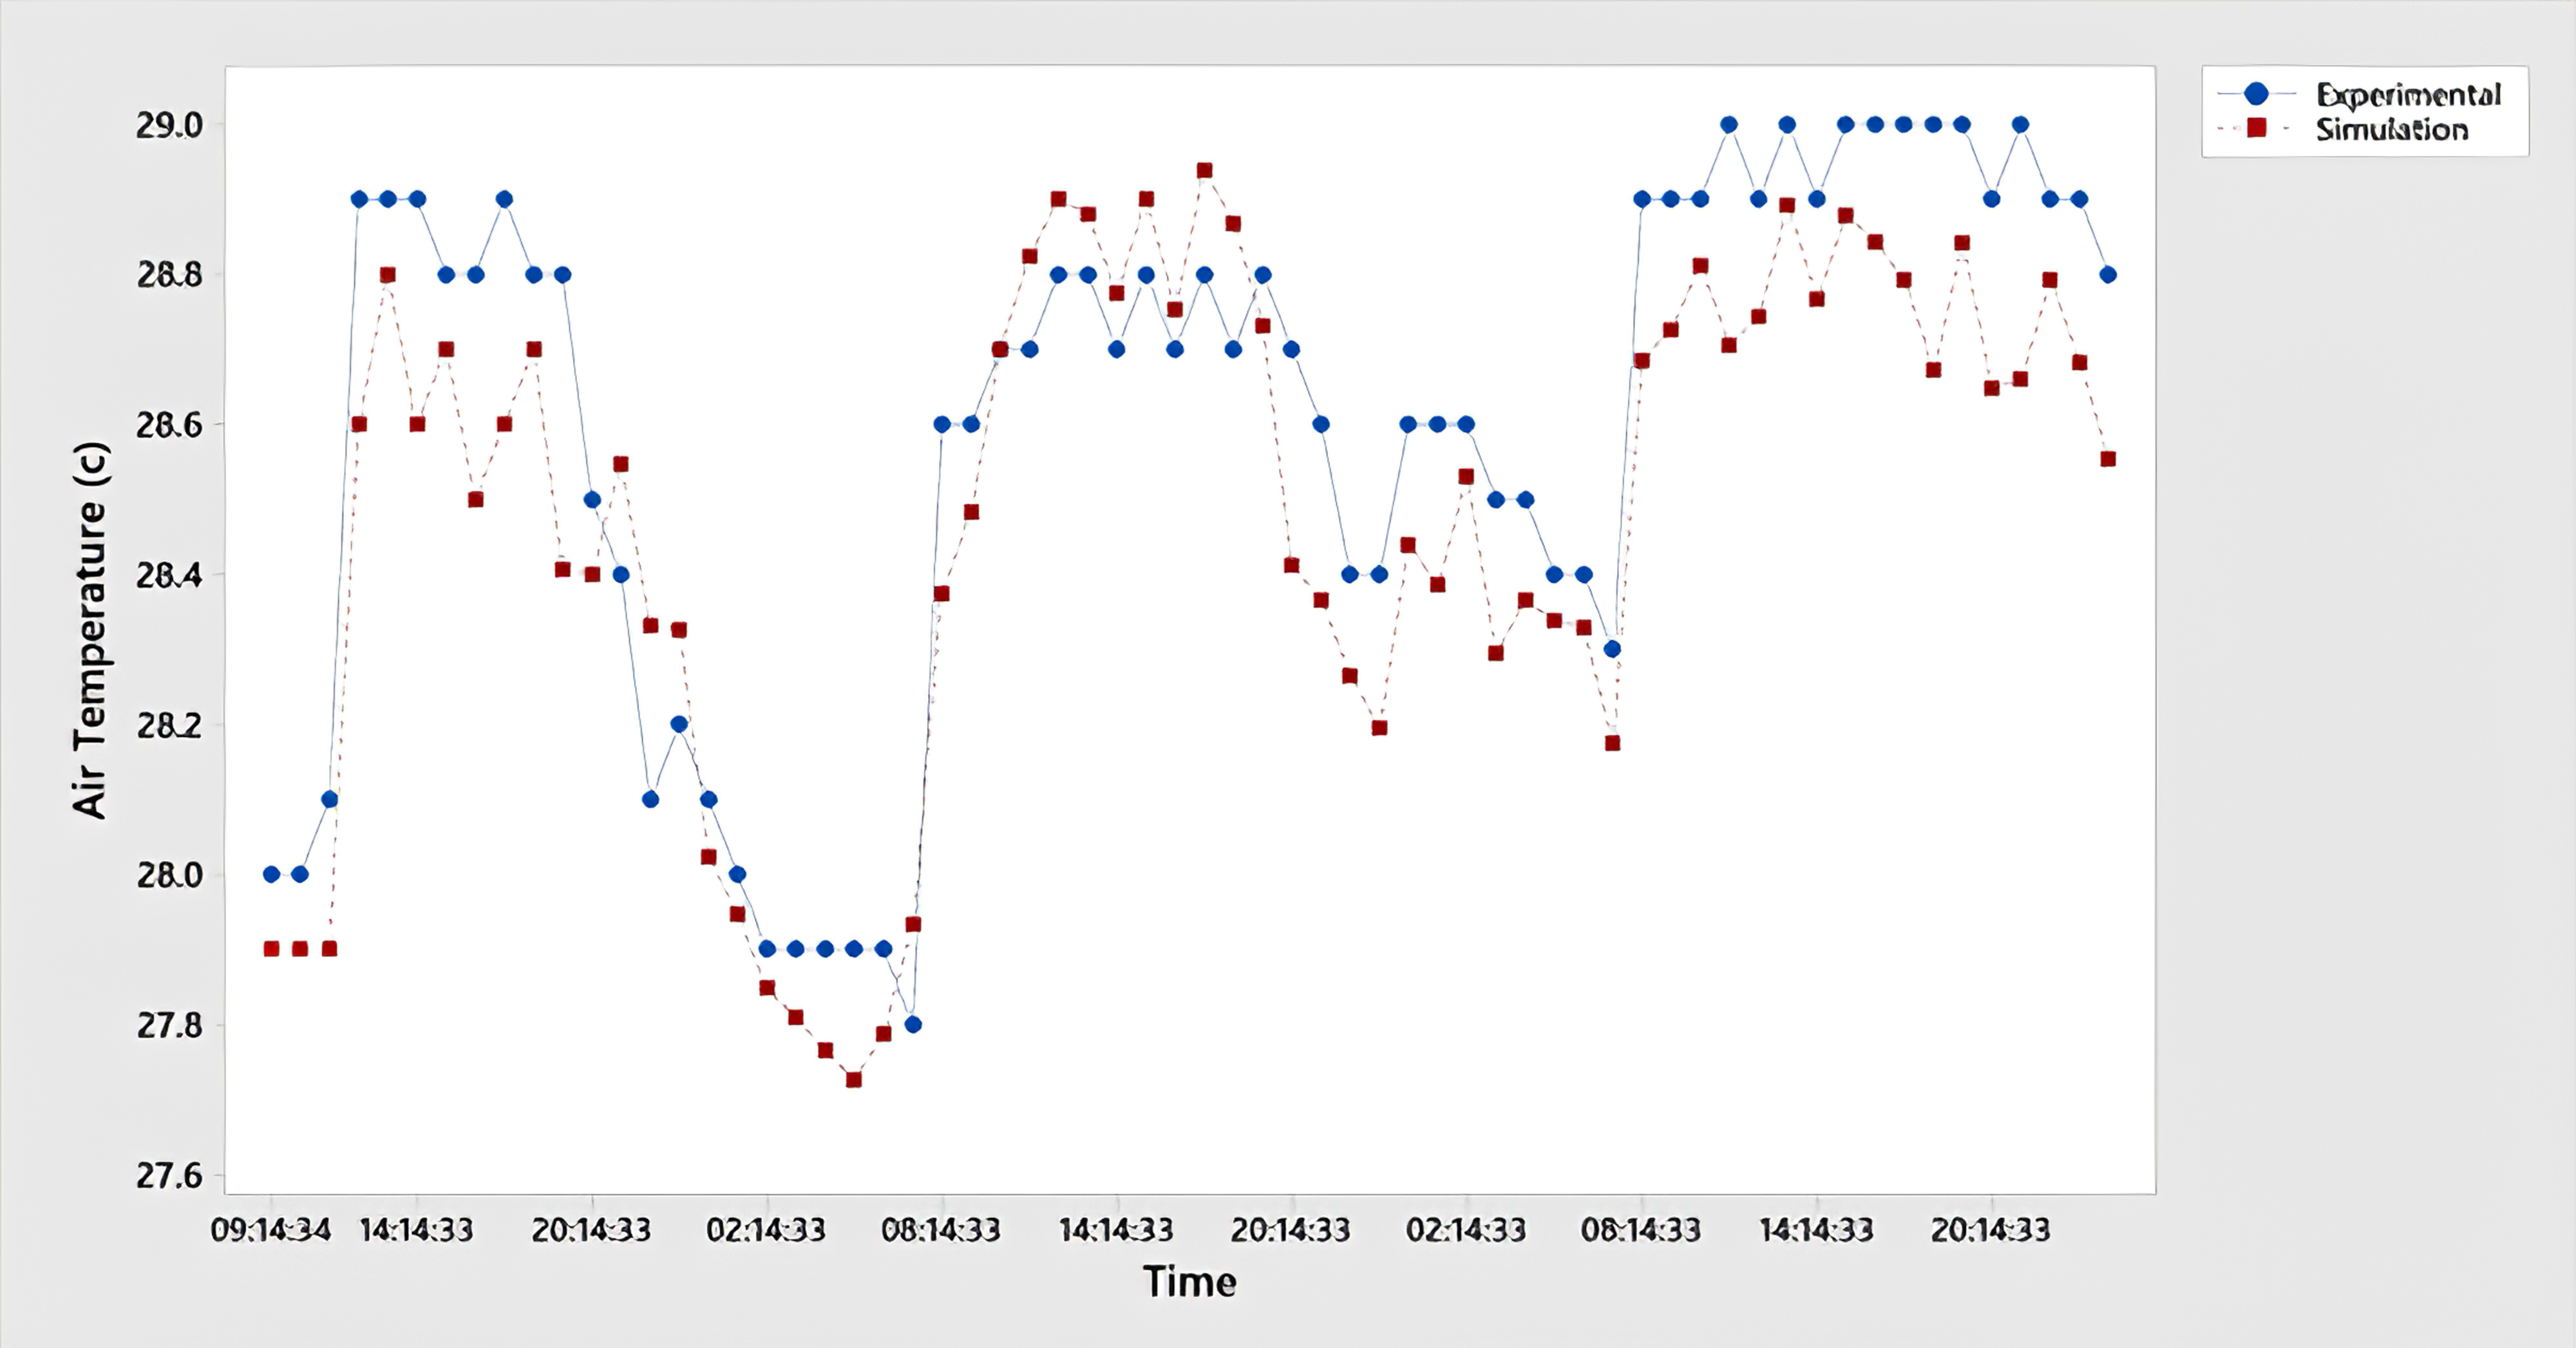
Fig. 6. Compared the results of the simulated and measured indoor air temperature.
Figure 7
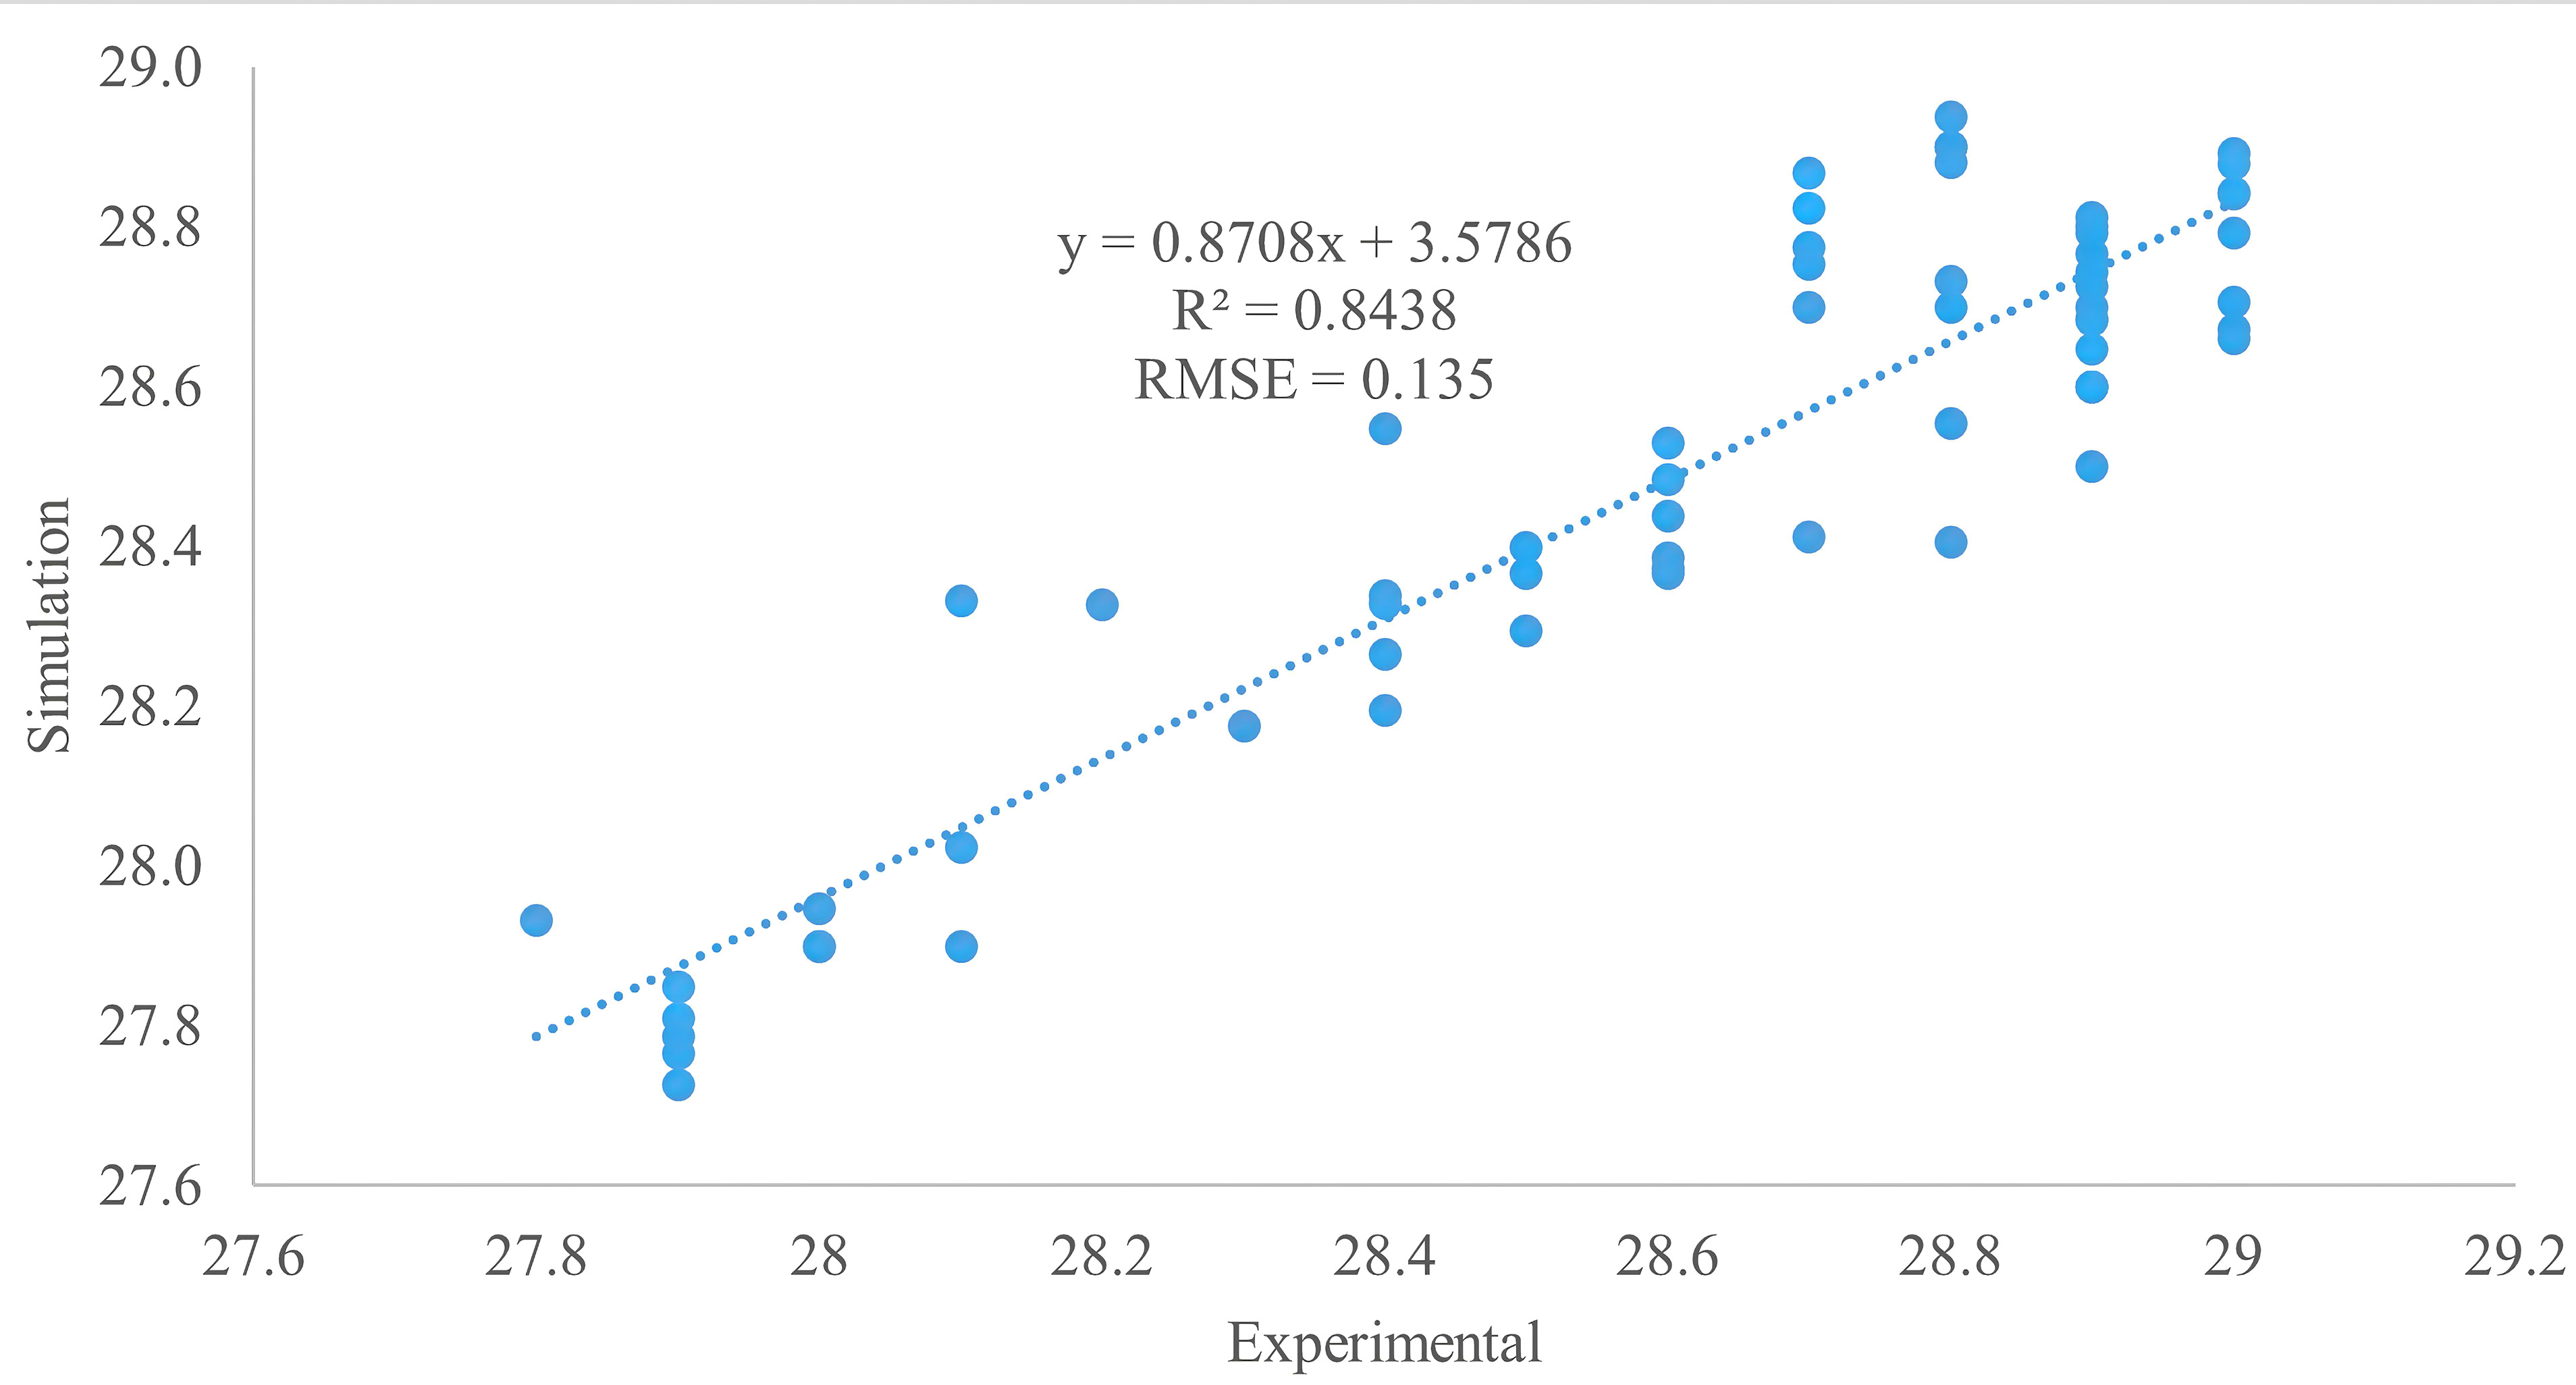
Fig. 7. Statistical analysis of the results of the simulated and measured indoor air temperature.
4.2. Optimization results
After the simulation model had been verified, it was utilised to assess the performance of the reference case UGES over the course of a year, taking into account thermal comfort and energy efficiency. All the variables of the parameters are input into EnergyPlus for calculation to ensure the correctness and dependability of the interior air temperature for thermal comfort and energy performance for cooling calculations. Thermal and energy optimizations in DesignBuilder based on EnergyPlus run through several steps to evaluate potential solutions from Pareto front as mentioned. Table 4 reports the values of the parameters employed for the optimization. The parameters were chosen based on common values in the literature [43-46]. The optimization process is separated into two sections, as stated in the approach. As a consequence, the findings are divided into two sections, as mentioned below.
Table 4

Table 4. Optimization parameters setup in DesignBuilder.
4.2.1. First optimization scenario results
According to the optimization scenarios, the design of the underground space design is optimized based on two related variables: in terms of soil and building envelope. Design and optimization provide numerous design options for UGES characteristics that were previously discussed in section 3.1. As mentioned above, the optimization processes were carried out under two optimization scenarios. A first optimization was set-up, using the 29 design cases described in Table 1 resulted from five design parameters. And all variables were tested against the indoor air temperature as a single objective, then the EUI was calculated. In this step of process of optimization, the best variables of both soil and envelope design must be determined first to improve the quality of the energy model and determine the optimal variables that have large effects on optimization objectives to reduce the large number of variables and reduce time of optimization. For this goal, a SA has been applied. SA was performed to understand the effect of every design variable autonomous in the indoor thermal comfort. To thoroughly evaluate the link between variables and design objectives, the range of values of each variable has been modified and optimised separately, while all other variables have remained untouched. In other words, one of the design parameters is changeable, while the others are fixed. The impact of each optimization variable on the optimization objective may be determined using the SA findings. As a result, in the final optimization, the optimization variables that have minimal impact on the optimization target can be omitted as appropriate. Optimization from scenarios B to F (see Table 2) were used in this stage. As shown in Figs. 8-12, the Tia results of the optimization scenarios B to F. The figures showed that the optimization variables related to the soil thickness, room height, and U-Value of the roof (V1~V5, V6~V12, and V24~V29) showed that these variables have no effect on the Tia when compared to each other’s. Therefore, these variables will be excluded in the final optimization process (scenario G). Meanwhile, the wall thickness and U-Value of the external wall (V13~V17, and V18~V24) have a significant impact on Tia.
After determining the most significant variables, the regression analysis has been applied, and each independent variable (optimization variable) and dependent variable (optimization goal) is handled independently by using the SCV and RMSE methods, to thoroughly investigate the link between the variables and the design objectives. The results of the statistical SCV and RMSE of the SA are shown in Table 5. The SCV of the optimization variables related to the external wall thickness (V13~V17) and the U-Value of the external wall variables (V18~V23) for the two optimization objectives are between 0.05 to 0.1. For RMSE results, the minimum and maximum of Tia are 0.020 and 0.031 and EUI are 0.508 and 0.583 respectively, for the thickness of external wall design variables. For U-Value of the external wall, the minimum and maximum of RMSE of Tia are 0.009 and 0.038 and EUI are 0.350 and 0.678 respectively. Among the optimization variables related to wall thickness and U-Value of external wall performance parameters, the 50 cm thickness of external wall (V17), and the U-Value of external wall (V23) have a greatest impact on Tia, and its SCV and RSME values are 0.048 and 0.020 respectively (V17), and 0.056 and 0.009 respectively (V23). While for EUI, the variables V13 and V18 for wall thickness and U-value respectively have the greatest impact, and its SCV and RSME values are 0.094 and 0.508 respectively (V13), and 0.084 and 0.350 respectively (V18). In general, the impact results of the optimization variables on Tia and EUI have the same trend, and contradictions exist. For example, decreasing the wall thickness of the external wall can improve the Tia but also increase the EUI for underground spaces, and vice versa. Low U-value of external wall can get the best results for EUI but increase Tia.
Table 5
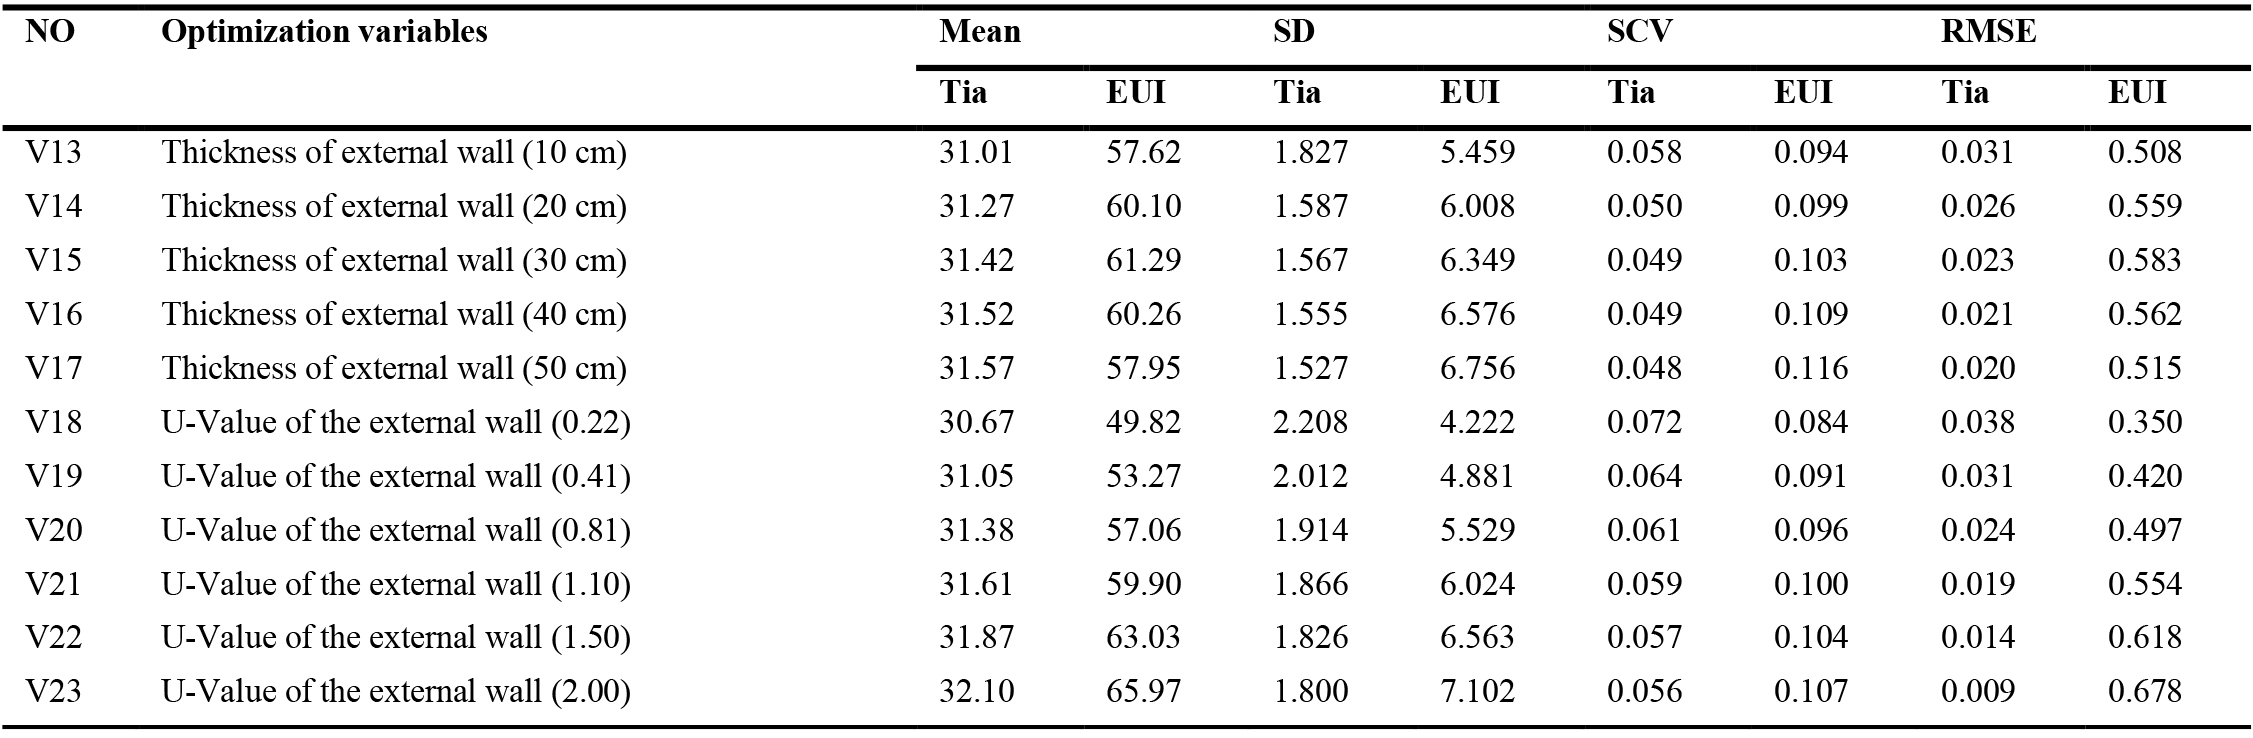
Table 5. Optimization parameters setup in DesignBuilder.
Figure 8
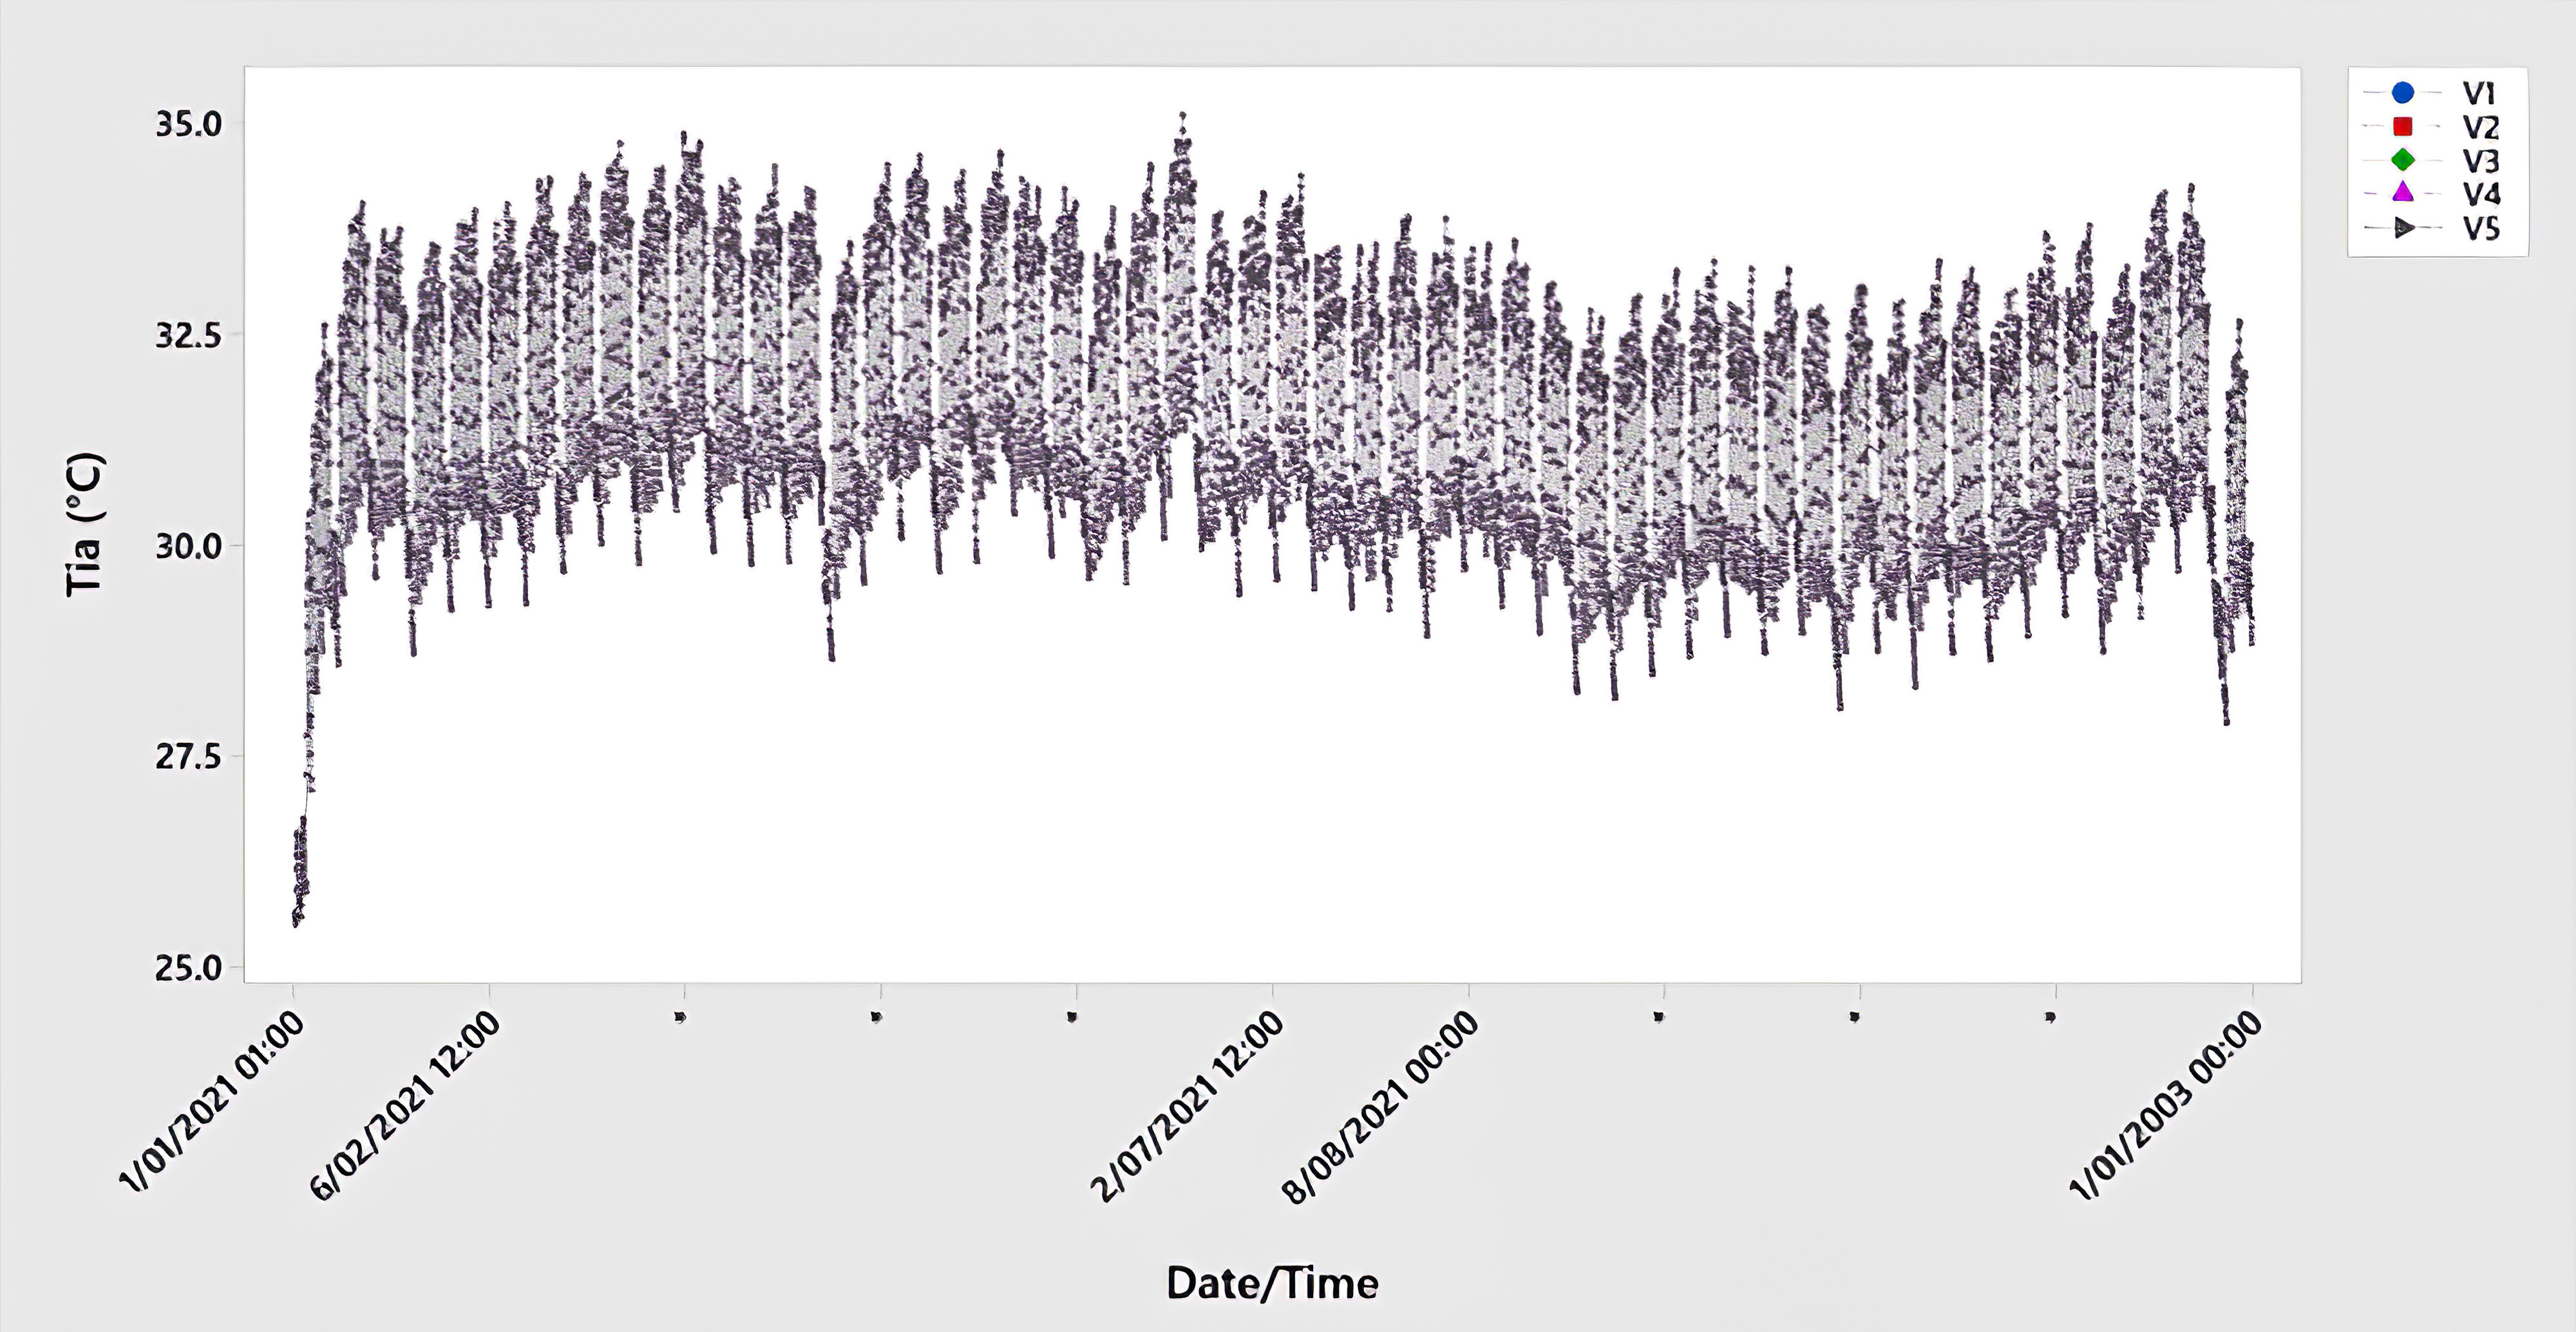
Fig. 8. The yearly comparison of the indoor air temperatures of the soil thickness variables.
Figure 9
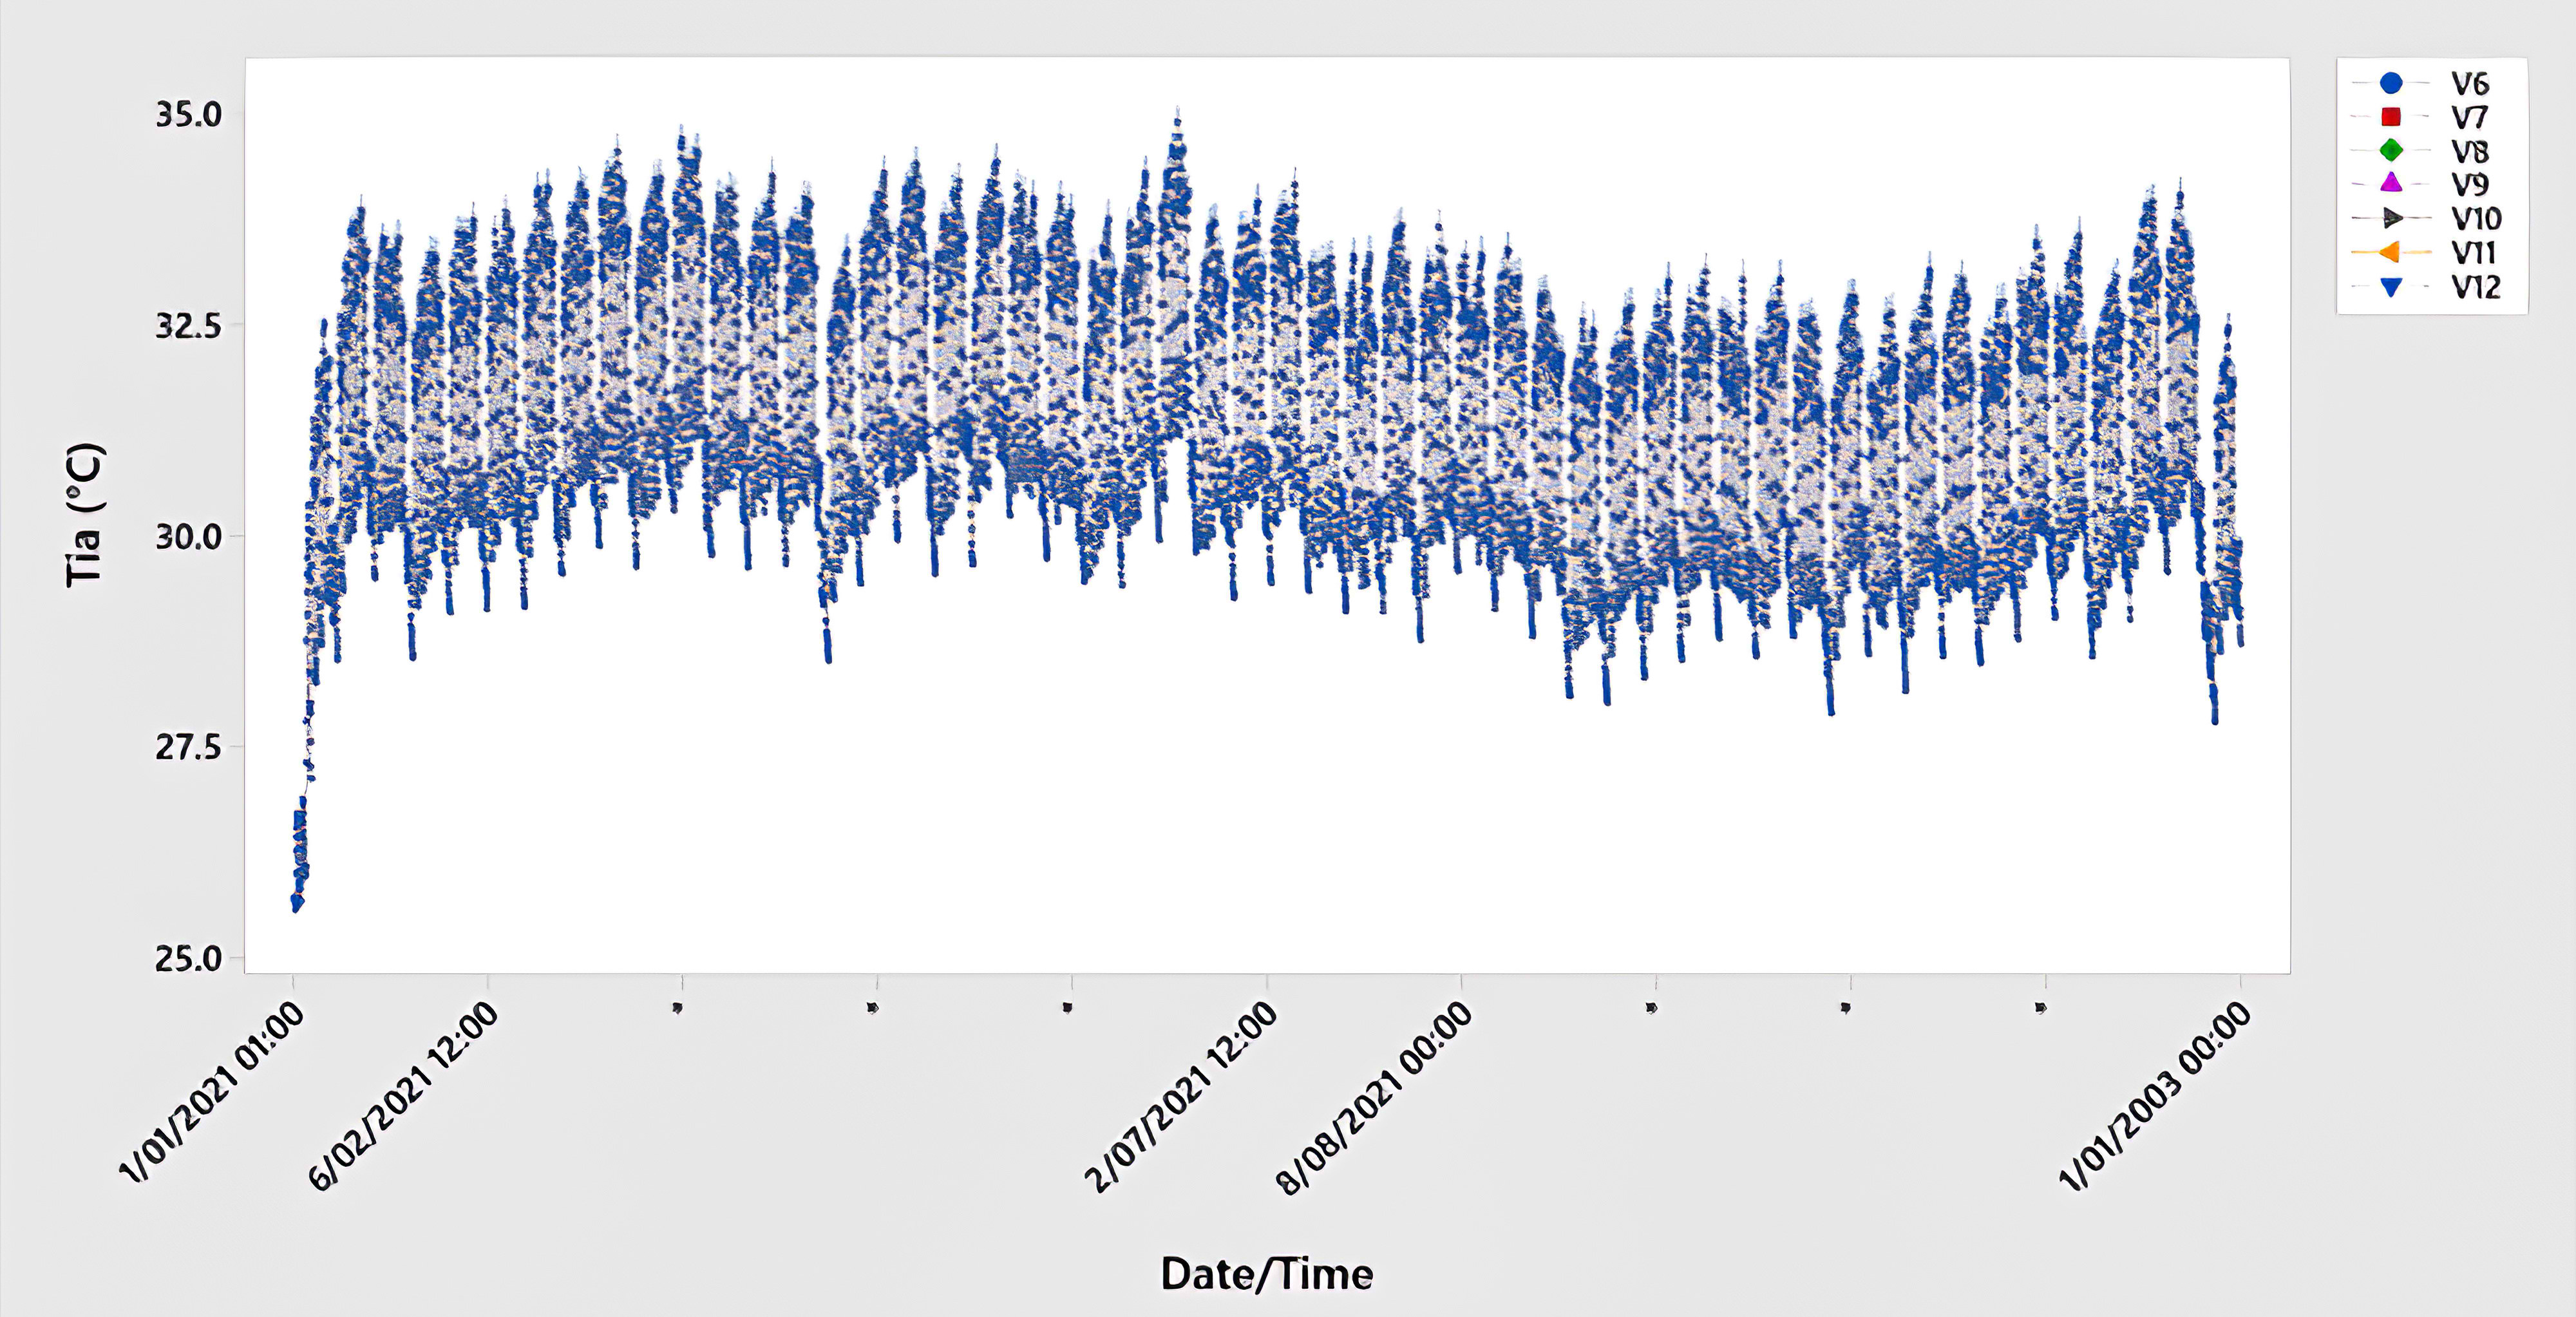
Fig. 9. The yearly comparison of the indoor air temperatures of the space height variables.
Figure 10
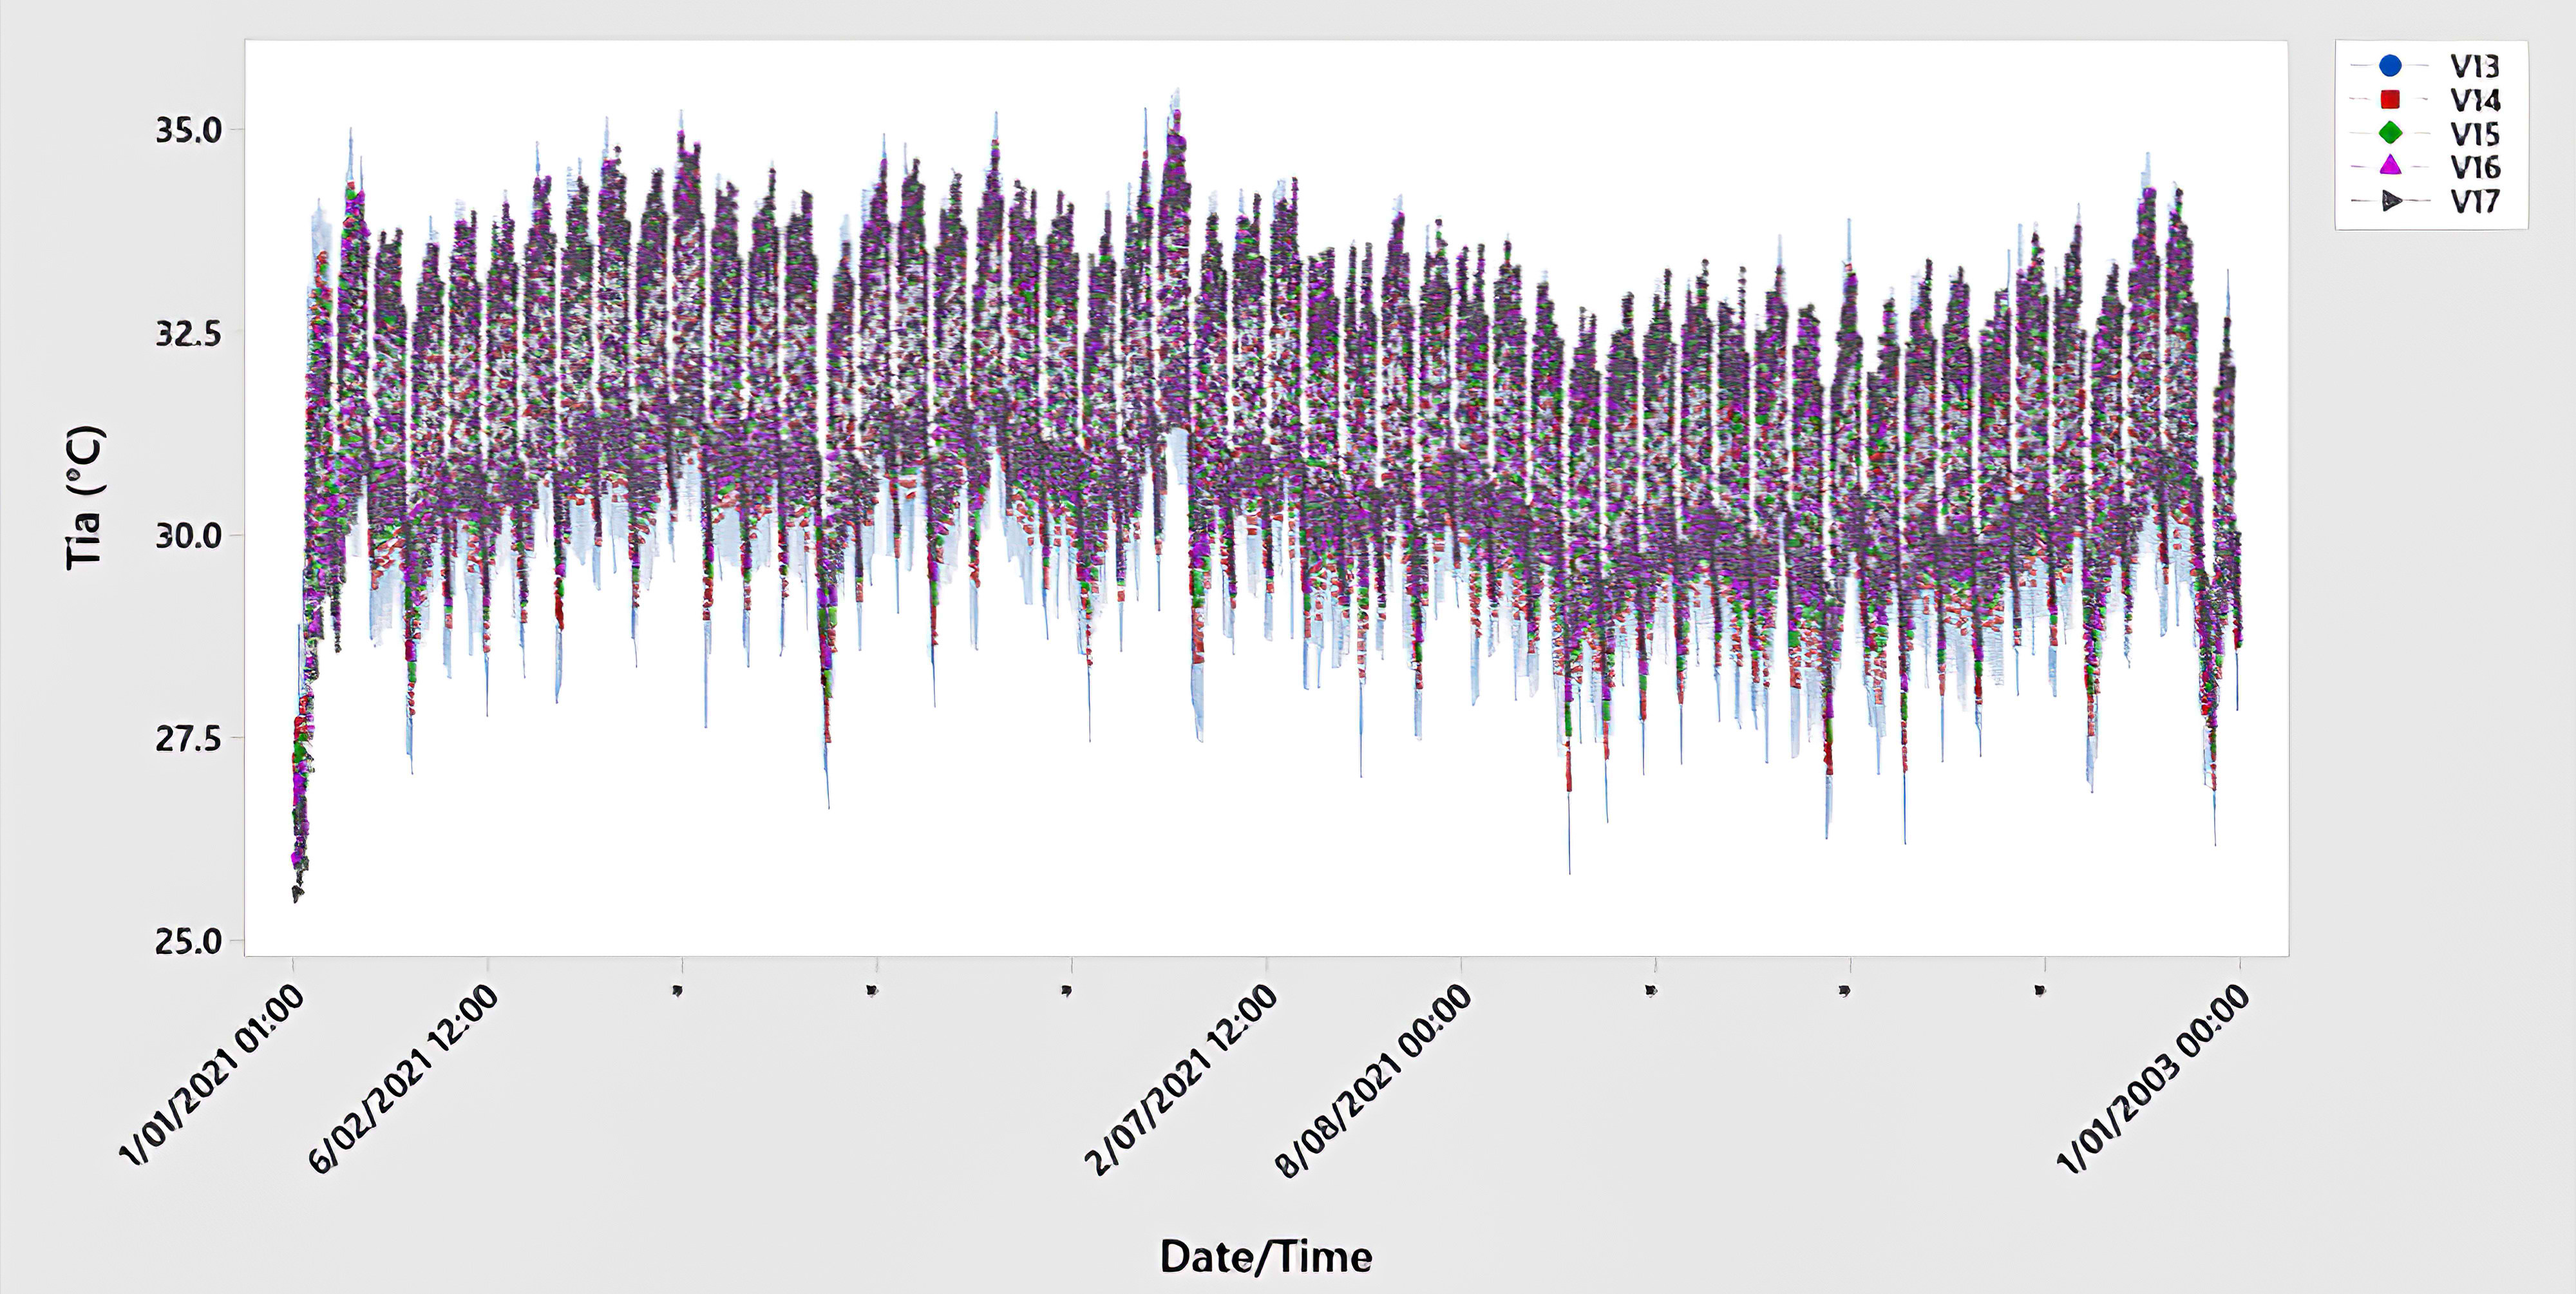
Fig. 10. The yearly comparison of the indoor air temperatures of the external wall thickness variables.
Figure 11
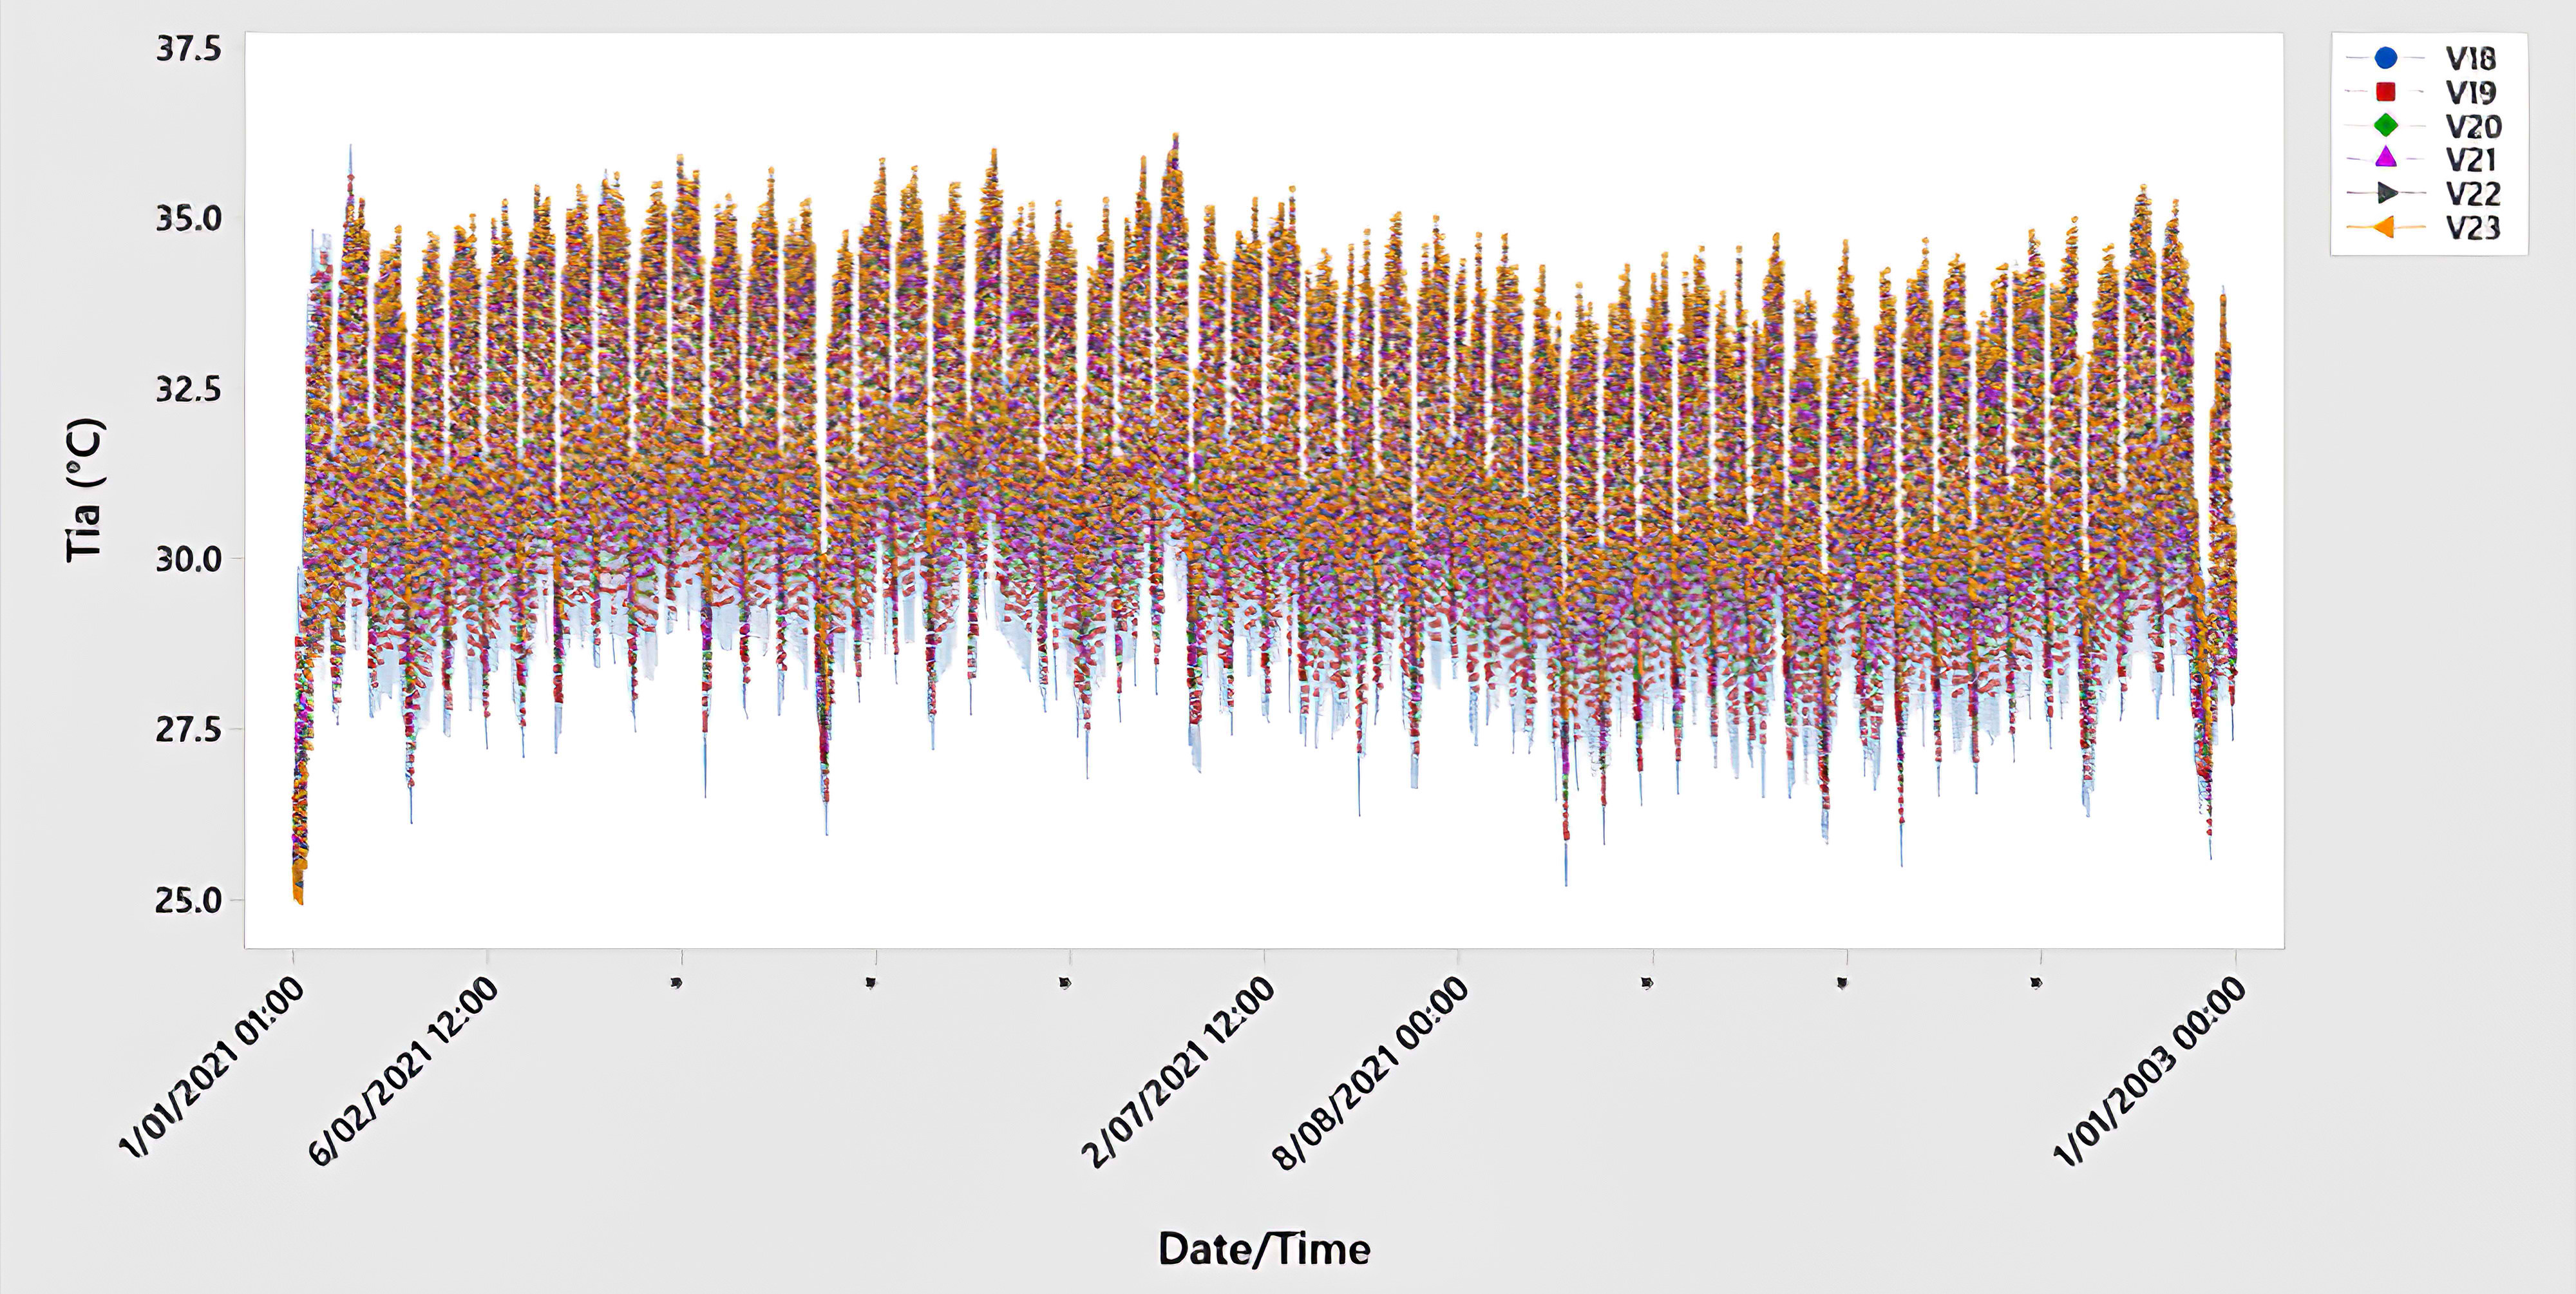
Fig. 11. The yearly comparison of the indoor air temperatures of the u-value of external variables.
Figure 12
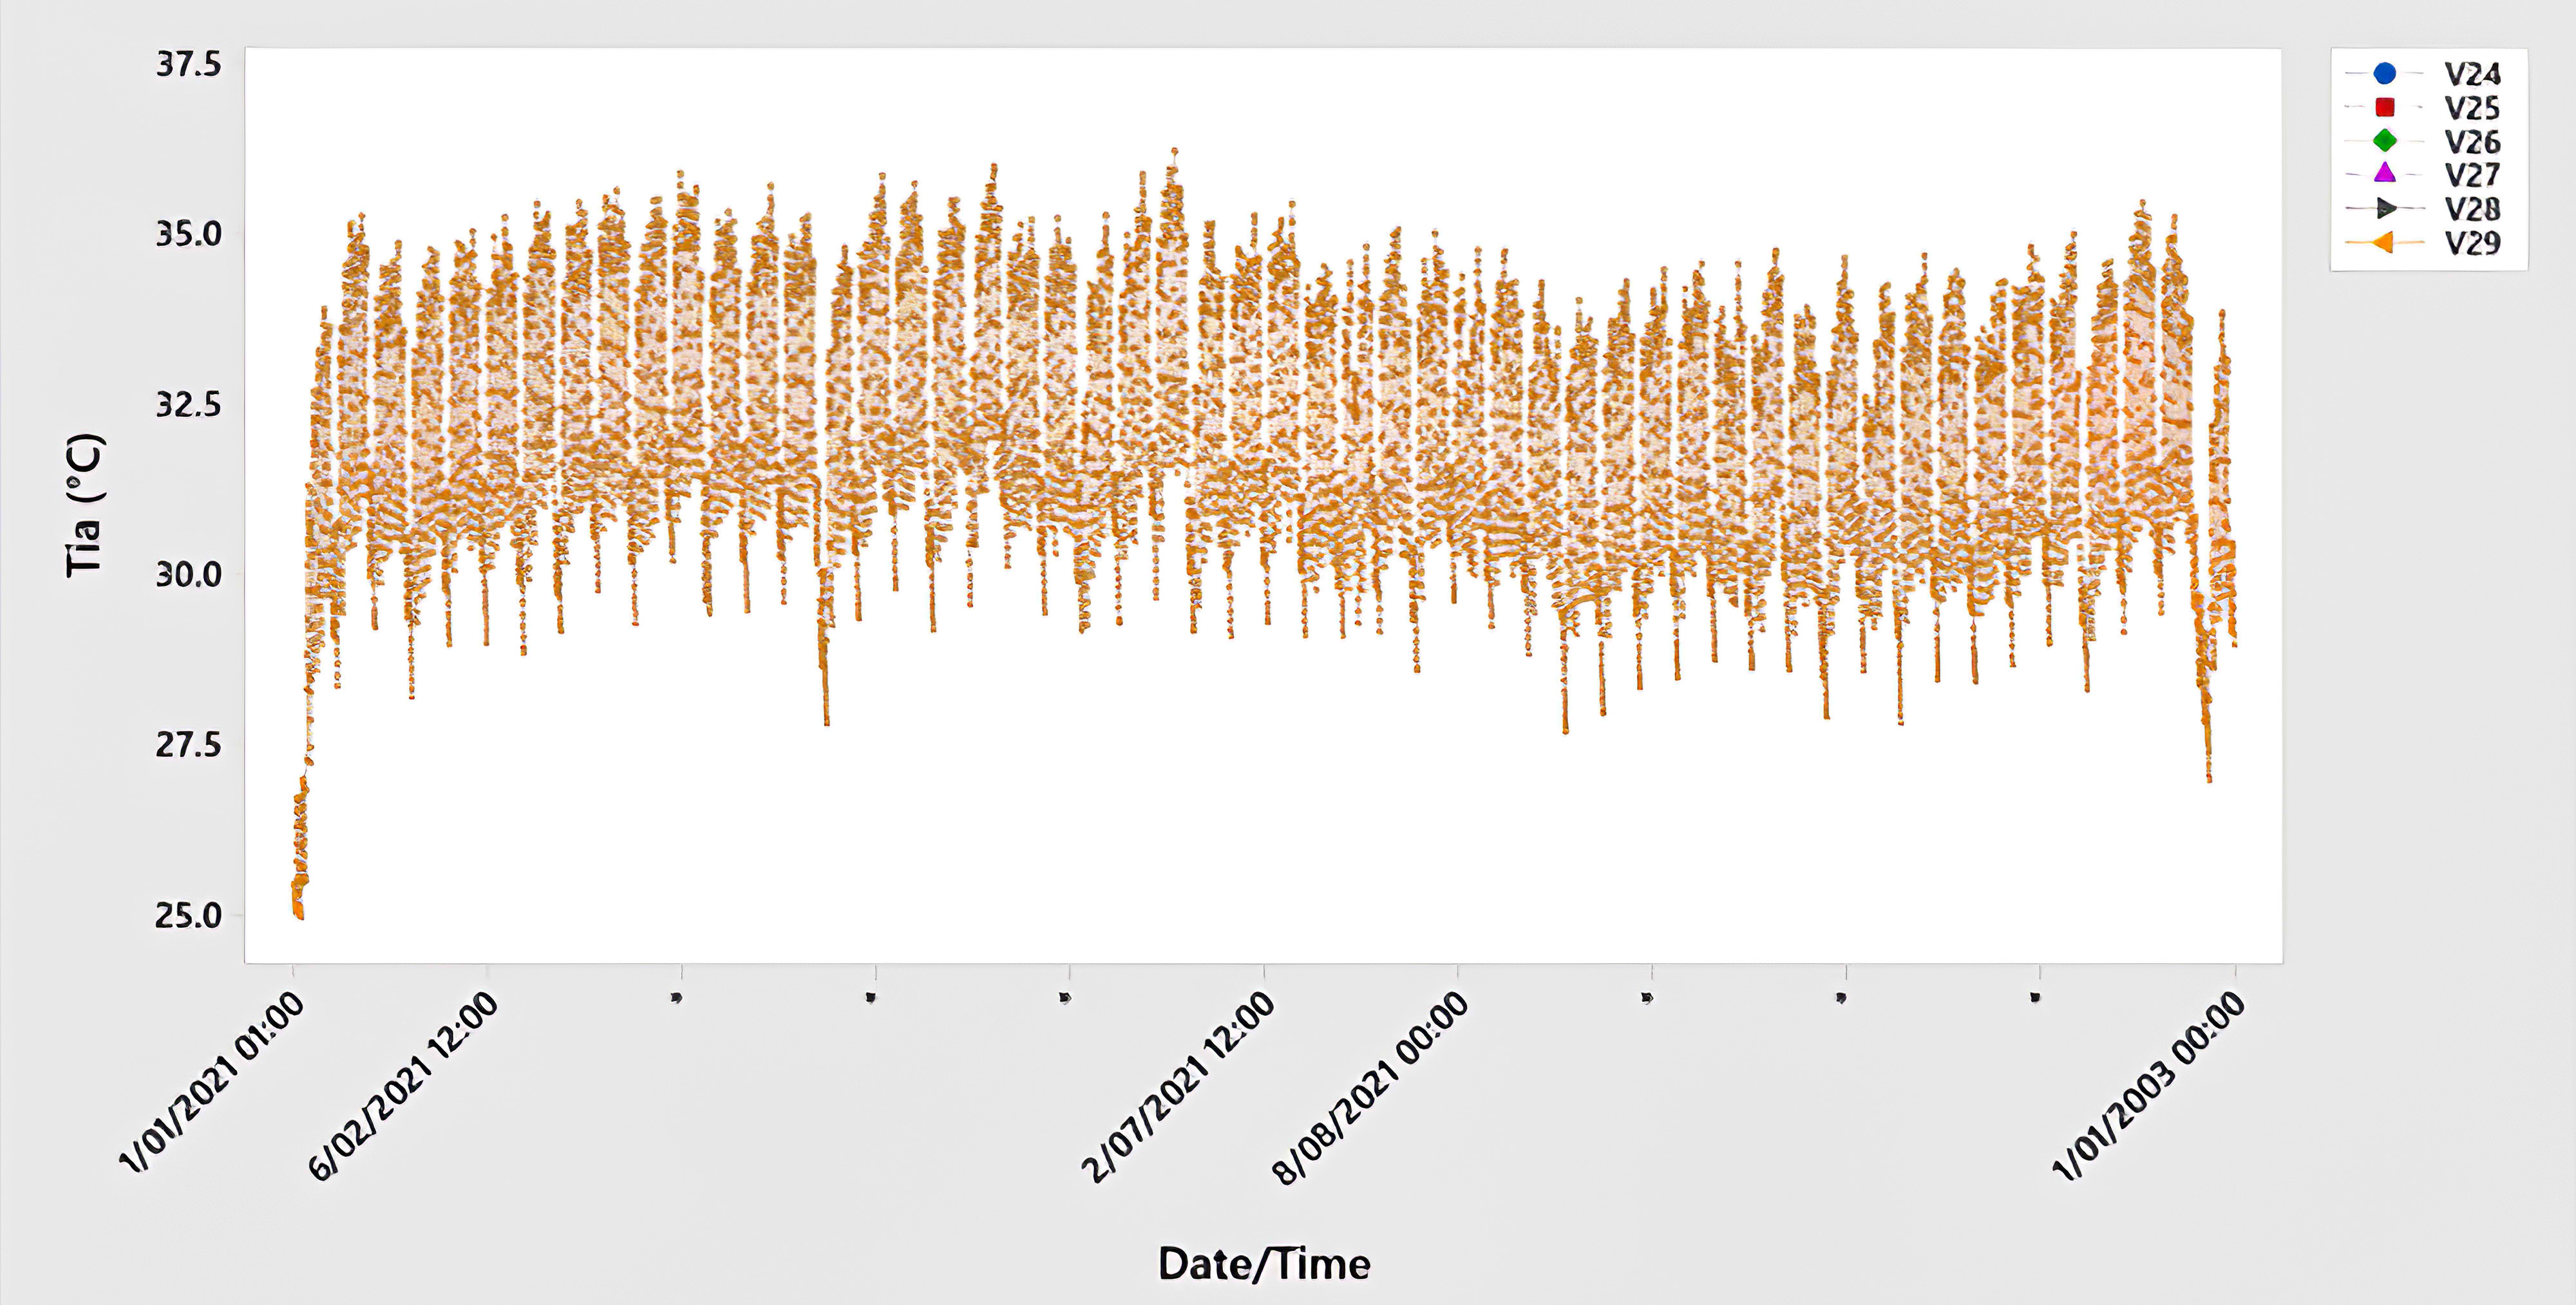
Fig. 12. The yearly comparison of the indoor air temperatures of the u-value of roof variables.
4.2.2. Second optimization scenario results
After determining the best variables that have a large effect on the design objectives, and non-influential variables were excluded through the SA to reduce the number of variables and minimized the optimization time in the first step of optimization, the second optimization was run using MOPM to determine the optimal variables that yields excellent performance in thermal comfort and energy performance metrics. The MOPM was set-up, using the best two design variables (wall thickness V13 toV17; and wall U-value V18 to V23) resulted from first optimization and SA (table). Each variable was optimized independently. In other words, the wall thickness optimization variables were tested against both objectives in same time first, then wall U-value variables were optimized. The optimization resulted in arranging the set of optimal Pareto Front solutions according to their priority based on best results of both objectives. The best Pareto solution set derived through optimization may be utilised as the ideal design scheme for the UGES parameters, and designers and researchers can pick based on their real demands or preferences. Table 6 lists the precise characteristics of the thermal comfort ideal parameters and the energy performance optimal parameters. The table depicts the configurations of ideal variables for cooling the subterranean area based on the best interior air temperature and energy performance. The main differences in the optimized objectives, the optimal variables for the wall thickness showed slight differences in arrangements based on best results, while in the wall U-value showed the same trend for both optimized objectives. By comparing these values, it can be concluded that by using the applied MOPM method, it is possible to improve the building’s energy performance by decreasing cooling energy demand, while maintaining occupants’ thermal comfort in the acceptable range compared to reference case.
Table 6
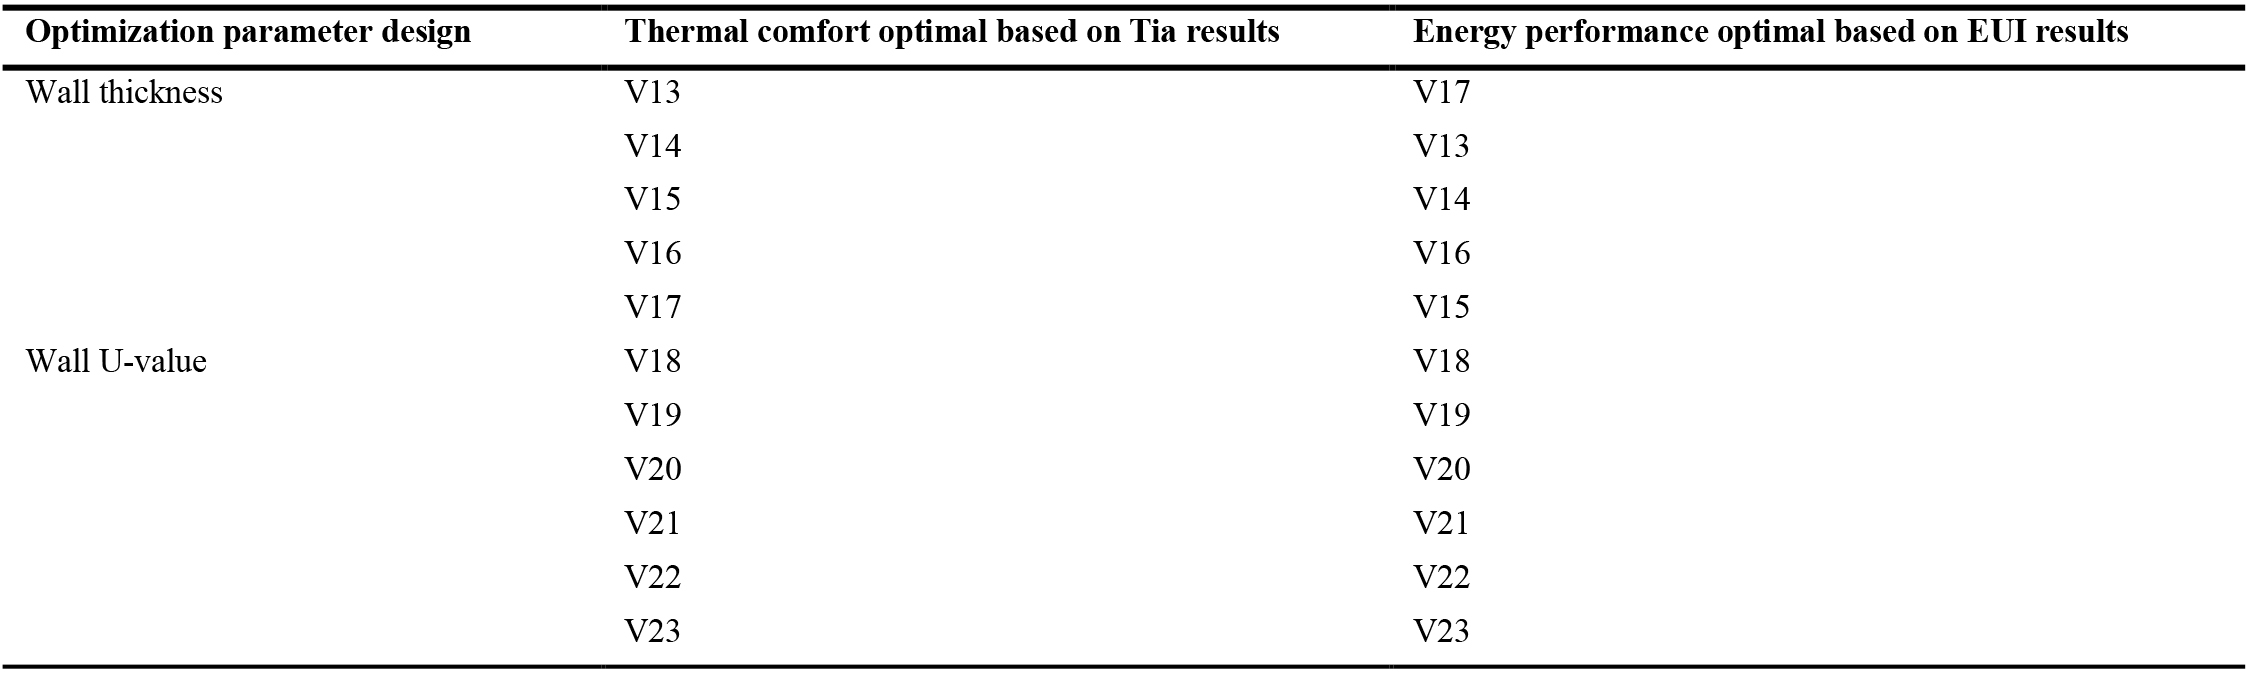
Table 6. Optimal variables of thermal comfort and energy performance.
For optimal wall thickness, there are some inconsistencies in the selection of the optimal variable, because the optimal thermal comfort variable keeps the indoor air temperature within the set point for long hours throughout the months of the year affected by reducing the wall thickness, while for improving the cooling energy performance, the higher wall U-value performed well. For optimal U-value of wall for both optimized objectives, lower value has a great effect to reduce cooling energy and keeping the indoor air temperature within the acceptable set point. Figures 13 and 15 compare the number of hours during which the indoor air temperatures of V13 to V23 variables based on the two parameters design in terms of wall thickness and wall U-value was either 26◦C or higher during the months of the year. It shows that for the first optimal wall thickness (V13), the air temperature is within 26◦C for 1311h, or 14.97% of the total number of hours in the whole year (8760h). While the last optimal wall thickness (V17) is around 272h, or 3.11% of the total number of hours of the air temperature within 26◦C. The first optimal U-value of the wall (V18) shows the air temperature in within 26◦C for 2351h, or 26.84% of the total number of hours in the whole year (8760h). While the last optimal wall thickness (V23) is around 272h, or 3.11% of the total number of hours of the air temperature in within 26◦C. Figures 14 and 16 compare the number of hours of the month during which the cooling energy performance of V13 to V23 variables based on the two parameters design in terms of wall thickness and wall U-value was either 40kwh or 50kwh during the months of the year. It shows that for the first optimal wall thickness (V17), the number of hours with hourly energy performance either 40 or 50kWh accounts for 25.0% of the total number of hours in the whole year (8760h) (Fig. 17). While the last optimal wall thickness (V15) achieved 8.33%. The first optimal U-value of the wall (V18), the cooling energy performance is 58.33% of the total number of hours in the whole year. While the last optimal wall thickness (V23) has no effects to improve cooling energy (Fig. 18). As a conclusion, the optimal wall thickness variables perform better in terms of thermal indoor air comfort, while the U-values of the wall is the scenarios of indoor air comfort and energy performance which consumes the least amount of cooling energy.
Figure 13
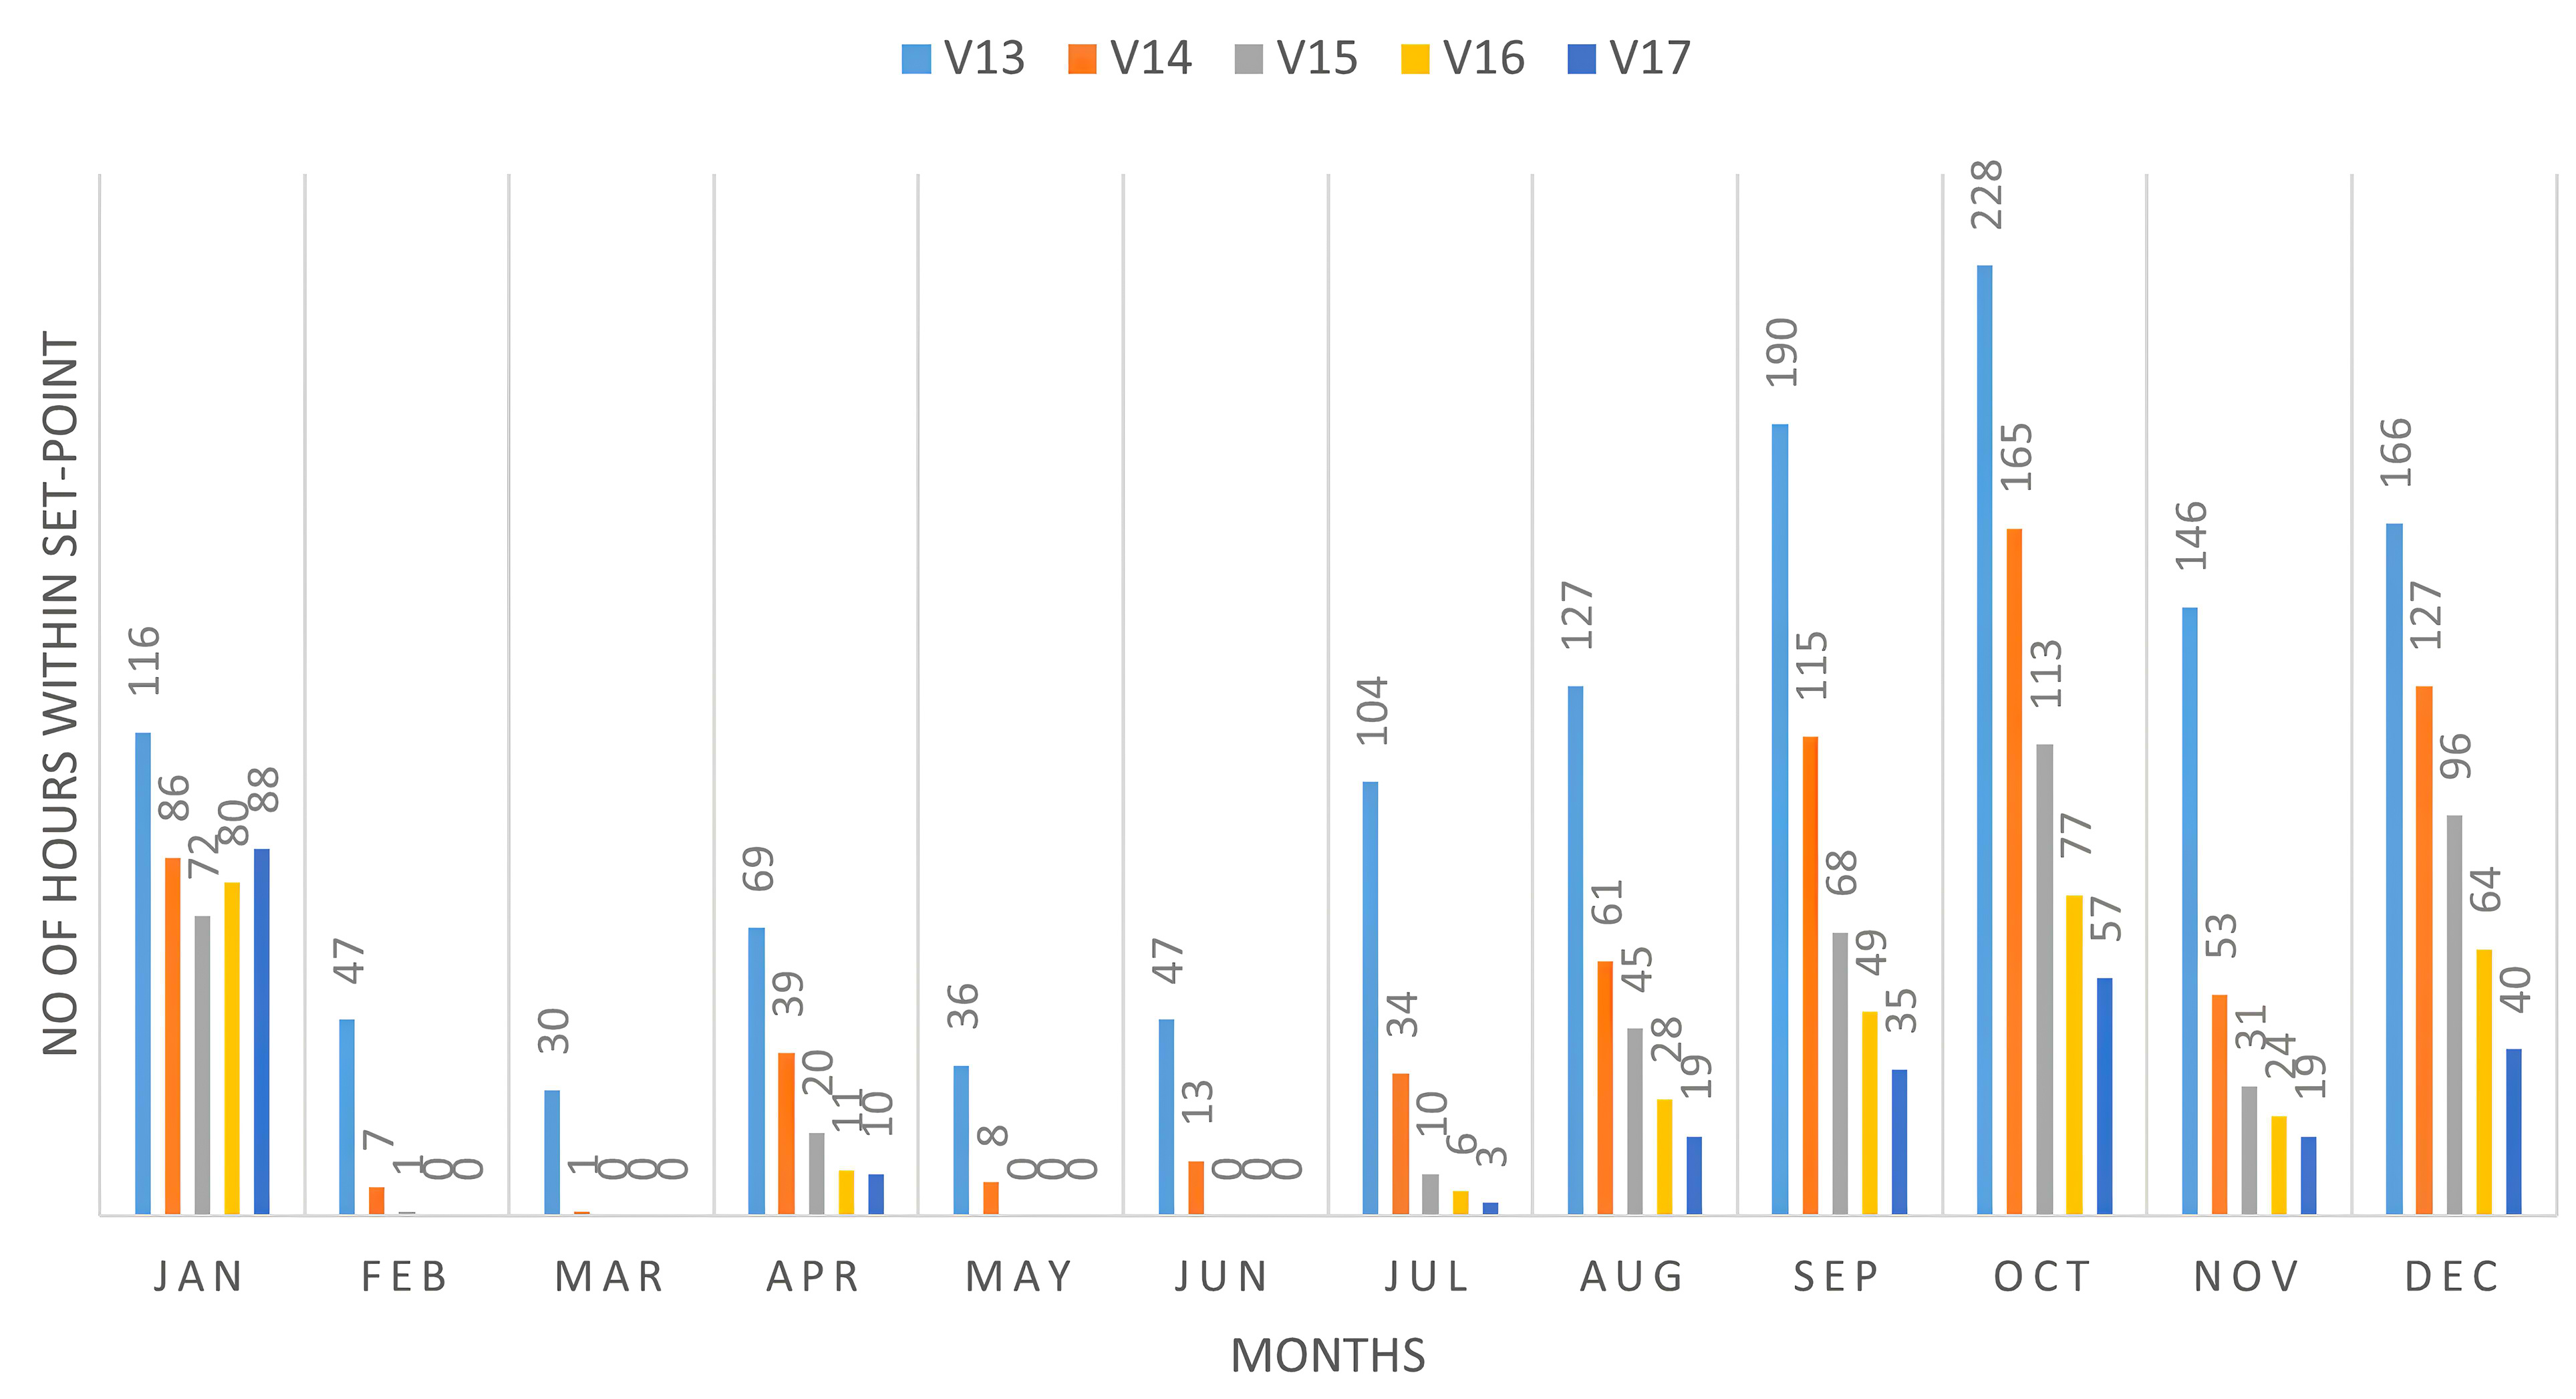
Fig. 13. Comparison of monthly hours of thermal comfort of Tia for all wall thickness optimization variables (V13 to V17).
Figure 14
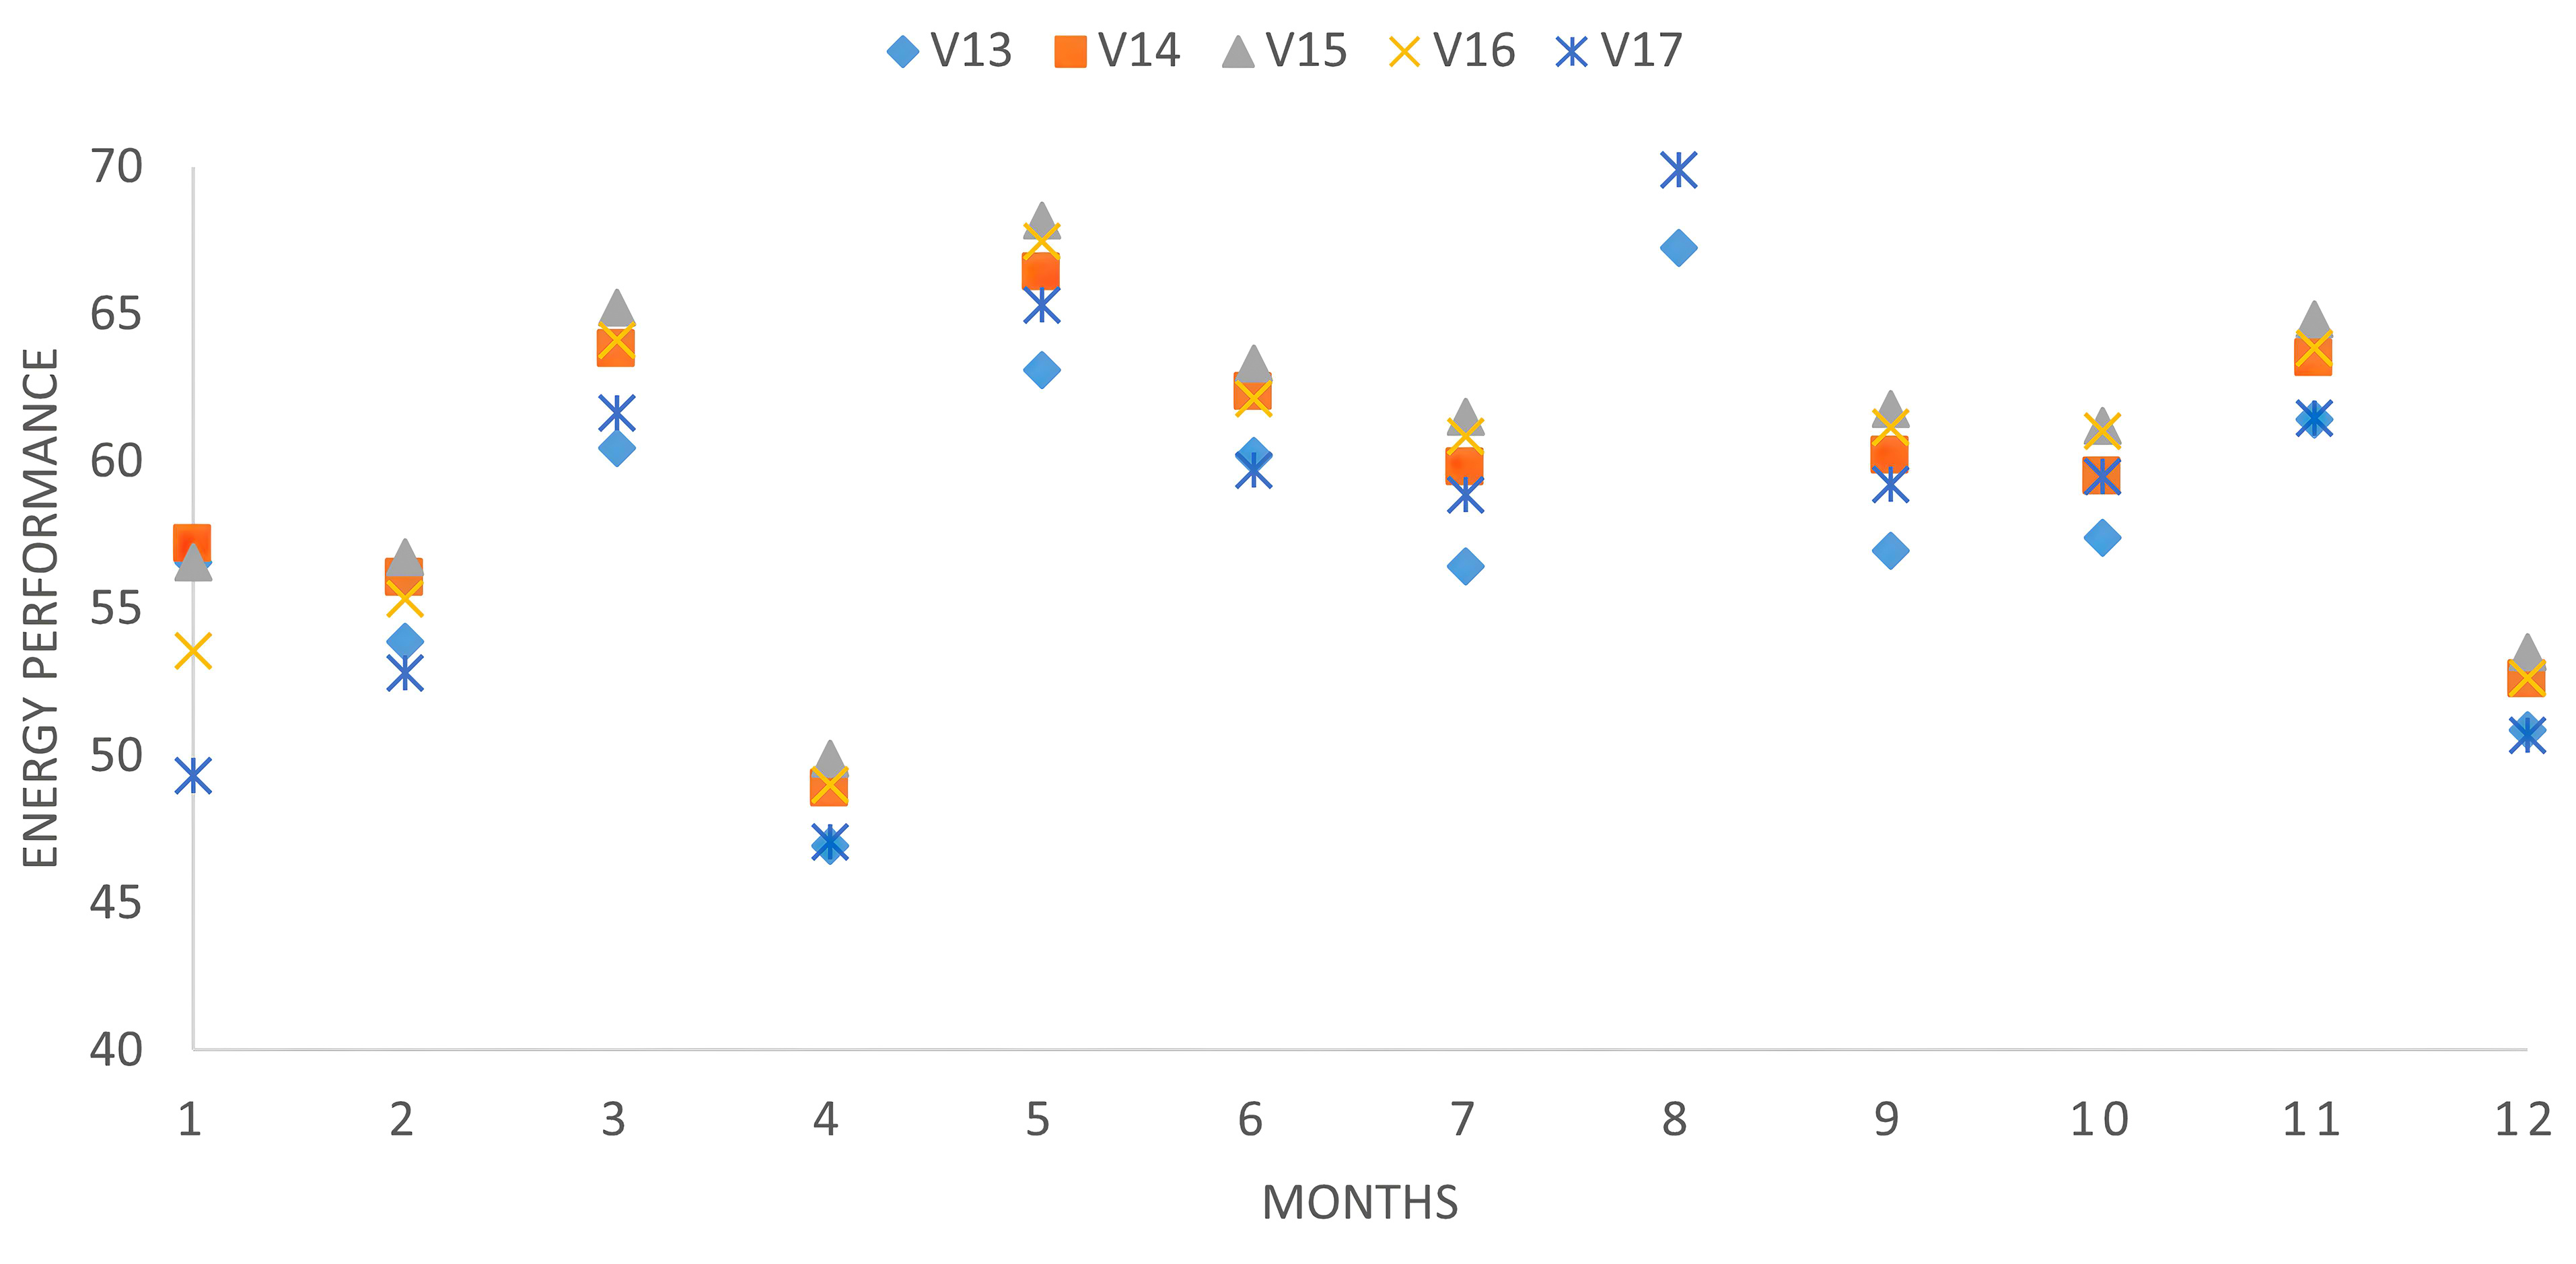
Fig. 14. Comparison of simulated monthly energy cooling demand (kWh) for all wall thickness optimization variables (V13 to V17).
Figure 15
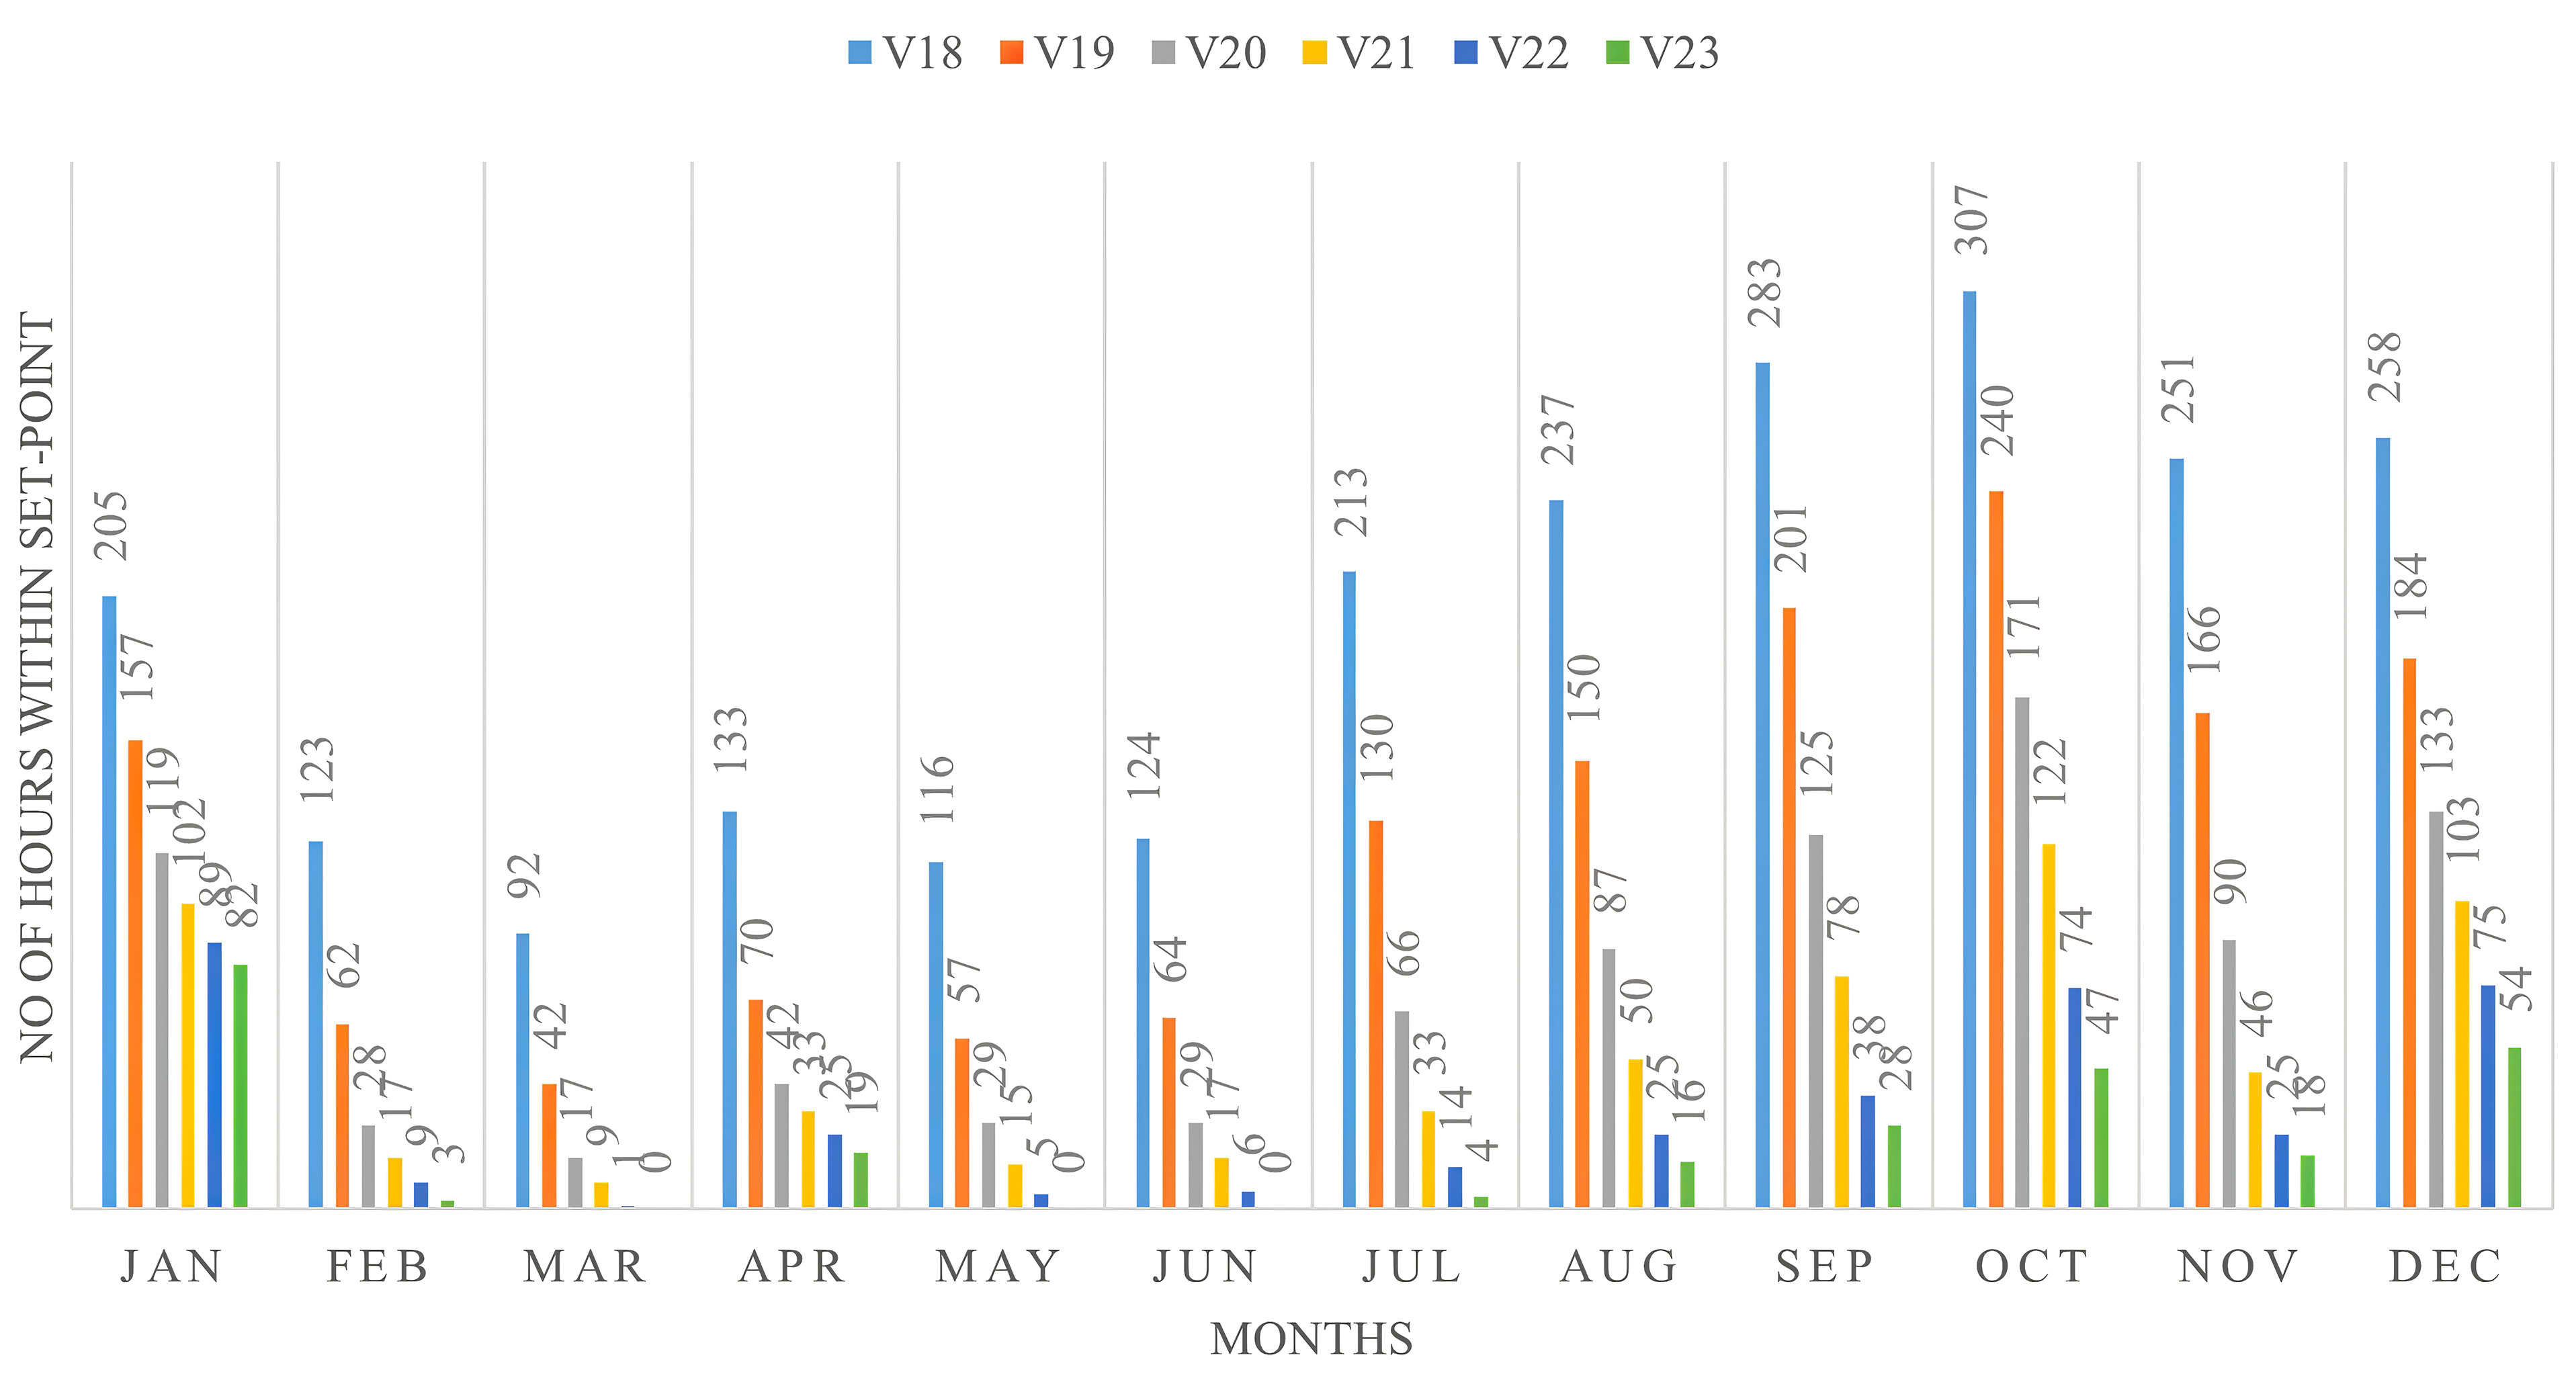
Fig. 15. Comparison of monthly hours of thermal comfort of Tia for all wall U-value optimization variables (V18 to V23).
Figure 16
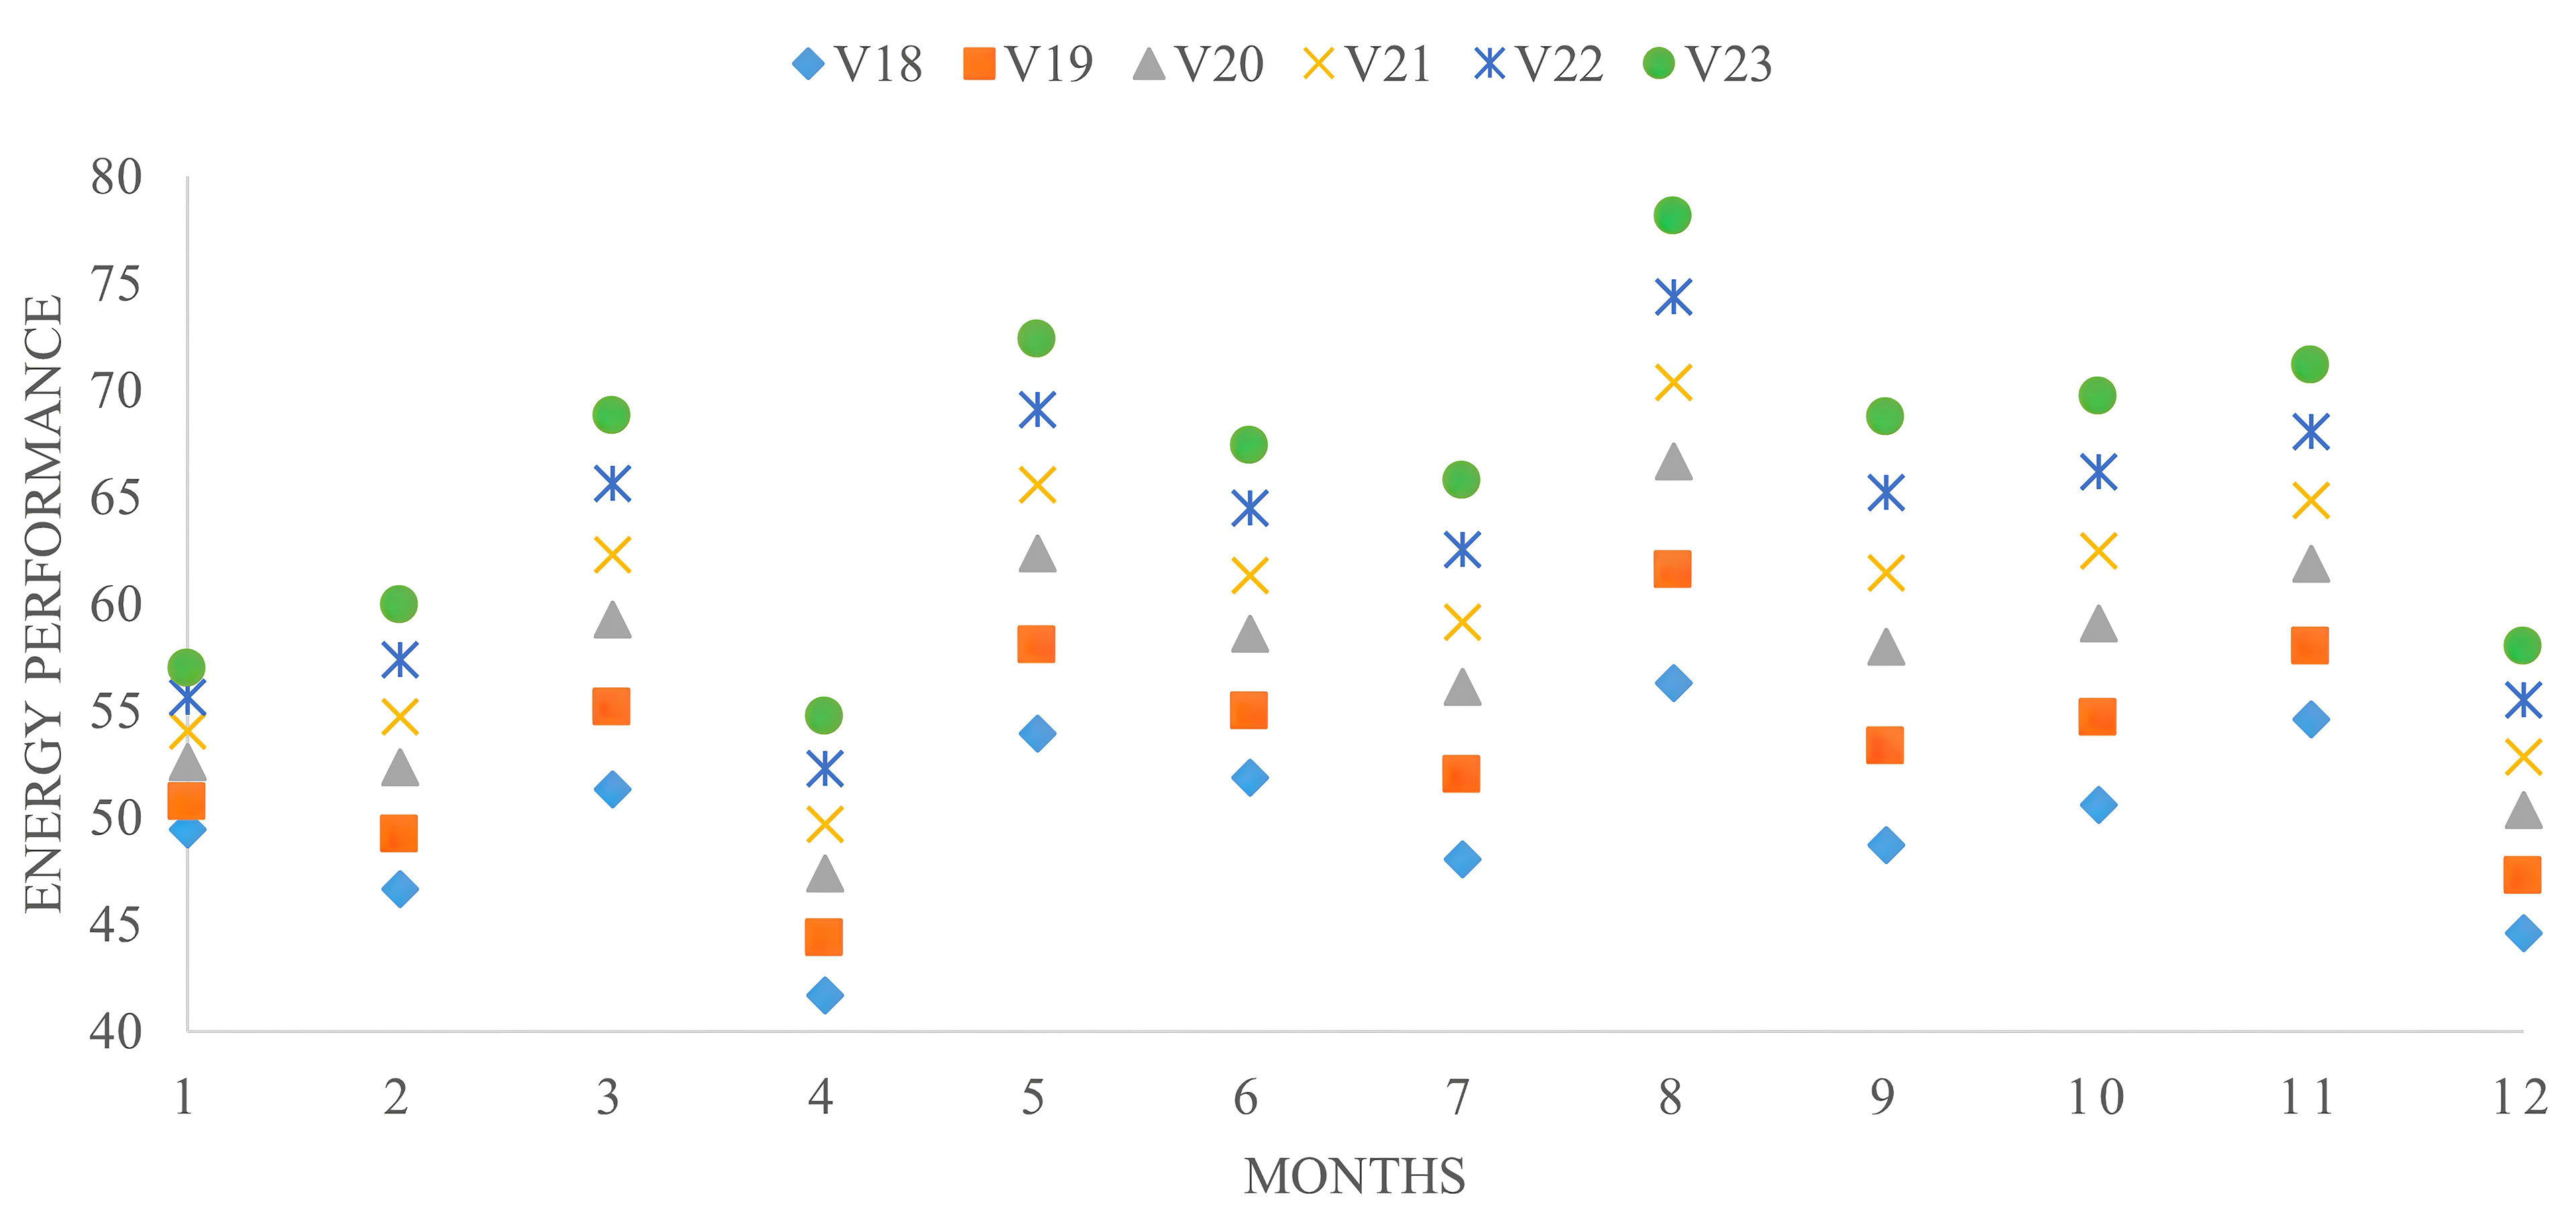
Fig. 16. Comparison of simulated monthly energy cooling demand (kWh) for all wall U-value optimization variables (V18 to V23).
Figure 17
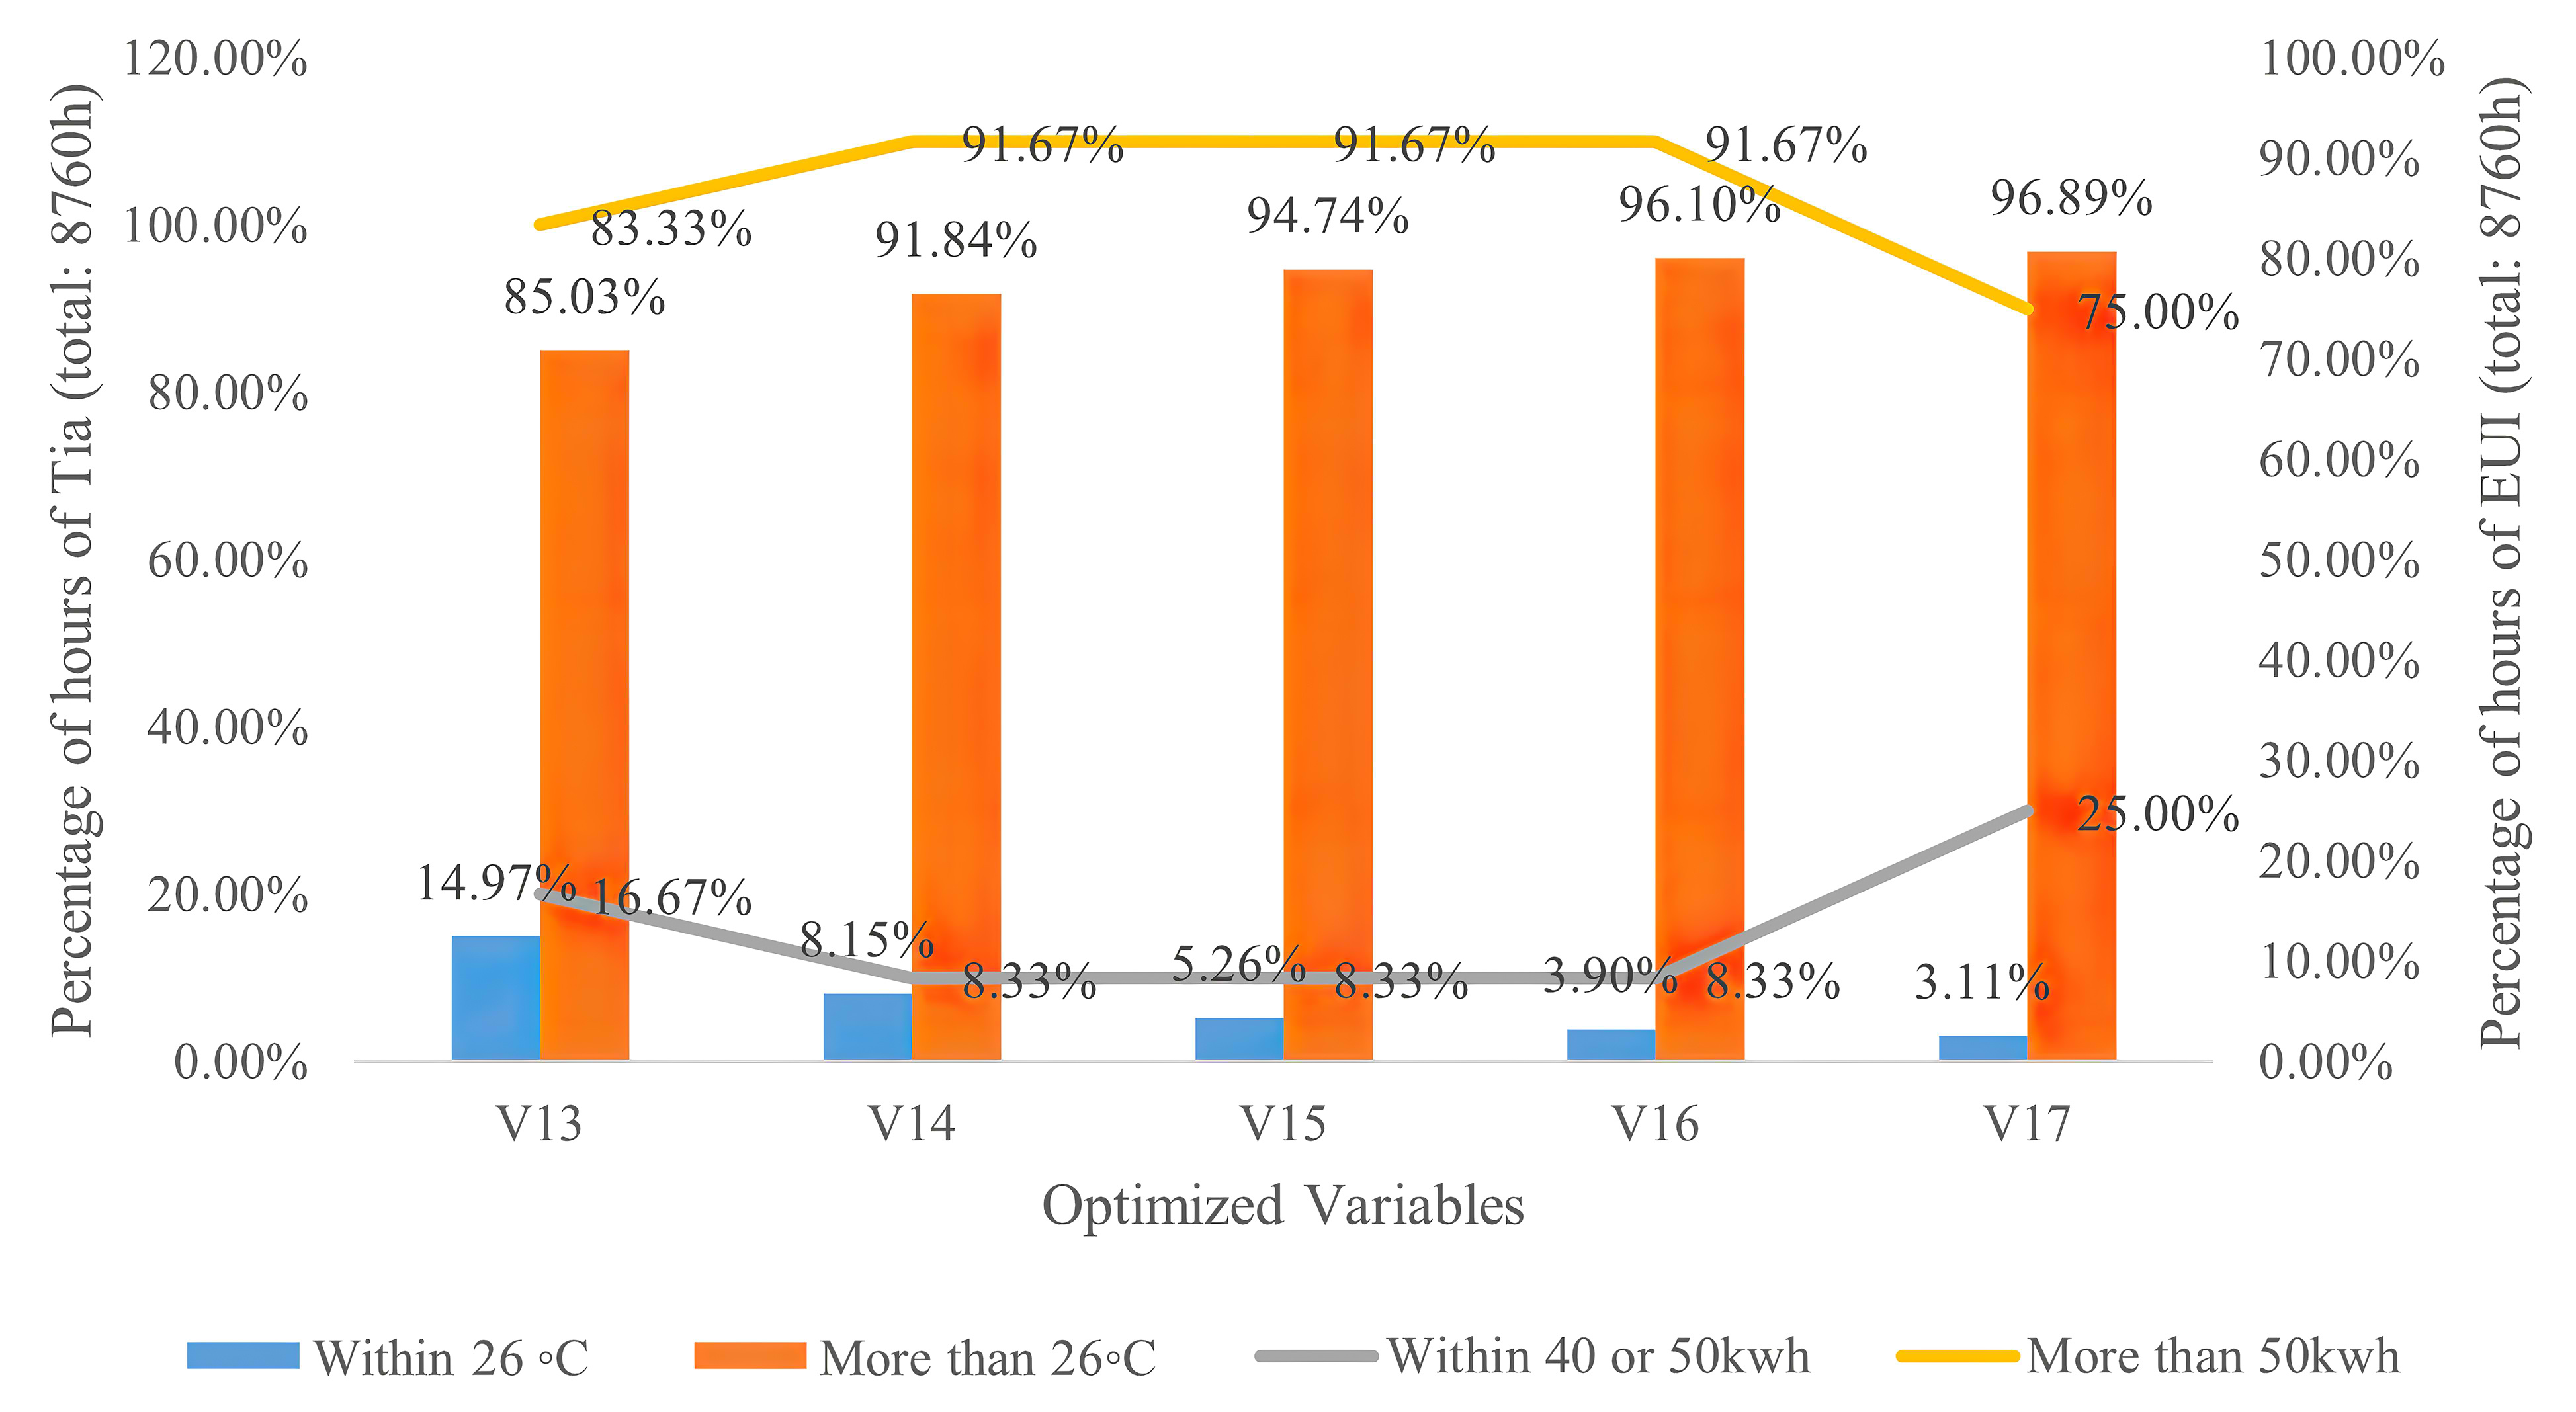
Fig. 17. Relationships between air temperature and cooling energy performance percentages and wall thickness.
Figure 18
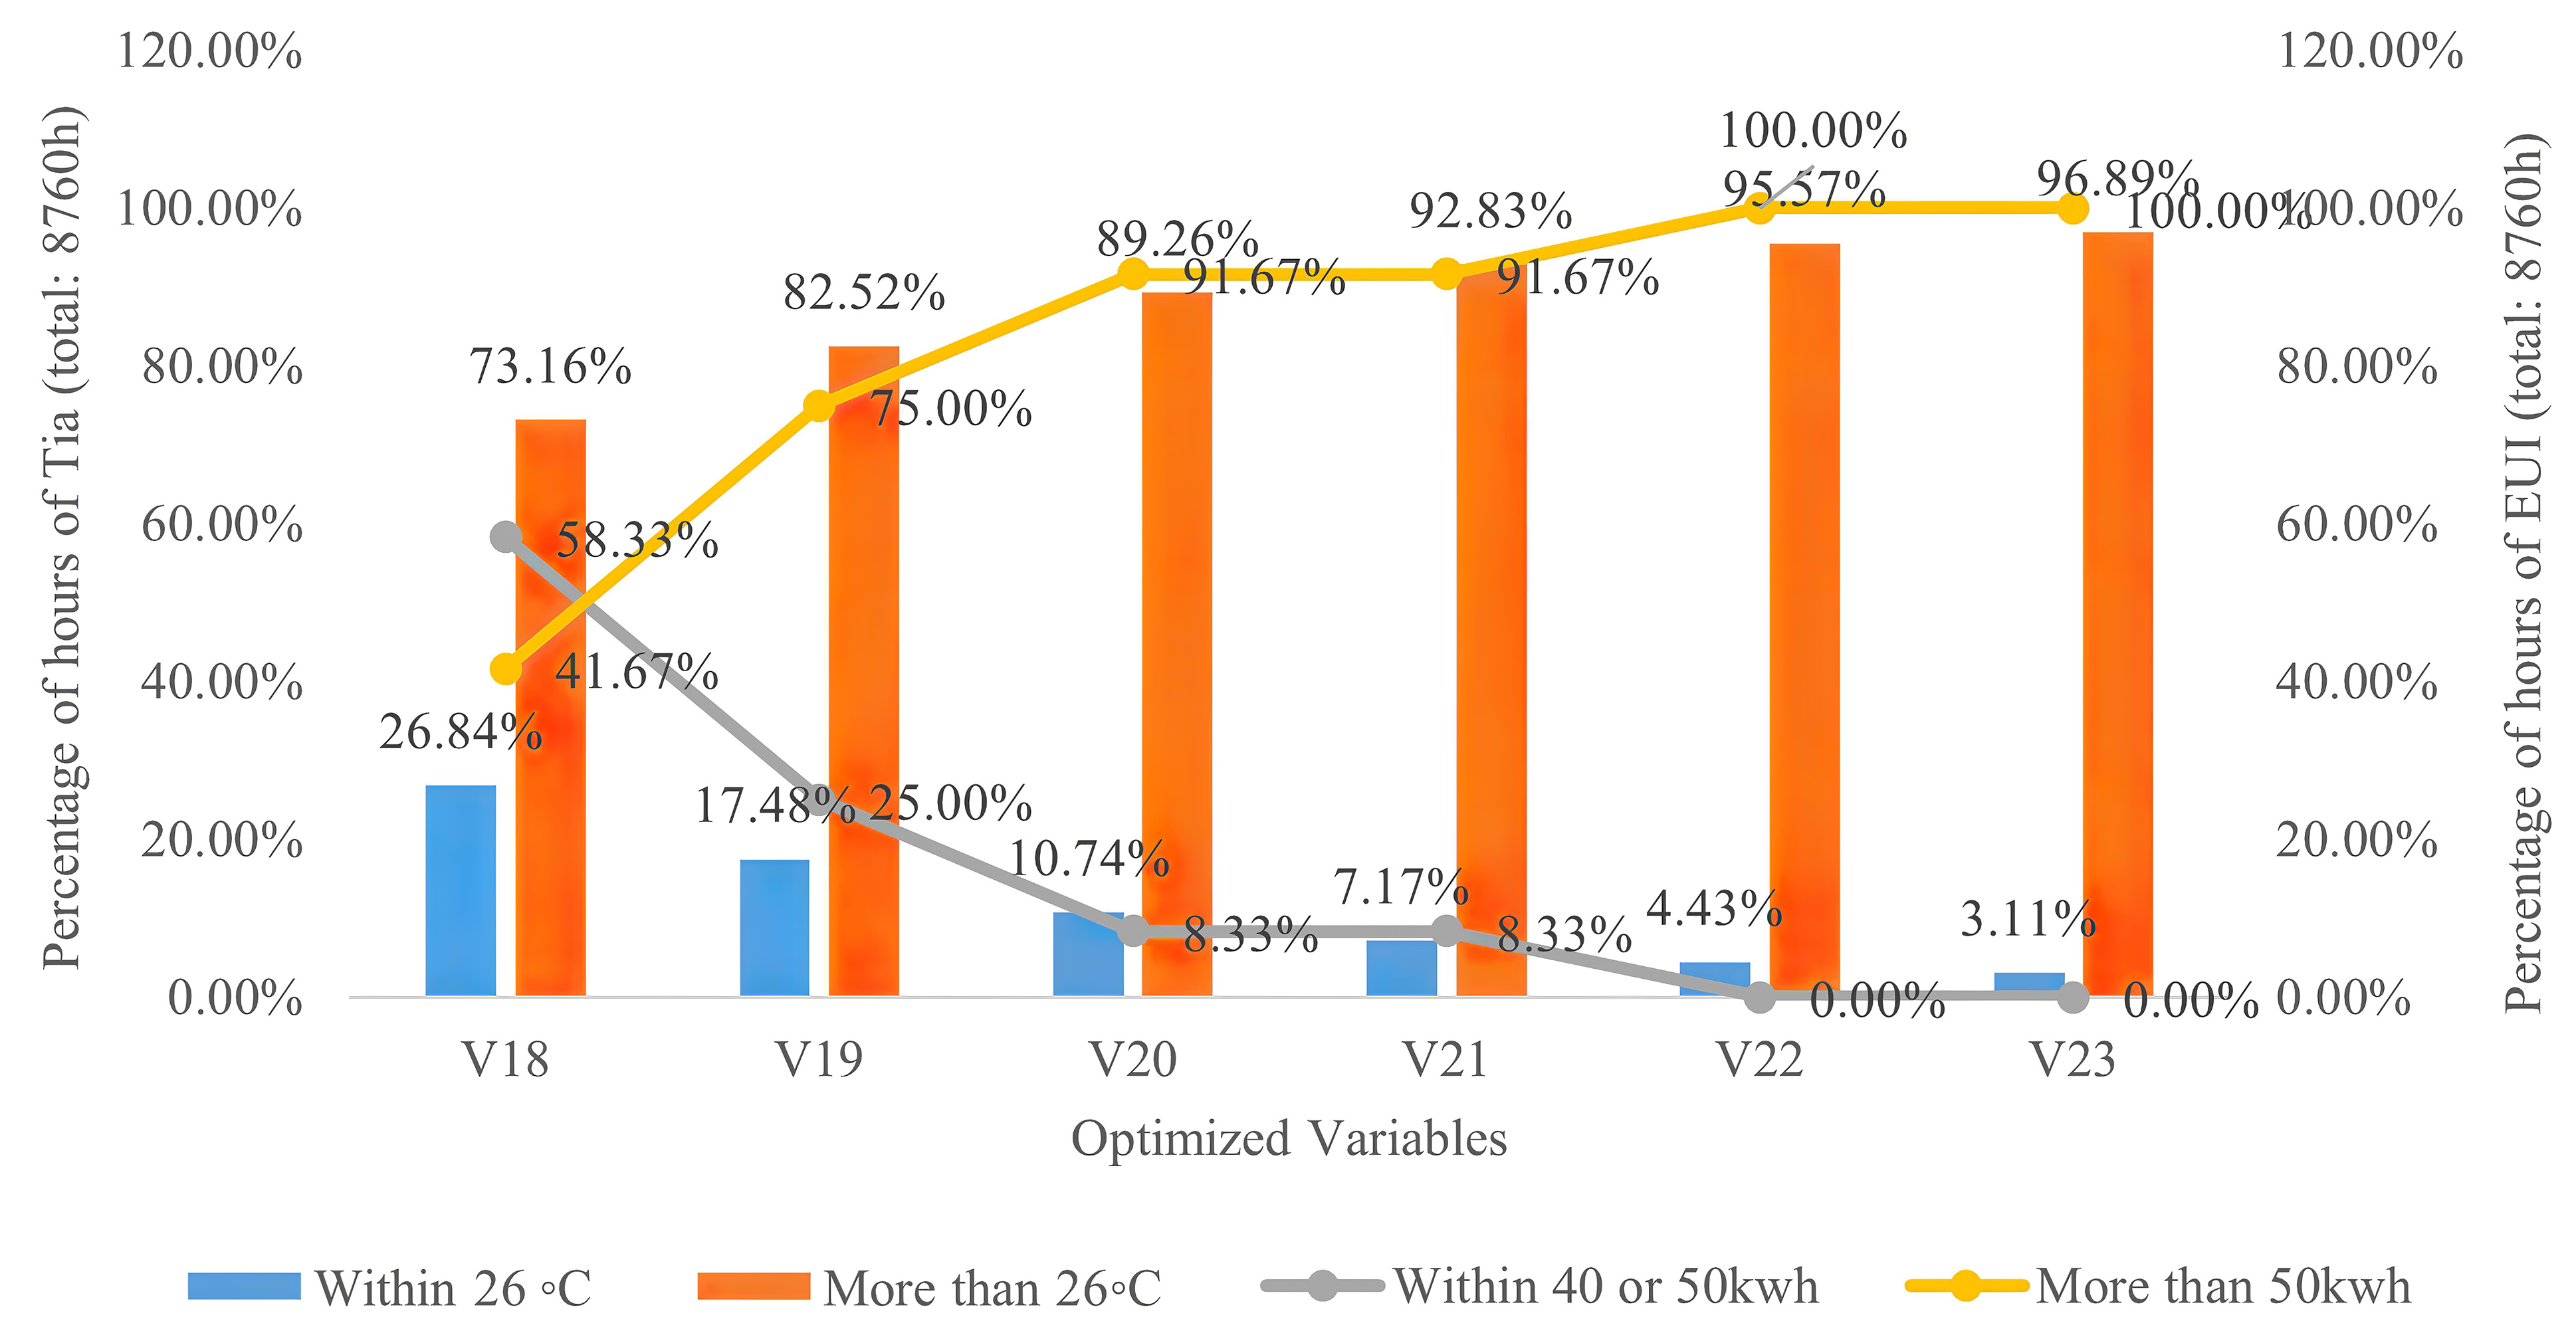
Fig. 18. Relationships between air temperature and cooling energy performance percentages and U-values of the wall.
6. Conclusion
UGES design prioritises the comfort of the internal environment. However, in order to optimize the design of underground spaces and ensure a comfortable interior atmosphere while also considering energy efficiency, designers must obtain adequate tools early in the design process to assist them in determining the best design variables. Most of the information on UGES is provided by experiments or Trial and error simulation analyses method. This study investigates using experiments, optimization simulation, and SA methods, focusing on a case study situated in the tropic’s climate of Penang City, Malaysia. The emphasis is on indoor thermal performance and energy performance evaluation carried out through SA and MOPM technique using Pareto front method. Six design parameters were optimized with different variable values; in terms of soil thickness, space height, thickness of external wall, U-Value of the external wall, and U-Value of the roof. To find the best Pareto front, solutions are analysed, for the thermal comfort optimal design and the cooling energy performance optimal design based on two optimization steps. SA method based on a regression method by using SCV and RMSE methods was used to study the correlation between optimization variables and optimization objectives.
The results show that the optimization variables related to the soil thickness, space height, and U-values of roof have a very little effect on the two optimization objectives when compared to reference case. The results of MOPM confirm that, while considering two objective functions of thermal comfort and energy performance for cooling by using different optimization parameters design, that as one of the objectives decreases, the other objective increases. As a result, minimization of all objective functions at the same time is unachievable without surrendering at least one design parameter. As a result, in order to select a single best solution, decision-making or trade-off between design elements and criteria is necessary. Regarding the optimal optimization design parameters results, using the applied MOPM method, it is possible to decrease the cooling energy for underground spaces, by up to 58.33% of total hours of the year, respectively, while maintaining occupants’ thermal comfort in the acceptable range, by up to 26.84%. To summarise, the technique suggested in this work uses EnergyPlus as the computational kernel and integrates multi-objective algorithms, which has significant benefits in terms of accuracy and variety of optimization outcomes. As a consequence, the optimization findings are trustworthy and may be widely applied on other elements of UGES design in future study. This result is in a good agreement with other studies, Shi, Zhang [10] found that by the decrease in the U-values of the envelopes may result in increased energy consumption when the excellent thermal performance of the underground envelopes is designed. Hebbal, Marif [47] found that the soil temperature at a depth of 2 m has remained stable at around 30◦C, while the temperature of the underground building is around 28.5°C. These results show that this passive design strategy for building envelope can create acceptable thermal comfort. Despite the above contributions of the results, there are several limitations to be acknowledged which could be included in future studies, for instance, are restricted to tropical climate environments that only require cooling. Even though limitations, it is largely possible to adapt the method for other environments, thus, the optimum solutions may be significantly different. second limitation that the soil temperature was not measured, and its properties were not included in the simulation. It was replaced by the development of blocks with soil-like properties by modelling as adiabatic surfaces which are often used for modelling the boundary between the actual building model and any adjacent buildings which are not to be modelled.
Acknowledgement
The authors sincerely acknowledge the industrial research funds grant NO. 304 /PPBGN /6501172 /G118, with GeoID Sdn. Bhd. for supporting this project and Universiti Sains Malaysia (USM) for the cooperation given.
Contributions
All the authors contributed equally.
Declaration of competing interest
Authors report no conflicts of interest.
References
- E.M. Malatji, J. Zhang, X. Xia, A multiple objective optimisation model for building energy efficiency investment decision, Energy and Buildings 61 (2013) 81-87. https://doi.org/10.1016/j.enbuild.2013.01.042
- N. Bobylev, Underground space as an urban indicator: Measuring use of subsurface, Tunnelling and Underground Space Technology 55 (2016) 40-51. https://doi.org/10.1016/j.tust.2015.10.024
- W. Broere, Urban underground space: Solving the problems of today's cities, Tunnelling and Underground Space Technology 55 (2016) 245-248. https://doi.org/10.1016/j.tust.2015.11.012
- M. Tavakolan, F. Mostafazadeh, S. Jalilzadeh Eirdmousa, A. Safari, K. Mirzaei, A parallel computing simulation-based multi-objective optimization framework for economic analysis of building energy retrofit: A case study in Iran, Journal of Building Engineering 45 (2022) 103485. https://doi.org/10.1016/j.jobe.2021.103485
- M. Ghaderian, F. Veysi, Multi-objective optimization of energy efficiency and thermal comfort in an existing office building using NSGA-II with fitness approximation: A case study, Journal of Building Engineering 41 (2021) 102440. https://doi.org/10.1016/j.jobe.2021.102440
- R. de Dear, J. Xiong, J. Kim, B. Cao, A review of adaptive thermal comfort research since 1998, Energy and Buildings 214 (2020) 109893. https://doi.org/10.1016/j.enbuild.2020.109893
- A. Yüksel, M. Arıcı, M. Krajčík, M. Civan, H. Karabay, A review on thermal comfort, indoor air quality and energy consumption in temples, Journal of Building Engineering 35 (2021) 102013. https://doi.org/10.1016/j.jobe.2020.102013
- Q. Zhao, Z. Lian, D. Lai, Thermal comfort models and their developments: A review, Energy and Built Environment 2 (2021) 21-33. https://doi.org/10.1016/j.enbenv.2020.05.007
- X. Dong, Y. Wu, X. Chen, H. Li, B. Cao, X. Zhang, X. Yan, Z. Li, Y. Long, X. Li, Effect of thermal, acoustic, and lighting environment in underground space on human comfort and work efficiency: A review, Science of The Total Environment 786 (2021) 147537. https://doi.org/10.1016/j.scitotenv.2021.147537
- L. Shi, H. Zhang, Z. Li, Z. Luo, J. Liu, Optimizing the thermal performance of building envelopes for energy saving in underground office buildings in various climates of China, Tunnelling and Underground Space Technology 77 (2018) 26-35. https://doi.org/10.1016/j.tust.2018.03.019
- J. Yu, Y. Kang, Z. Zhai, Comparison of ground coupled heat transfer models for predicting underground building energy consumption, Journal of Building Engineering 32 (2020) 101808. https://doi.org/10.1016/j.jobe.2020.101808
- J. Liu, Y. Jiang, Y. Jin. Dynamic Model of Heat Transfer through Underground Building Envelope. in 2010 International Conference on Intelligent System Design and Engineering Application. 2010. https://doi.org/10.1109/ISDEA.2010.23
- Y. Yuan, B. Cheng, J. Mao, Y. Du, Effect of the thermal conductivity of building materials on the steady-state thermal behaviour of underground building envelopes, Building and environment 3 (2006) 330-335. https://doi.org/10.1016/j.buildenv.2005.01.025
- J. Zhu, L. Tong, Experimental study on the thermal performance of underground cave dwellings with coupled Yaokang, Renewable Energy 108 (2017) 156-168. https://doi.org/10.1016/j.renene.2017.02.051
- Z. Tan, A.C. Roberts, G.I. Christopoulos, K.-W. Kwok, J. Car, X. Li, C.-K. Soh, Working in underground spaces: Architectural parameters, perceptions and thermal comfort measurements, Tunnelling and Underground Space Technology 71 (2018) 428-439. https://doi.org/10.1016/j.tust.2017.09.002
- S. Choi, M. Krarti, Thermally optimal insulation distribution for underground structures, Energy and Buildings 32 (2000) 251-265. https://doi.org/10.1016/S0378-7788(00)00051-7
- L. Magnier, F. Haghighat, Multiobjective optimization of building design using TRNSYS simulations, genetic algorithm, and Artificial Neural Network, Building and Environment 45 (2010) 739-746. https://doi.org/10.1016/j.buildenv.2009.08.016
- C. Diakaki, E. Grigoroudis, N. Kabelis, D. Kolokotsa, K. Kalaitzakis, G. Stavrakakis, A multi-objective decision model for the improvement of energy efficiency in buildings, Energy 35 (2010) 5483-5496. https://doi.org/10.1016/j.energy.2010.05.012
- A.A.S. Bahdad, S.F.S. Fadzil, H.O. Onubi, S.A. BenLasod, Sensitivity analysis linked to multi-objective optimization for adjustments of light-shelves design parameters in response to visual comfort and thermal energy performance, Journal of Building Engineering 44 (2021) 102996. https://doi.org/10.1016/j.jobe.2021.102996
- Y. Fang, S. Cho, Design optimization of building geometry and fenestration for daylighting and energy performance, Solar Energy 191 (2019) 7-18. https://doi.org/10.1016/j.solener.2019.08.039
- R. Guo, Y. Hu, M. Liu, P. Heiselberg, Influence of design parameters on the night ventilation performance in office buildings based on sensitivity analysis, Sustainable Cities and Society 50 (2019) 101661. https://doi.org/10.1016/j.scs.2019.101661
- R. Gagnon, L. Gosselin, S. Decker, Sensitivity analysis of energy performance and thermal comfort throughout building design process, Energy and Buildings 164 (2018) 278-294. https://doi.org/10.1016/j.enbuild.2017.12.066
- P. Heiselberg, H. Brohus, A. Hesselholt, H. Rasmussen, E. Seinre, S. Thomas, Application of sensitivity analysis in design of sustainable buildings, Renewable Energy 34 (2009) 2030-2036. https://doi.org/10.1016/j.renene.2009.02.016
- H. Shen, A. Tzempelikos, Sensitivity analysis on daylighting and energy performance of perimeter offices with automated shading, Building and environment 59 (2013) 303-314. https://doi.org/10.1016/j.buildenv.2012.08.028
- N. Delgarm, B. Sajadi, K. Azarbad, S. Delgarm, Sensitivity analysis of building energy performance: a simulation-based approach using OFAT and variance-based sensitivity analysis methods, Journal of Building Engineering 15 (2018) 181-193. https://doi.org/10.1016/j.jobe.2017.11.020
- A. Ebrahimi-Moghadam, P. Ildarabadi, K. Aliakbari, F. Fadaee, Sensitivity analysis and multi-objective optimization of energy consumption and thermal comfort by using interior light shelves in residential buildings, Renewable Energy 159 (2020) 736-755. https://doi.org/10.1016/j.renene.2020.05.127
- A. Qahtan, N. Keumala, S. Rao, Z.A. Samad, Field analysis of thermal comfort in two energy efficient office buildings in Malaysia. Energy Systems Laboratory; Texas A&M University., (2010).
- A.M. Qahtan, Thermal performance of a double-skin façade exposed to direct solar radiation in the tropical climate of Malaysia: A case study, Case Studies in Thermal Engineering 14 (2019) 100419. https://doi.org/10.1016/j.csite.2019.100419
- A. Ghaffarianhoseini, U. Berardi, A. Ghaffarianhoseini, K. Al-Obaidi, Analyzing the thermal comfort conditions of outdoor spaces in a university campus in Kuala Lumpur, Malaysia, Science of the total environment 666 (2019) 1327-1345. https://doi.org/10.1016/j.scitotenv.2019.01.284
- A. Ashrae, Standard 55-2010: thermal environmental conditions for human occupancy, Atlanta: American Society of Heating, Refrigerating and Air-Conditioning Engineers (2010).
- R. Breçani, S. Dervishi, Thermal and energy performance evaluation of underground bunkers: An adaptive reuse approach, Sustainable Cities and Society 46 (2019) 101444. https://doi.org/10.1016/j.scs.2019.101444
- P. Xue, Q. Li, J. Xie, M. Zhao, J. Liu, Optimization of window-to-wall ratio with sunshades in China low latitude region considering daylighting and energy saving requirements, Applied Energy 233-234 (2019) 62-70. https://doi.org/10.1016/j.apenergy.2018.10.027
- Y. Xu, G. Zhang, C. Yan, G. Wang, Y. Jiang, K. Zhao, A two-stage multi-objective optimization method for envelope and energy generation systems of primary and secondary school teaching buildings in China, Building and Environment 204 (2021) 108142. https://doi.org/10.1016/j.buildenv.2021.108142
- C.-E. Hagentoft, S. Pallin, A conceptual model for how to design for building envelope characteristics. Impact of thermal comfort intervals and thermal mass on commercial buildings in U.S. climates, Journal of Building Engineering 35 (2021) 101994. https://doi.org/10.1016/j.jobe.2020.101994
- N. Nasrollahzadeh, Comprehensive building envelope optimization: Improving energy, daylight, and thermal comfort performance of the dwelling unit, Journal of Building Engineering 44 (2021) 103418. https://doi.org/10.1016/j.jobe.2021.103418
- K. Lakhdari, L. Sriti, B. Painter, Parametric optimization of daylight, thermal and energy performance of middle school classrooms, case of hot and dry regions, Building and Environment (2021) 108173. https://doi.org/10.1016/j.buildenv.2021.108173
- M. Palme, R. Privitera, D. La Rosa, The shading effects of Green Infrastructure in private residential areas: Building Performance Simulation to support urban planning, Energy and Buildings 229 (2020) 110531. https://doi.org/10.1016/j.enbuild.2020.110531
- L.L. Peng, Z. Jiang, X. Yang, Q. Wang, Y. He, S.S. Chen, Energy savings of block-scale facade greening for different urban forms, Applied Energy 279 (2020) 115844. https://doi.org/10.1016/j.apenergy.2020.115844
- A.A.S. Bahdad, S.F.S. Fadzil, H.O. Onubi, S.A. BenLasod, Multi-dimensions optimization for optimum modifications of light-shelves parameters for daylighting and energy efficiency, International Journal of Environmental Science and Technology (2021). https://doi.org/10.1007/s13762-021-03328-9
- J.A. Acero, K. Herranz-Pascual, A comparison of thermal comfort conditions in four urban spaces by means of measurements and modelling techniques, Building and Environment 93 (2015) 245-257. https://doi.org/10.1016/j.buildenv.2015.06.028
- S. Tsoka, A. Tsikaloudaki, T. Theodosiou, Analyzing the ENVI-met microclimate model's performance and assessing cool materials and urban vegetation applications-A review, Sustainable Cities and Society 43 (2018) 55-76. https://doi.org/10.1016/j.scs.2018.08.009
- A. Aboelata, Reducing outdoor air temperature, improving thermal comfort, and saving buildings' cooling energy demand in arid cities - Cool paving utilization, Sustainable Cities and Society 68 (2021) 102762. https://doi.org/10.1016/j.scs.2021.102762
- R. Wang, S. Lu, W. Feng, Impact of adjustment strategies on building design process in different climates oriented by multiple performance, Applied Energy 266 (2020) 114822. https://doi.org/10.1016/j.apenergy.2020.114822
- P. Bakmohammadi, E. Noorzai, Optimization of the design of the primary school classrooms in terms of energy and daylight performance considering occupants' thermal and visual comfort, Energy Reports 6 (2020) 1590-1607. https://doi.org/10.1016/j.egyr.2020.06.008
- Z. Jalali, E. Noorzai, S. Heidari, Design and optimization of form and façade of an office building using the genetic algorithm, Science and Technology for the Built Environment 26 (2020) 128-140. https://doi.org/10.1080/23744731.2019.1624095
- P. Pilechiha, M. Mahdavinejad, F. Pour Rahimian, P. Carnemolla, S. Seyedzadeh, Multi-objective optimisation framework for designing office windows: quality of view, daylight and energy efficiency, Applied Energy 261 (2020) 114356. https://doi.org/10.1016/j.apenergy.2019.114356
- B. Hebbal, Y. Marif, M. Hamdani, M.M. Belhadj, H. Bouguettaia, D. Bechki, The geothermal potential of underground buildings in hot climates: Case of Southern Algeria, Case Studies in Thermal Engineering 28 (2021) 101422. https://doi.org/10.1016/j.csite.2021.101422
Copyright © 2022 The Author(s). Published by solarlits.com.

1916
Total views
Citations
SHARE ON


