Volume 10 Issue 1 pp. 99-116 • doi: 10.15627/jd.2023.8
The Effects of Orientation and Width of Space Between Buildings on Ventilation of High-Rise Areas
Seyedeh Azadeh Aghajanzadeh,⁎,a Seyed Morteza Hosseini, ⁎,b,c Mojtaba Lorzangeneh,d Mohsen Tabanaa
Author affiliations
a Department of Urban Design, Faculty of Urban Planning and Architecture, Jundi-Shapur University of Technology, Dezful, Iran
b Department of Architecture, Design & Media Technology, Aalborg University Copenhagen, Denmark
c Department of Architecture and Energy, Faculty of Architecture and Urbanism, University of Tehran, Tehran, Iran
d Department of Urban Planning, Faculty of Architecture & Urban Planning, Art University of Isfahan, Isfahan, Iran
*Corresponding author.
Azadeh.aghajanzadeh@gmail.com (S. A. Aghajanzadeh)
smho@create.aau.dk (S. M. Hosseini)
mntaban@jsu.ac.ir (M. Taban)
m.lorzangeneh@aui.ac.ir (M. Lorzangeneh)
History: Received 23 February 2023 | Revised 23 May 2023 | Accepted 31 May 2023 | Published online 28 June 2023
Copyright: © 2023 The Author(s). Published by solarlits.com. This is an open access article under the CC BY license (http://creativecommons.org/licenses/by/4.0/).
Citation: Seyedeh Azadeh Aghajanzadeh, Seyed Morteza Hosseini, Mojtaba Lorzangeneh, Mohsen Taban, The Effects of Orientation and Width of Space Between Buildings on Ventilation of High-Rise Areas, Journal of Daylighting 10 (2023) 99-116. https://dx.doi.org/10.15627/jd.2023.8
Figures and tables
Abstract
Excessive heat in the high-rise urban fabric has contributed to pedestrian and occupants' discomfort. Establishing wind circulation in space with an environmentally compatible and optimal configuration is necessary to improve comfort in this region. The study benefits from field measurements and experimental validation of CFD simulation to investigate the effective parameters that affect wind speed. The master plan has proposed decentralized and limited high-rise construction to prevent the horizontal growth of Babolsar city. Meanwhile, the demand for high-rise buildings is high in the city. Therefore, altitude density (height factor) is considered as a constant factor. The buildings' orientation and enclosure based on the passages' width have opposite reactions in the direction of the prevailing wind. The correlation between the orientation and the enclosure with the wind speed are the values of 0.504 and 0.2226 respectively, which have the highest correlation among other parameters. The changes have been made in the building orientation factor in the dominant wind direction by creating permeability as well as creating low enclosure in the paths and empty spaces perpendicular to the dominant wind (W’= 3W, E’ = 0.33E). These strategies have finally improved wind velocity and created wind circulation in urban block spaces. Finally, according to the data analysis for Climate compatible in humid areas and the optimal behavior of wind flow for proper urban ventilation, an improved layout for future developments will be presented.
Keywords
High-rise building, Urban microclimate, Urban ventilation, Wind flow
1. Introduction
About two-thirds of the world's population will be living in cities by 2050, and this ratio is still growing [1]. Urbanization growth has led to the expansion of cities and the increase of urban density [2]. New cities are characterized by massive high-rise structures [3] so that urban space becomes denser in space with high construction intensity [2].
As urban density increases, environmental problems arise, and urban design must provide solutions to these problems [4]. Since the urban areas are affected by the urban forms, this type of city deformation often causes dysfunction in the urban environment [2]. Urban development as a combination of complex forms significantly affects the aerodynamics of the environment. Hence, high-density areas are environmentally unfavorable and high-rise buildings that are inseparable from a modern city can significantly deteriorate the urban environment [5,6].
Urban shape variables have a great impact on climatic factors such as temperature, humidity, wind flow, shade, and sunlight [3]. Living in high-rise buildings provides more daylight, cooler winds, and less humidity in the residential area. Non-compliance with planning and design standards by the mentioned climatic factors are probably the reasons why residents are not eager to live in hot and humid cities. [7]. Therefore, urban design should create a micro-climate to reduce the temperature caused by the urban block layout. Design strategies can create or modify an environmental comfort that improves thermal conditions [8].
In this study, the effect of the physical characteristics of the urban block shape on climatic factors in the humid region is investigated. In humid areas, wind flow is one of the main climatic factors that have direct effects on the optimal temperature and humidity and changes with the geometrical ratio of building blocks as well as urban patterns [9,10]. The quality of air outside and inside the building depends on the ventilation of urban areas by the wind flow. Wind flow improves outdoor air quality by diluting heat between buildings. Urban wind flow is influenced by urban morphology, which is a combination of urban density, arrangement of buildings next to each other, and their shape and dimensions [11,12]. The real feel of heat in space decreases as the wind speed improves. This is because increasing the wind speed can increase the movement of cooler air and the mixing of the atmosphere, and can cause the movement of air humidity. Therefore, it has a great potential to use the natural wind to reduce local heating and is practically significant for increasing urban ventilation [12].
The growth of high-rise buildings and high-density urban blocks prevents the prevailing wind flow [13]. One way to neutralize or reduce outdoor ventilation problems is an optimal design for prevailing wind flow. This process removes the trapped heat air between the urban masses [14]. Numerous studies investigated the relationship between outdoor air conditioning and urban form. Based on their findings, there are fundamental variables that guide outdoor natural ventilation. The urban forms include the physical details of the urban textures. The physical details consist of the buildings' orientation [15,10,16], their enclosure in space [15,17-19], the type of their configuration in the texture [20], the buildings' height [14,21], and the width of the streets between them [22-24]. Small modifications in their configuration and orientation, such as changes in the corners of buildings as well as setbacks in the building shape, can improve the wind comfort in the texture. In addition to the configuration, the compatibility between the building blocks' height and the streets' width between them can be effective factors in the wind flow pattern. However, each of these two factors alone has a significant influence on wind velocity and its distribution [25,26].
Increased enclosure (H/W), in other words, the ratio between building height and passage width, has been reported in many studies in hot and humid regions [27,28]. Moreover, the direction of the wind flow is another important factor in reducing the temperature, especially in summer [29,30]. Investigation of these factors gives us a better understanding of the behavior of urban form changes in an area. Also, urban shape variables support the conditions for providing a model for improving the ventilation of urban blocks. This article aims to investigate the building's mass modifications and their effect on wind flow for improving outdoor comfort for inhabitants in their living environment.
In this research, the case study is a local context of the city of Babolsar, northern Iran. Babolsar has a temperate and humid climate as it is in proximity to the sea. In recent years, dense and high-rise construction has taken place due to the geographical location of the city, tourism, and economic benefits. According to the urban plans, limited and decentralized high-rise buildings have been proposed to prevent the horizontal growth of the city. Since outdoor spaces, ventilation, lighting, etc. are not considered, urban planning is strongly influenced by economic interests. The northern parts of the city and the streets leading to the beach have been surrounded by high-rise buildings. This sudden deformation in the building blocks has reduced the wind velocity among them. Reducing wind velocity and wind circulation leads to a feeling of high heat and decreases residents’ and pedestrians’ comfort in the space between buildings. The physical factors of block's shape that affect wind flow are building height, the width of passages and space between buildings, confinement, and orientation of buildings to the prevailing wind in this area.
In recent years, there has been a significant surge in research focused on simulating wind flow in outdoor environments. These studies have shed light on the crucial role played by alterations in urban physics' characteristics in enhancing wind flow. To gain a comprehensive understanding of the various investigations undertaken to improve urban ventilation performance through the manipulation of wind flows into buildings, refer to Table 1, which presents a comprehensive overview of these studies.
Table 1
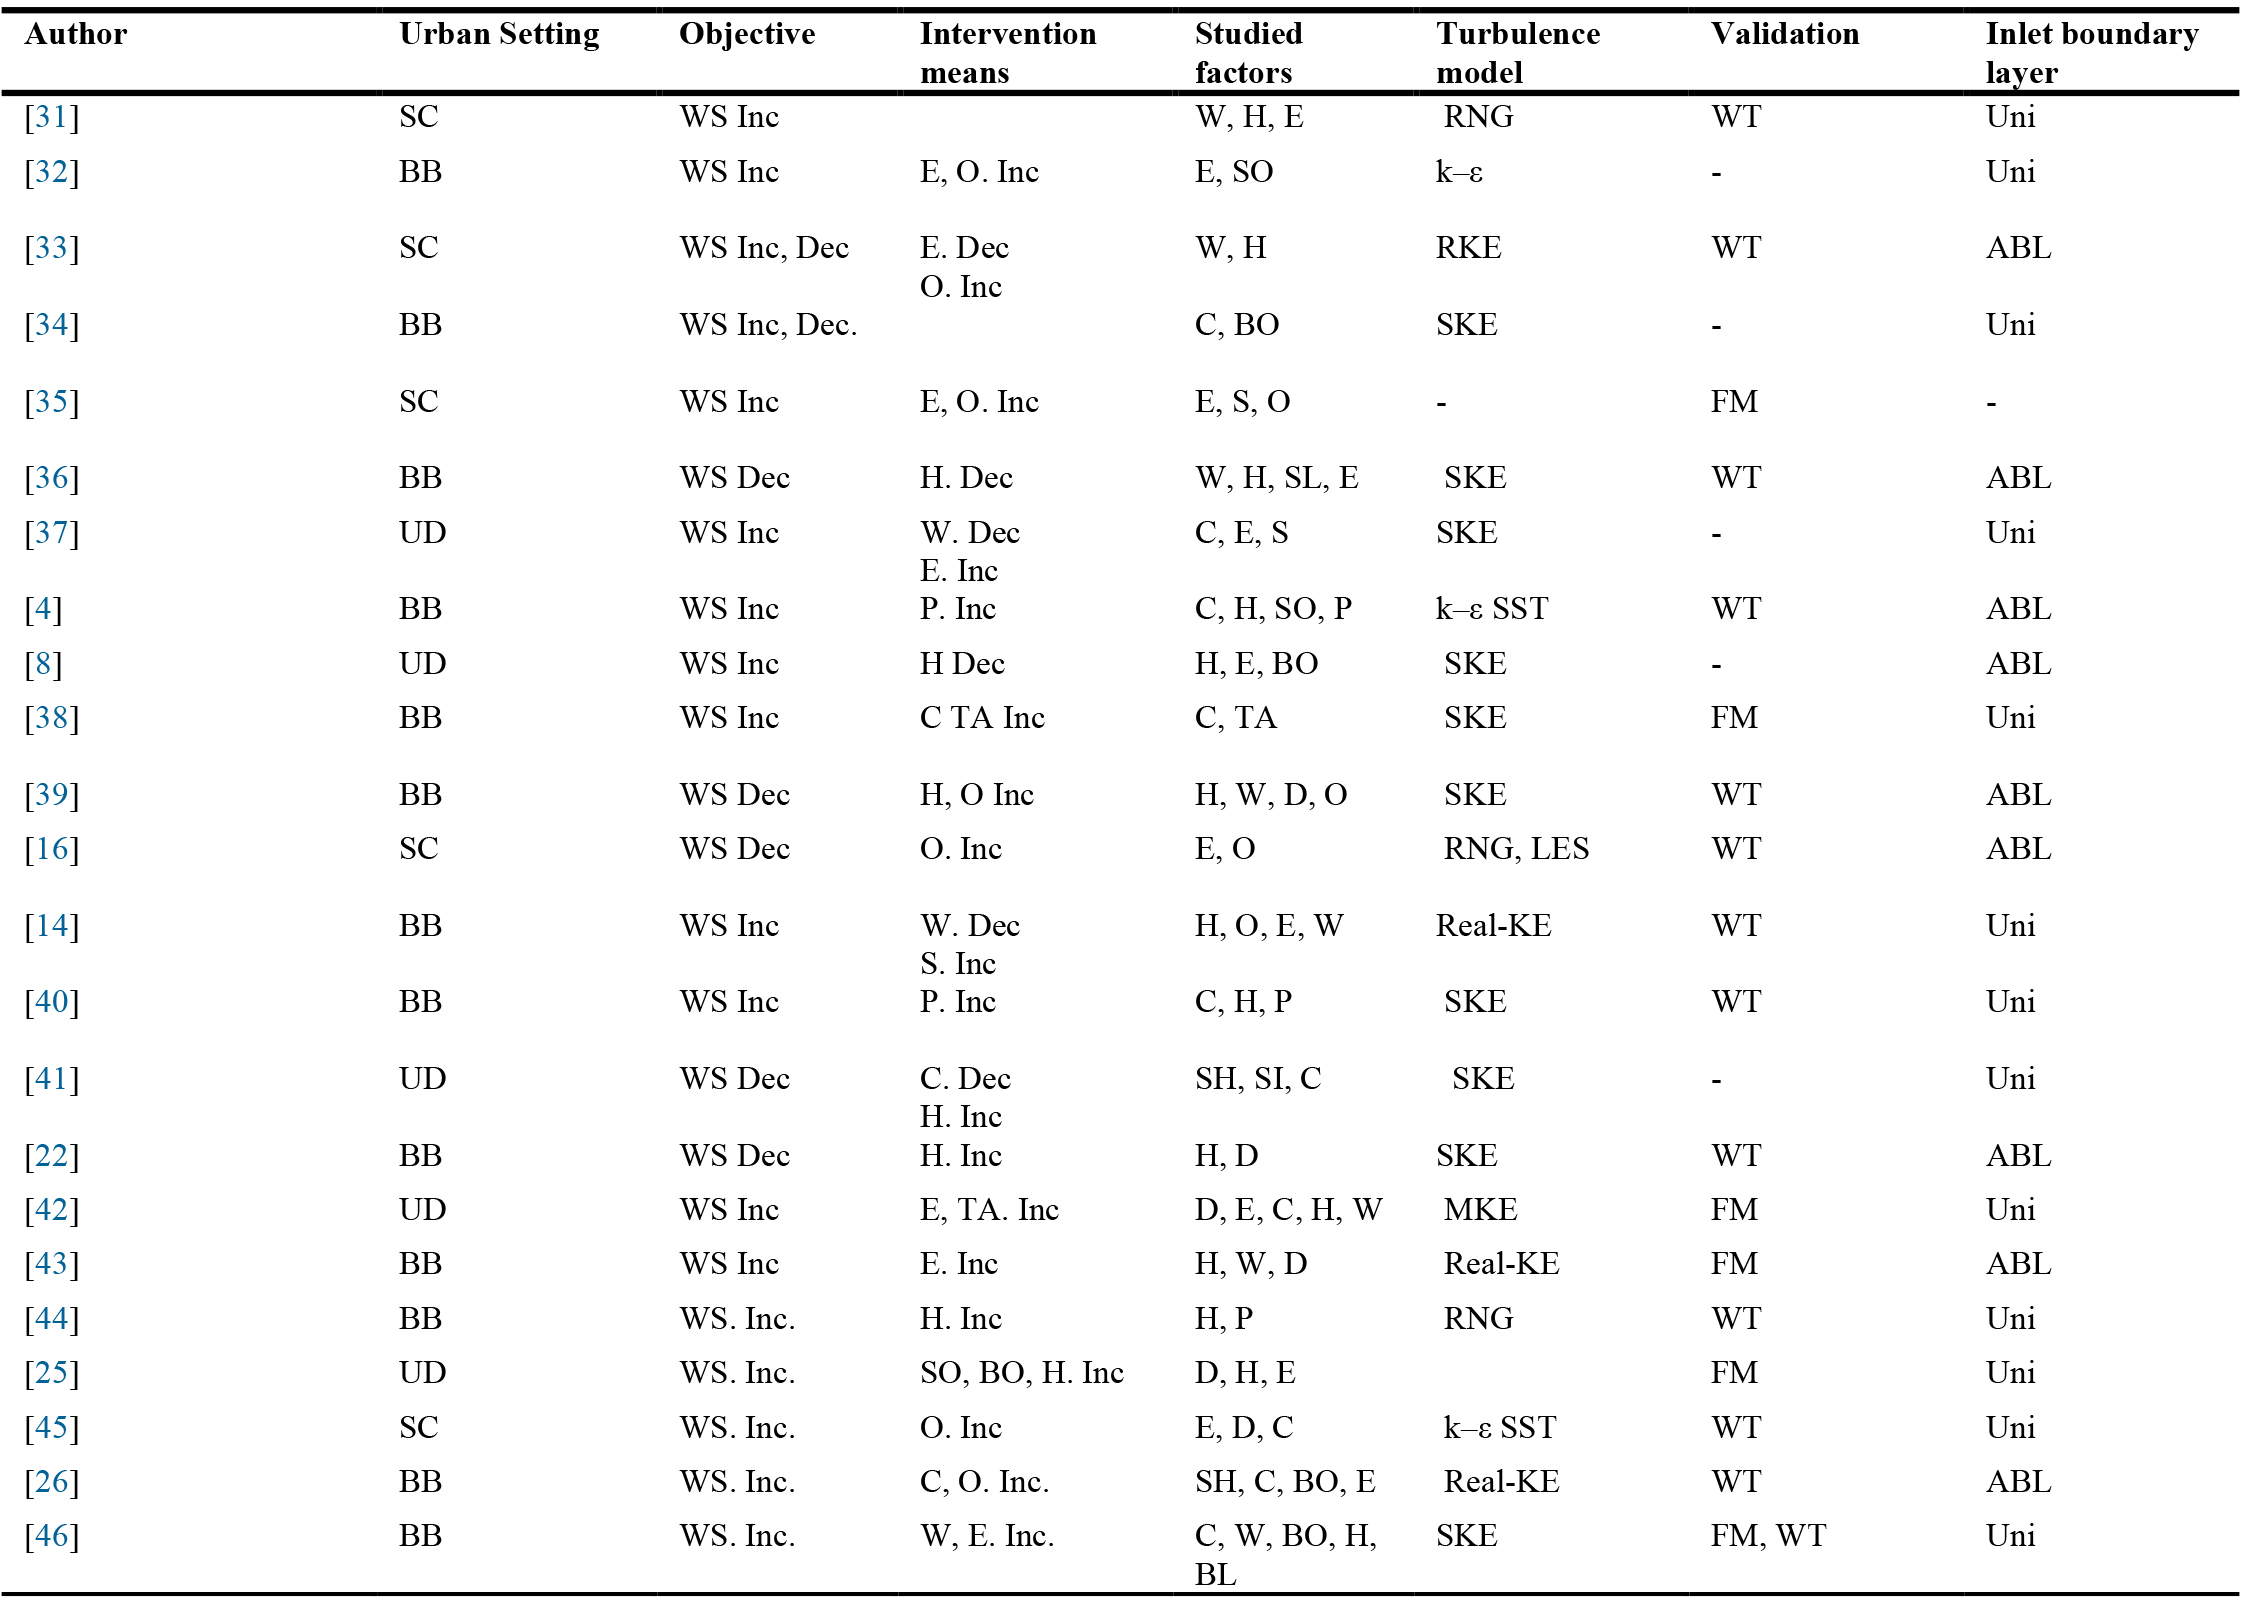
Table 1. Theoretical references used in comparisons for algorithm validation.
The following observations can be made:
- CFD simulations are used to pursue such studies. This method is one of the most common methods for airflow simulation studies.
- The urban ventilation study takes place according to the masses'-built layout, and most of these layout properties have focused on the physical structure of the blocks and their configuration type.
- Finally, there is a significant effect of these characteristics (enclosure, street width, buildings height, buildings and streets orientation, configurations, density. etc.) on wind velocity in different conditions. The wind treatment is altered in the block by changing each of these characteristics.
1.1. Research objectives
In this study, the effective physical factors on wind velocity that have been introduced in previous studies, are investigated in the study area. By recognizing the effective factors on wind velocity and improving the built environment, it can help urban breathing and provide better environmental comfort for the future.
The purpose of this study is to create a comfort zone in a humid climate with low wind speed, along with the increasing development of high-rise construction. To create comfort in this zone, it is necessary to identify physical factors that increase wind speed and help reduce and remove moisture. Finally, the effective factors to reach optimal comfort conditions are improved. To achieve this process, the research is based on the following questions: 1) What is the change in wind speed with the change of urban block area, height, width, buildings' orientation 2) Which of these variables is the most effective factor in wind speed? And 3) How does the combination of ventilation variables improve the effect of outdoor air conditioning by modifying the urban block?
2. Research method
2.1. Analysis of the case study area
Babolsar is a city located in 36°42′09″ latitude and 52°39′27″ longitude in Mazandaran province in the northern part of Iran between the Caspian Sea and the Alborz mountains. The current study is mainly composed of low-rise buildings based on the classification made by Stewart and Oke [47]. During recent years, the waterfront area has been witnessing ongoing development where low-rise and low-density areas have become high-rise and high-density, because of the visual access to the seafront and proper infrastructures and facilities in the coastal area. The area is covered with streets and buildings. The green space is low between the residential buildings.
The study area has two urban blocks (shown as block i and block ii in Fig. 1). It covers a total surface area of about, 111315 m2. The length of the area is 466 m and the width is 258 m. The comparison of blocks i and ii indicated that in block i, the density and setting of buildings have been adapted to the nearby fabric, while block ii has maintained its traditional physical condition. The demands for construction are going to change the morphology of block ii and transform it into high-rise buildings. The minimum height of buildings is 4 m in block ii, and the maximum height of buildings is 39 m in block i.
Figure 1
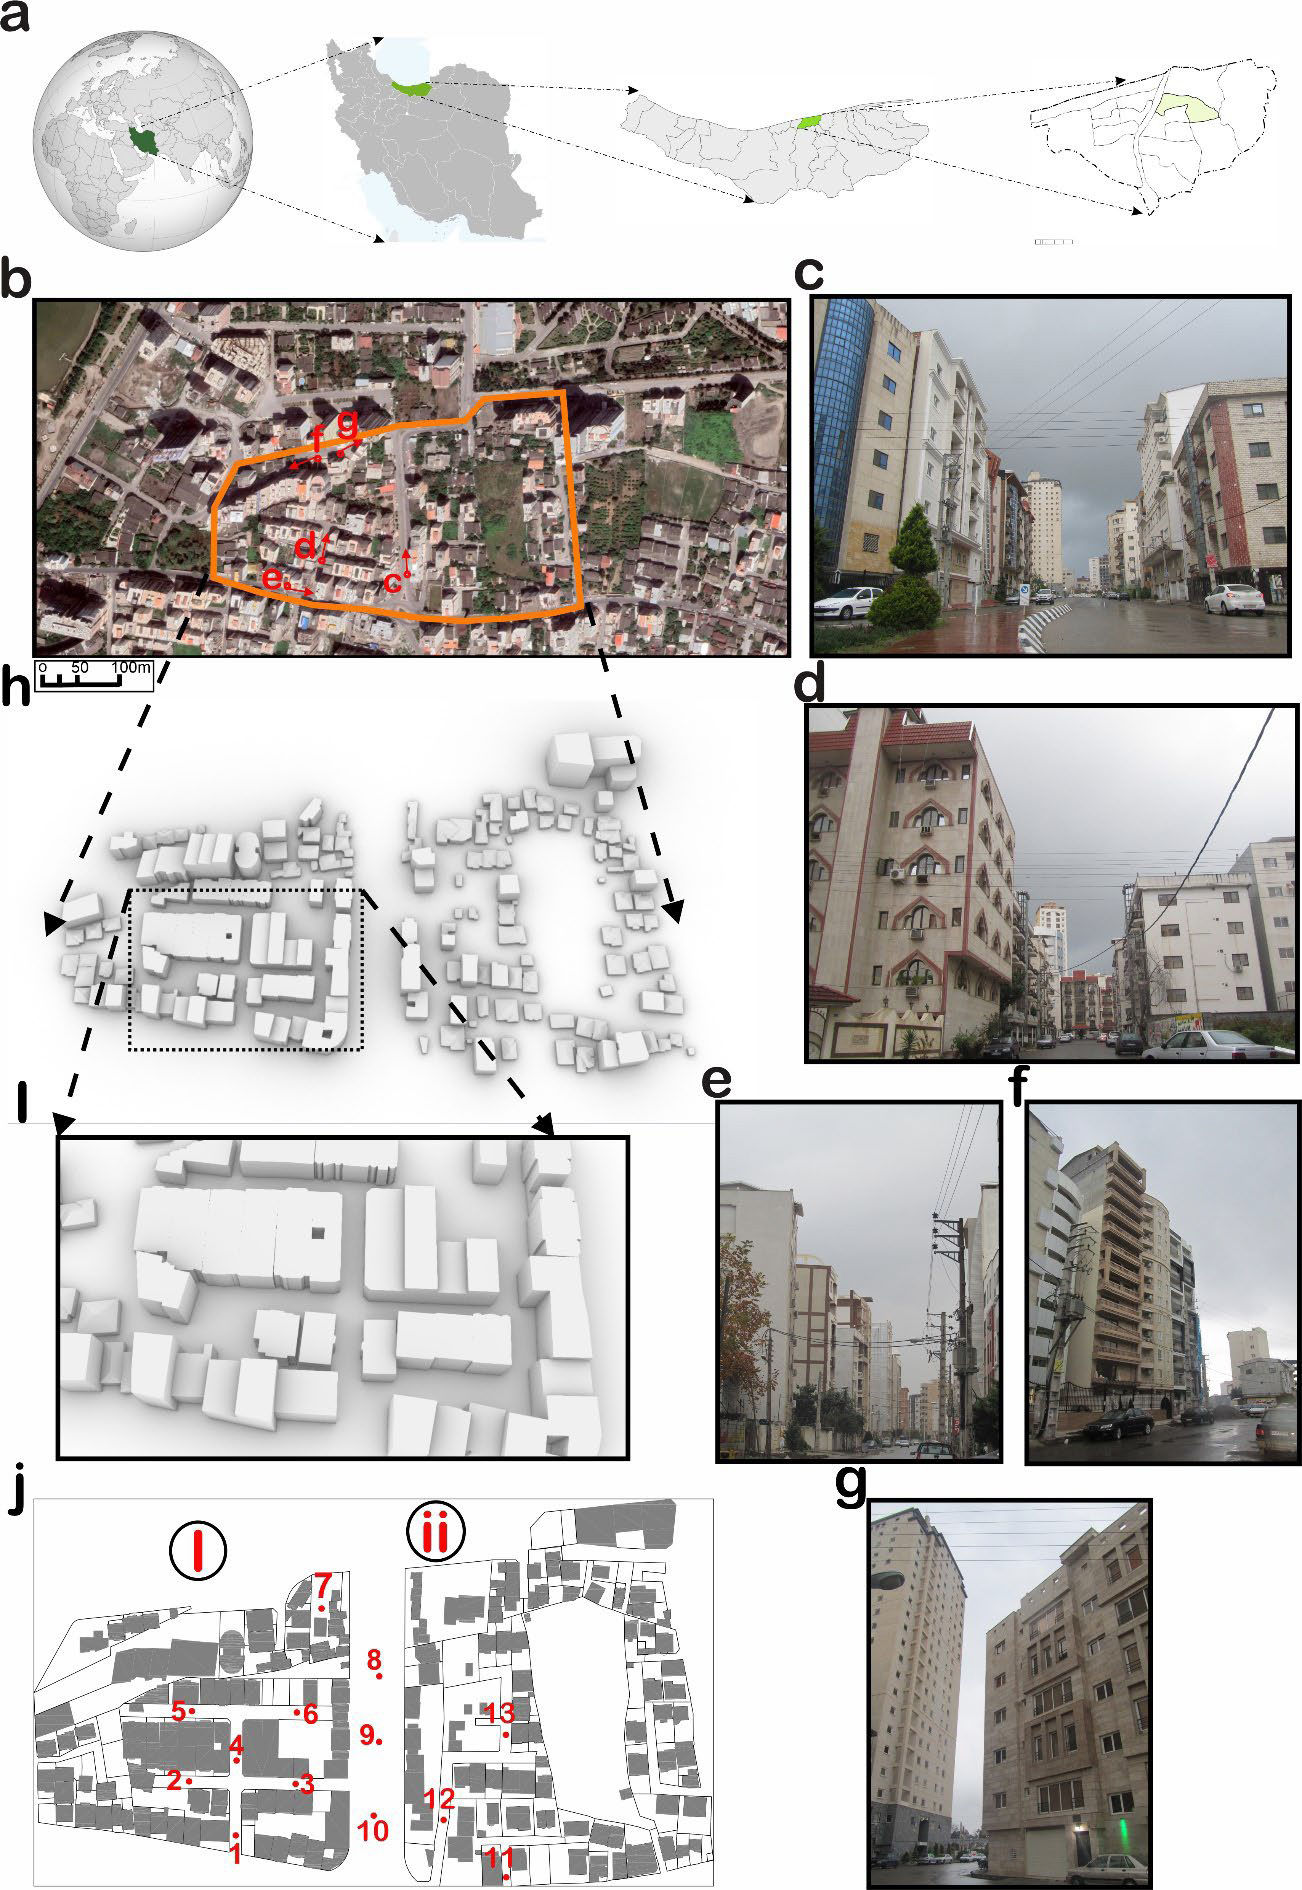
Fig. 1. (a) The location of the study area, (b) Aerial view of the case study area and surroundings from West to East. The orange line in (b) indicates the border of the case study area, (h) and (i) Corresponding views of the computational 3D model, (c) Street view from South to North direction (d) Street view from the middle of the study area taken from point 1 on (j) from South to North direction. (e), (f) and (g) Street view from West to East taken from a high rise building south of the case study area, (j) Plan view of the area and location of measurement points.
The air humidity in Babolsar is higher than in other cities in Mazandaran, due to its proximity to the sea and the prevailing weather conditions; in other words, it is sultry. The wind is the main cause of humidity movement in this area. Wind movement can reduce humidity between the masses. Its dominant wind direction during different months of the year in the west and its speed has been estimated at 1.4 m/s at an annual average (Fig. 2).
Figure 2
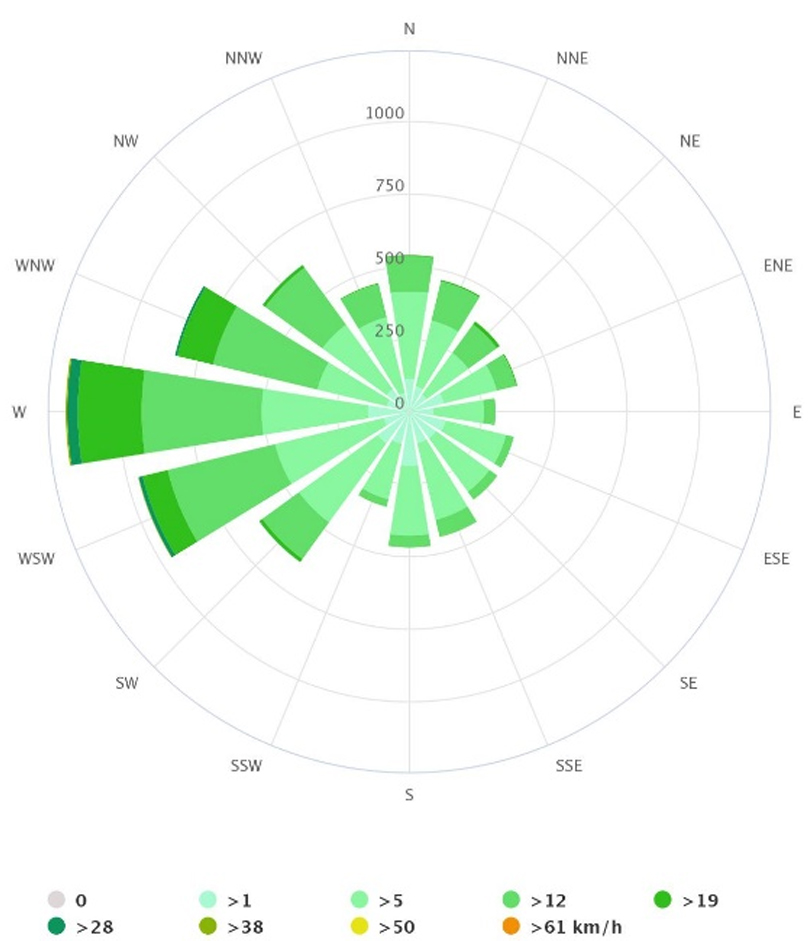
Fig. 2. Wind-rose diagram in a period of 60 years in Babolsar city, Mazandaran’s capital.
3. Field measurements
3.1. Selection of field measurement days
The real feel of heat caused by high humidity is felt on summer and hot days, and not on cold days of the year. Therefore, for investigating the impact of urban ventilation on micro-climate, it is better to select sunny or mostly sunny days. Previous studies have also shown that microclimates can change during the day of the week because there is an interference between human activity and the heat generated [48]. Therefore, measurement days should be done on several uniform days at different hours to minimize the interference of diversity of human activities. According to the physical conditions, the measurement process was performed on 3 consecutive warm summer days, between the 7th and 9th of August 2018. The measurements were recorded in 5 time periods during the day between 8-10 am, 10-12 am, 2-4 pm, 4-6 pm, and 6-8 pm. The temperature difference between 10-12 and 12-2 is very small and, it is ignored.
3.2. Mobility survey method
The mobile traverse technique has been commonly adopted for collecting microclimatic information at the local scale. This study adopted the mobile survey method to monitor the wind and thermal environment in the open, enclosed, and gridiron precinct. The detailed information of mobile survey routine, instrument setting, and data loggers are presented as follows.
3.2.1. Mobile survey routine and measurement time
In this study, due to resource limitations, there were three sets of mobile microclimatic weather stations to record the microclimatic information. To better report and measure near-reality wind speeds in microclimates, it is essential to set enough points with different features for measurement. This study set 13 measurement points. The measurement positions are indicated in Fig. 1(c) which presents some information about the measurement locations and the number of measurement points for each location and each point is arranged in as many places as possible with specific physical characteristics. The distance between two points (i.e. 1 and 2) was about 120 m, requiring people to move manually the weather station from one point to the next in 10 min. All three devices should record the microclimates simultaneously and if one set was not well arranged in 10 min, another 10 min would be given to set up the station. For the position of the weather stations, it is better to arrange them at the center of the vehicle road. However, for the consideration of safety and the avoidance of vehicles, under most conditions, it was difficult.
3.2.2. Environmental sensor and parameter
The wind velocity was measured by anemometers (ST-3880 hot wire ANOMET) (Fig. 3). The device consisted of a sensor for wind speed in each direction. Their accuracy is ±5% (overs for wind flow occurrence up to about 50° from the horizontal. The devices were set at a height of 1.75 meters above the ground.
Figure 3
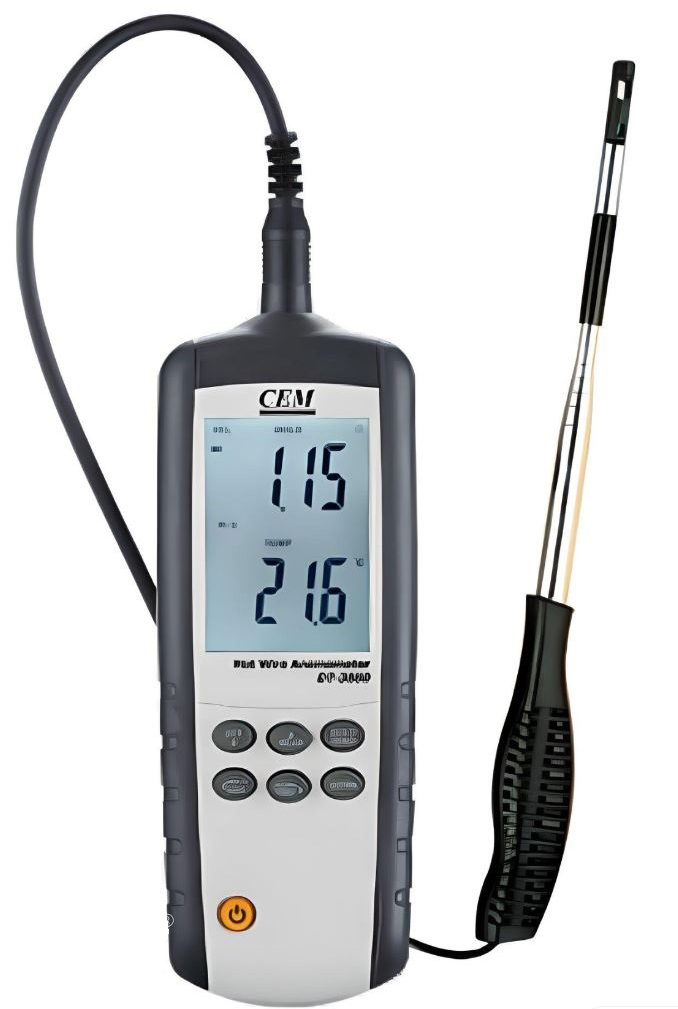
Fig. 3. ST-3880 hot wire ANOMET.
3.3. Data analytical methods
Moreover, the movement of vehicles disrupts uniform conditions for more accurate and realistic wind speed measurements and the transient data presents high uncertainties Therefore, repeating the measurement every 10 minutes for a period of 2 hours, minimizes the error.
3.3.1. Descriptive analysis
The average value of wind speed in three days and the average value of total data were described in Table 2, which is quantified by the anemometer device.
Table 2
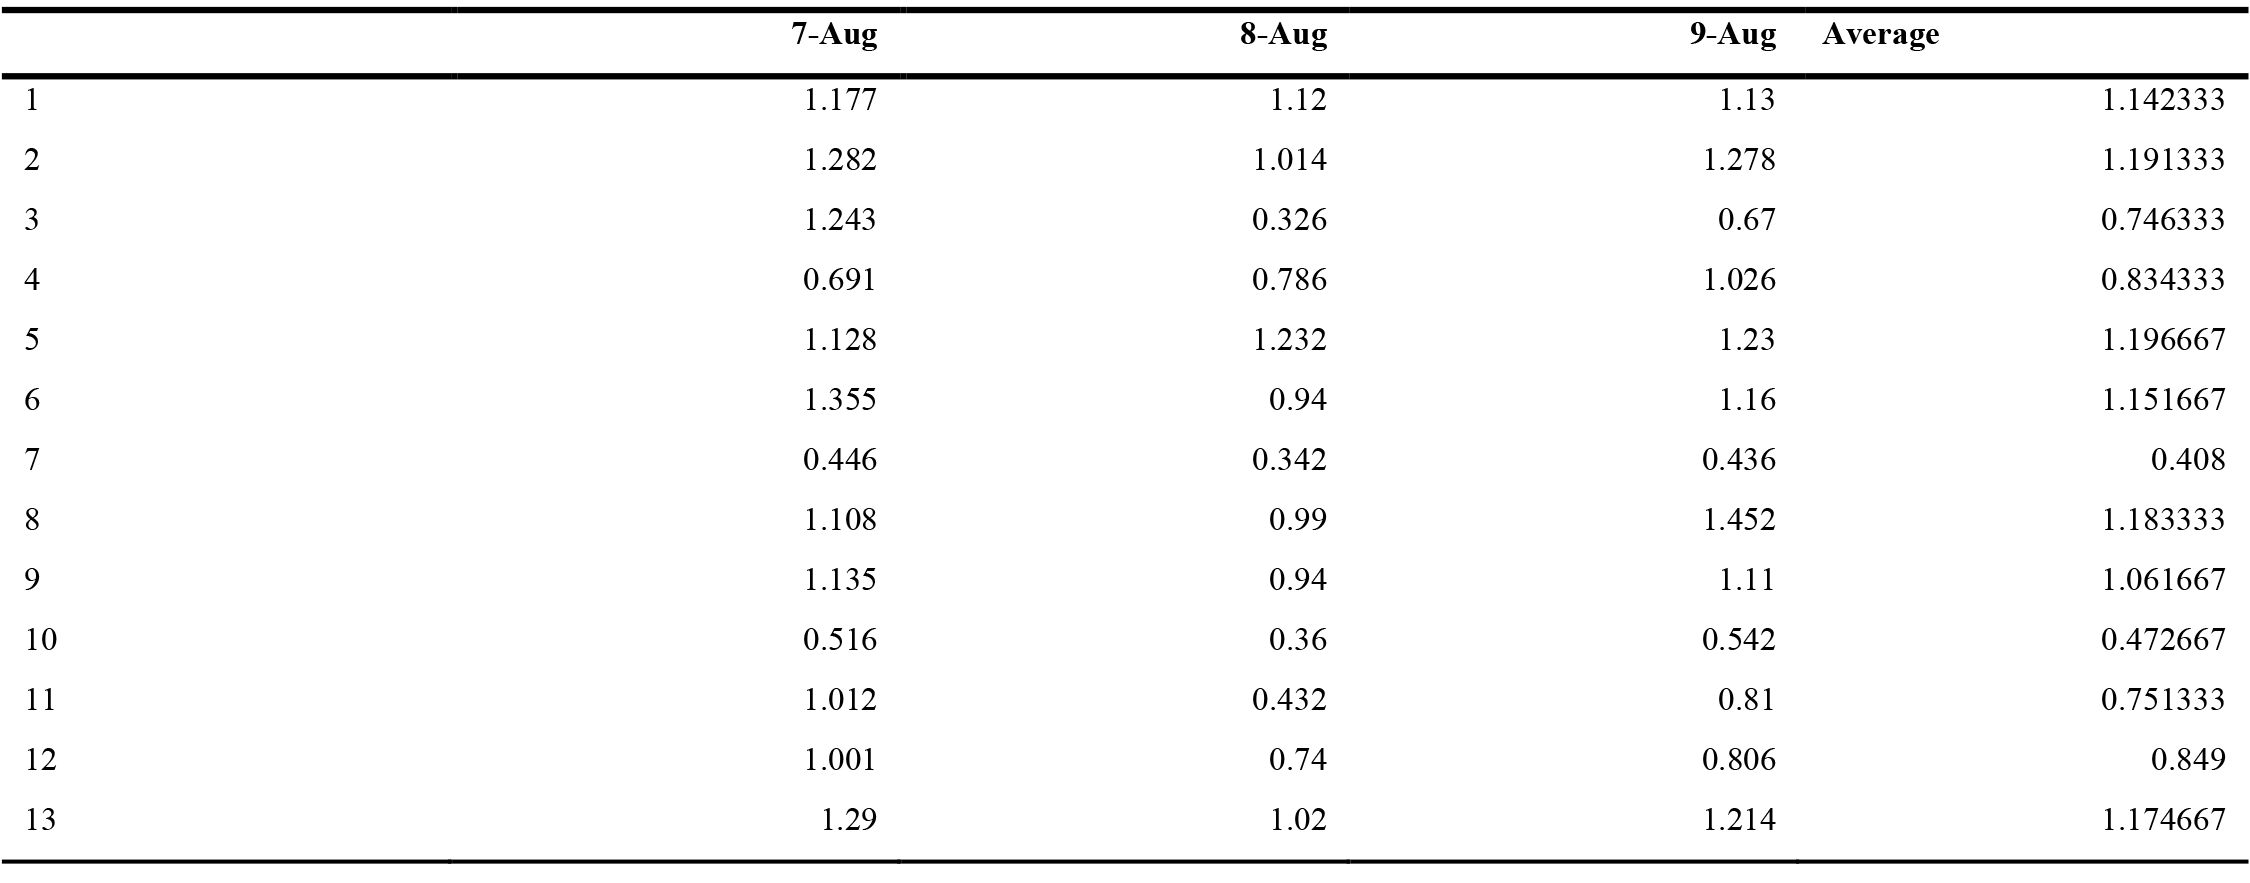
Table 2. The average value of wind speed in three days and the average value of total data.
4. CFD simulation
4.1. Computational model, domain, grid, and solution parameters
The city's setting model and layout meshing have been created using ArchiCAD 16.0 and Flow-3D (V11.2) [49]. The computational geometry of the research area produces in the software at scale 1:1. The dimensions of the computational domain are chosen based on the practice guidelines by Refs. [26,46] (Fig. 4). The domain includes a total area of 566 m × 258 m, containing all the buildings in two blocks. The height of the domain is 78 m where 39 m is the maximum building height. The downwind domain size is 200 m. For wind direction 270°, the domain dimensions are L x W x H = 566 x 258 x 78 m³. The mesh included 550 segments in the x-direction, 300 in the y-direction, and 50 in the z-direction, resulting in a grid with 11,390,184 cells in a Computational domain system. The computational grid is shown in Fig. 4.
Figure 4
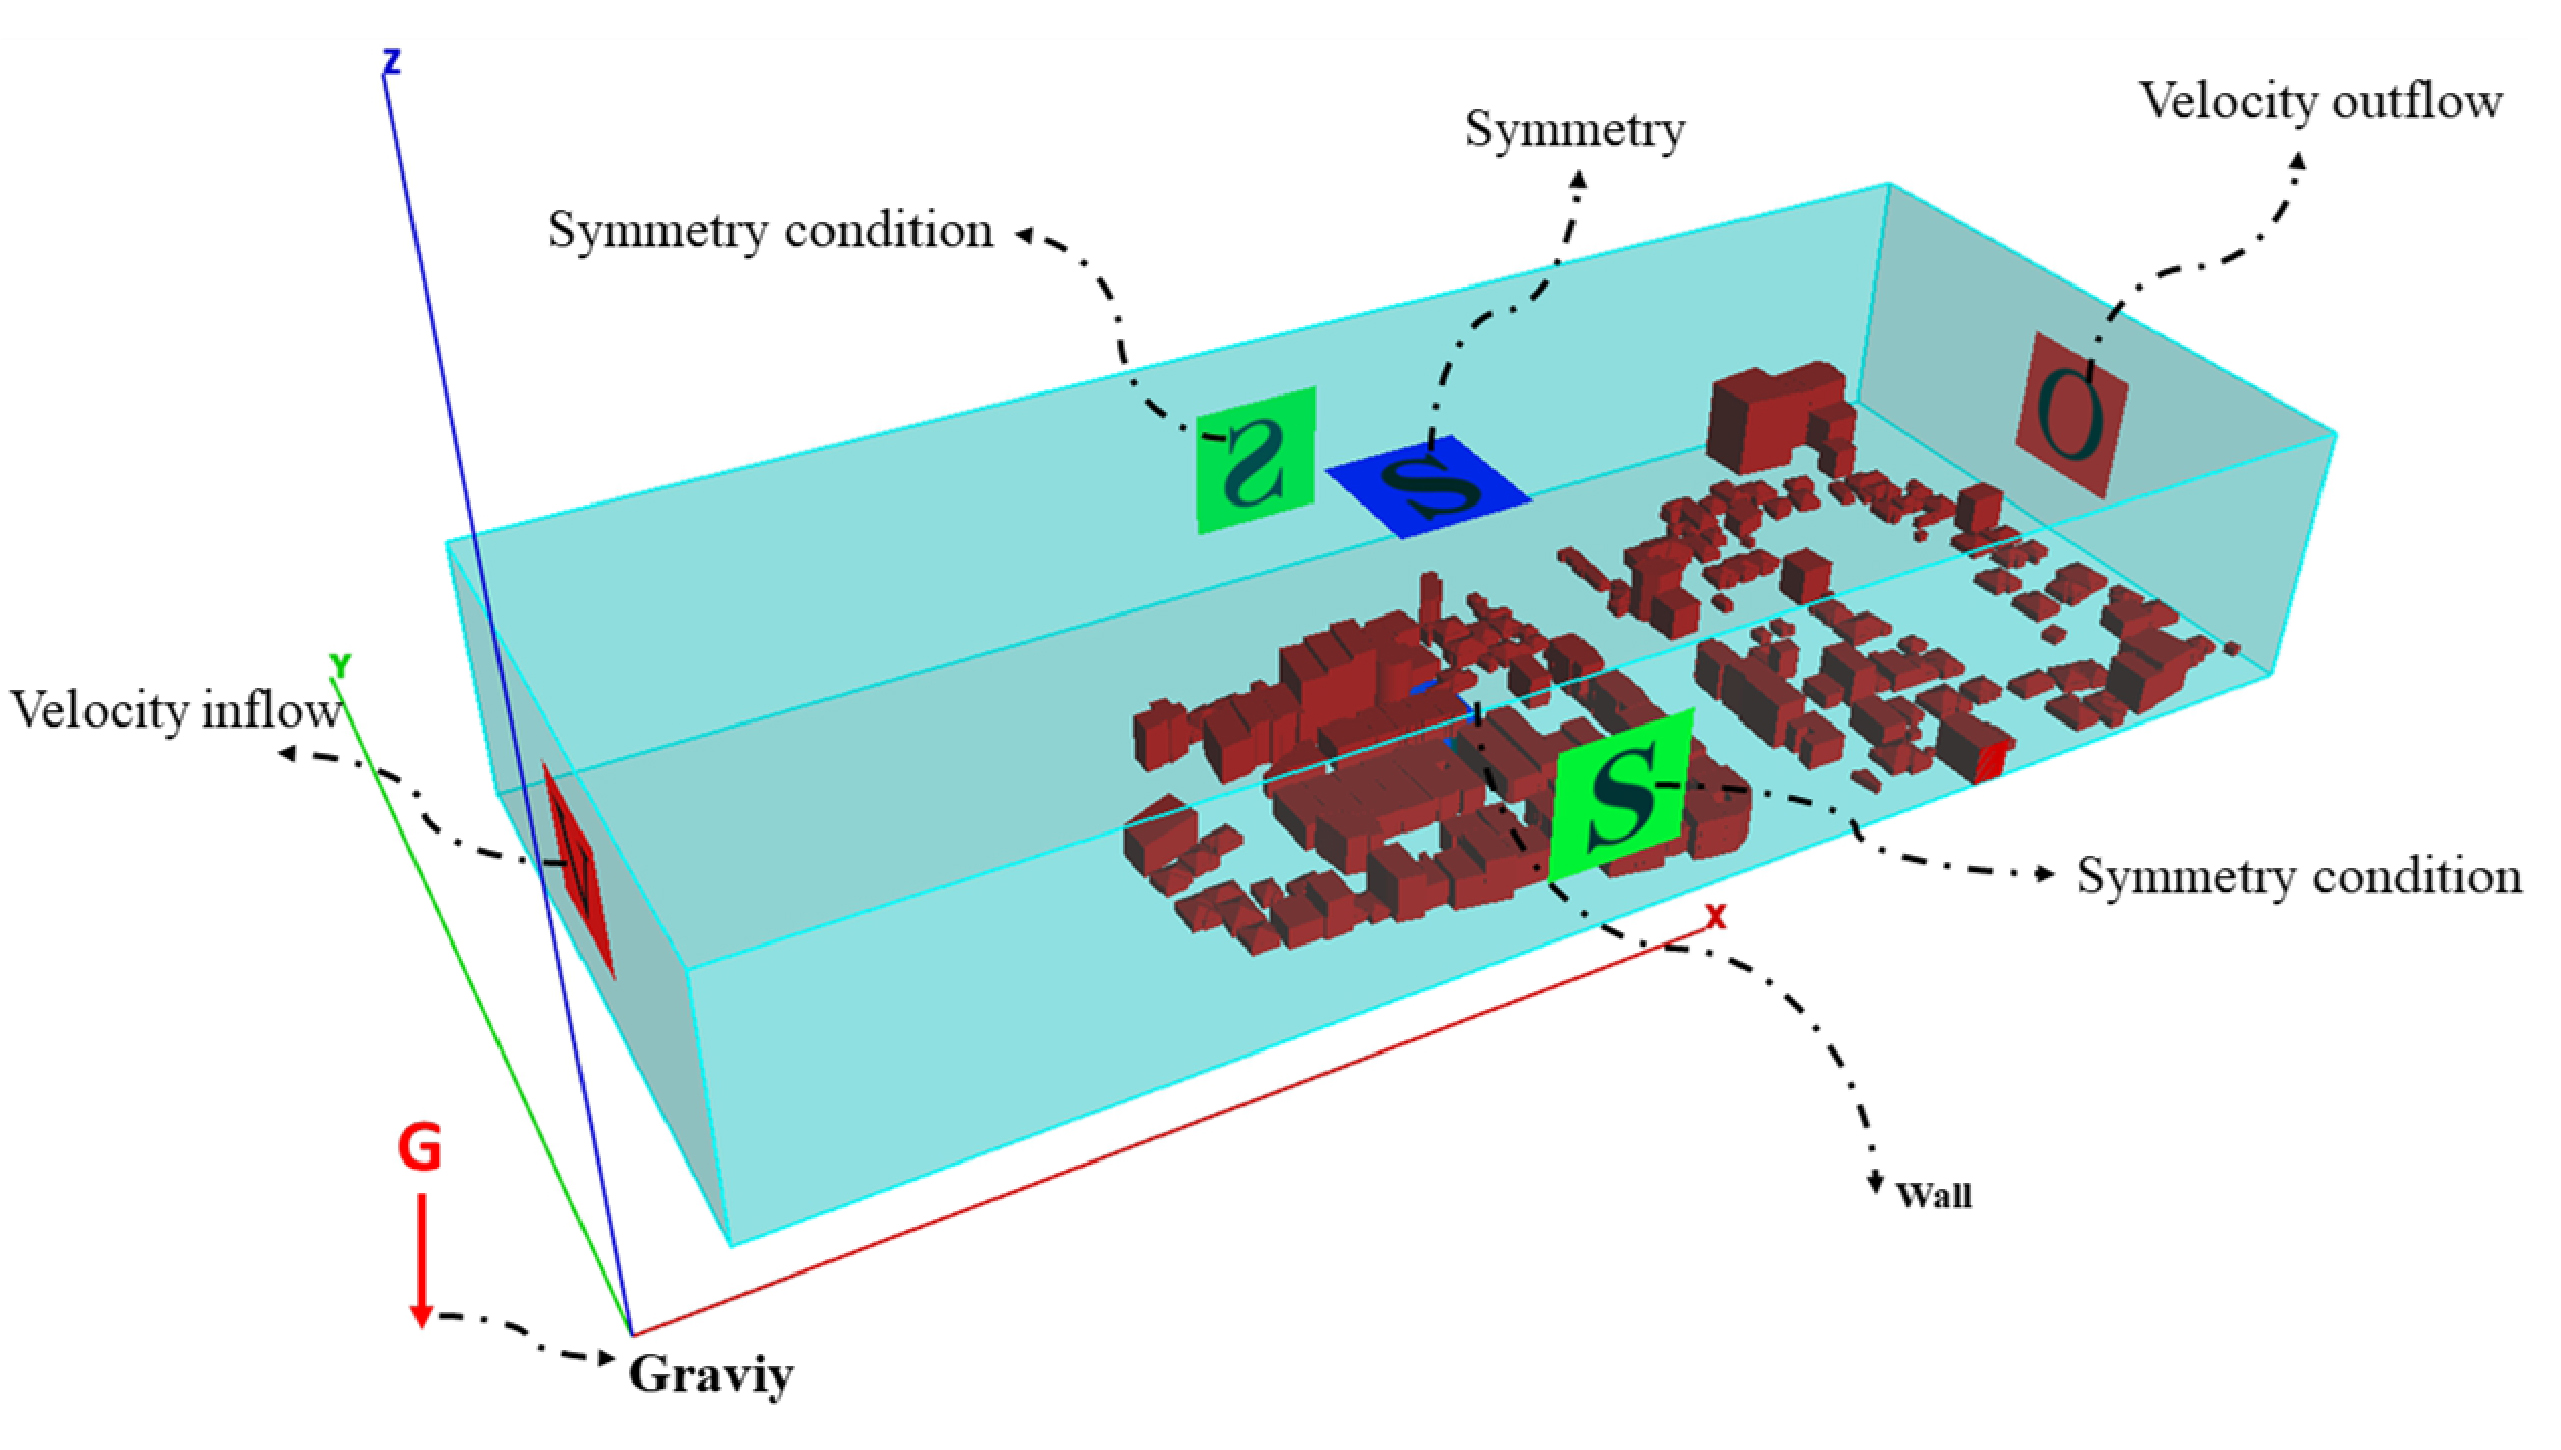
Fig. 4. 3D view of computational fluid dynamics domain with the sign of main dimensions and boundary conditions.
4.2. Boundary conditions
The boundary condition sorts are described in Fig. 3. As stated in the physical environment data, different inflow volume rates were determined in the model. The inflow status on the left side of the domain's fluid (y-z plane) is given as follows. The wind inlet boundary conditions are by the measured profiles of mean wind velocity along the middle line upstream of the model. The inflow wind velocity is 1.4 m/s. The orientation of the city’s setting has been selected according to the dominant wind direction. The aerodynamic length is assigned by the measured profiles of mean wind velocity. For the interior of the domain, the buildings are modeled clearly. It means that the model of buildings, the base plane of the simulation model, and building walls are modeled with z0 = 0 m. Sidewalls were assigned to the wall boundary condition. The velocity outflow status put is placed to the right side of the fluid (y-z plate) of the domain. At the outlet of the domain, zero static module pressure is applied.
4.3. Solver settings
The CFD simulations are performed using the commercial CFD code FLOW-3D (V11.2). FLOW-3D solves the flow field equations based on the finite volume method, which is a highly used type of numerical solution method [50]. There are different turbulent models which can be applied to the flow field cells, including Spalart-Allmaras, Standard K-ɛ, RNG K-ɛ, Realizable K-ɛ, and Reynolds Stress Model. RNG turbulent model is a reasonably accurate and robustious turbulent that applied to the model [51]. Based on literature reviews, RNG applied to the model, which is a robust, reasonably accurate, and robust turbulent model for modeling flow. The k-ε turbulence model can exactly describe the outdoor air environment. However, the outdoor wind environment is all the time changing, the steady-state model has been able to describe and solve the problem; therefore, it is used a steady-state model to calculate. K-e equations are derived from the application of a rigorous statistical technique (Renormalization Group Method) to the instantaneous Navier-Stokes equations. The solver setting equations can be written as follows: [51,52]
where xi and yi are the components of axes x and y. Ui are the average velocity component along the axes x, y and z, respectively; κ and ε are turbulent kinetic energy and turbulent dissipation rate, respectively; P is mean pressure, ρ is air density and v is the kinematic viscosity of air.
Equations for the RNG – Model:
4.4. Validation study
Validation by testing is a basic requirement for CFD studies in urban structures for accurate and reliable results. For real urban areas, field measurement in the study area is done directly to measure the data, but the suitable conditions for measuring the data for scientific use, especially for validation, can be a limitation. Due to the inherent instability of environmental conditions, it is necessary to accurately and completely measure the parameters of the urban area, including measurement setup and measurement accuracy, which will be possible with accurate and complete validation [53]. There are two types of on-site measurements: (1) measurements at fixed positions for a period of 6 months and (2) measurements on mobile posts (height 1.75 m) that are positioned at different positions on the selected days during the same period.
For validation purposes, on-site wind speed measurements have been conducted with 3D ultrasonic anemometers. Measurements were positioned at a height of 1.75 m and in 13 different positions, on 3 warm days in summer. The measurement positions are indicated in Fig. 5 [54].
Figure 5
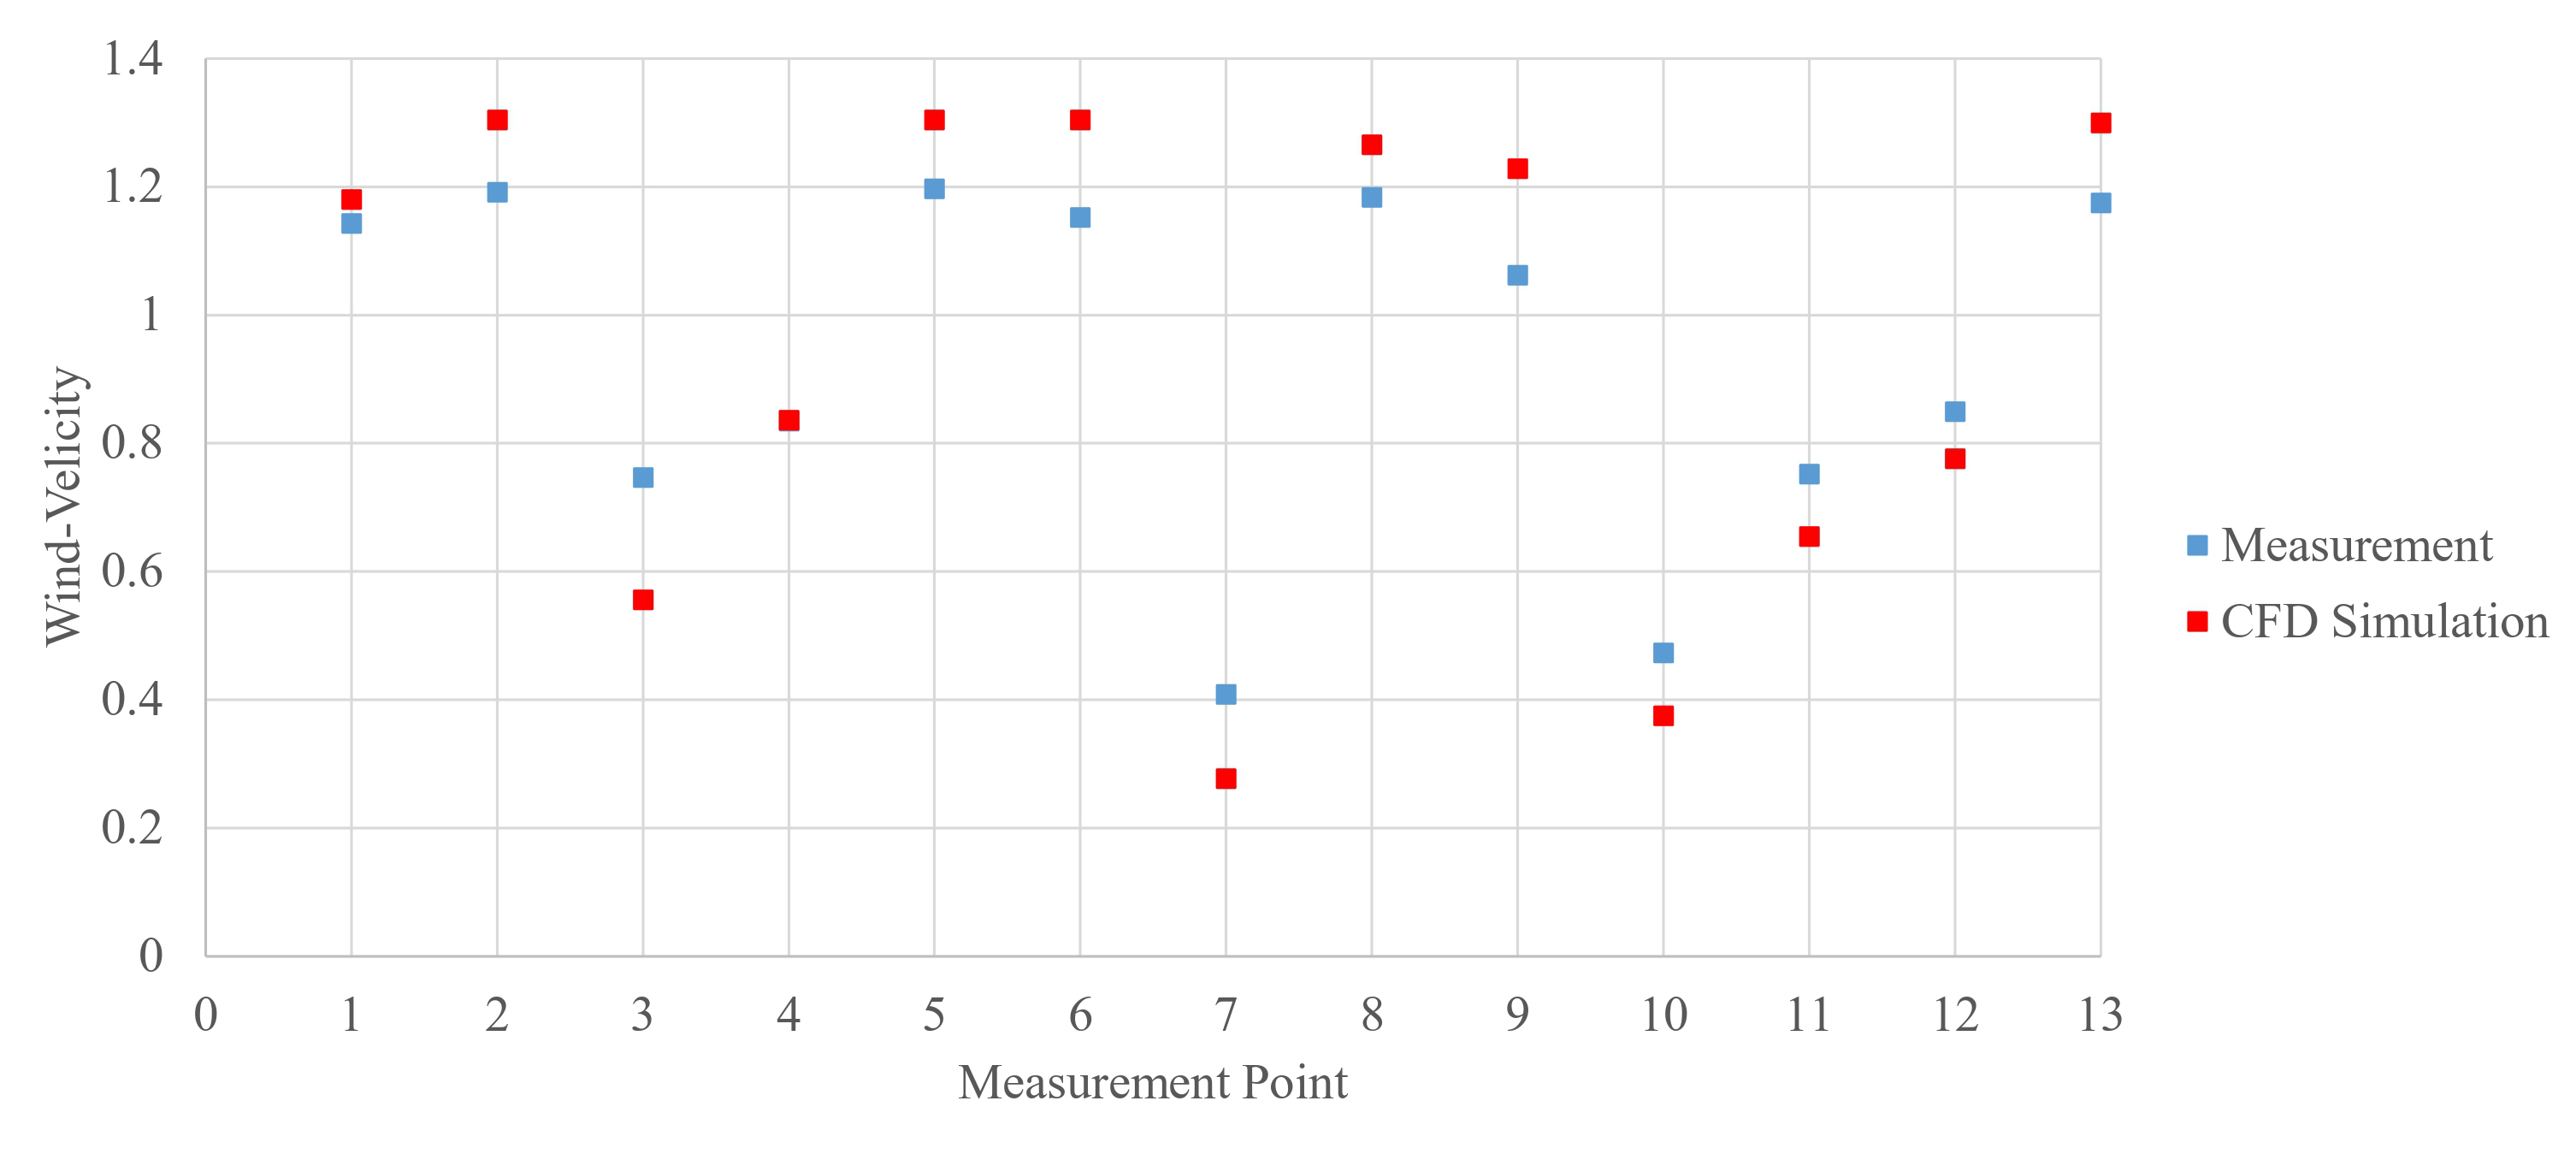
Fig. 5. The average of Wind speed CFD Simulation and Wind speed measurement points in 3 days.
The characteristics of the wind flow between the buildings are revealed through the field harvesting in the environment. CFD simulations with the present data can provide better analyses of the different aspects of the wind flow, although high-precision simulation is required. The velocity factor is recorded and compared in both the measurement and simulation environments.
Schatzmann and Leitl precisely explained the systematic differences between environmental data measurement, laboratory experiments, and RANS simulation. Measuring environmental data averages are 10 minutes to 30 minutes, but the results of the average RANS simulation time are quite consistent with theoretical time intervals because the environmental climate conditions change in 30 minutes [55]. Also, the measured environmental data in constant situations and the measured wind velocity average can be used in the validation data [54]. To validate the CFD simulations, on-site measurements must be performed for the actual configuration and then compared with CFD simulations performed using different turbulence models.
Two types of measurements (Fig. 5) have been conducted: (1) measurements at fixed positions for a period of 6 months and (2) measurements on 4 mobile posts (height 1.75 m) that were positioned at 12 different positions on windy days during the same period.
5. Result
5.1. Analysis of masses’ physical characteristics
After validating the CFD simulation, 45 points were selected due to their different physical condition in the simulated environment (Fig. 6). Parameters of wind velocity, mass orientation to the wind, the average height of buildings, and the width of space between masses were surveyed at the 45 points on the two urban blocks. Wind velocity is dependent on the orientation, enclosure, height of masses, and width between them.
Figure 6
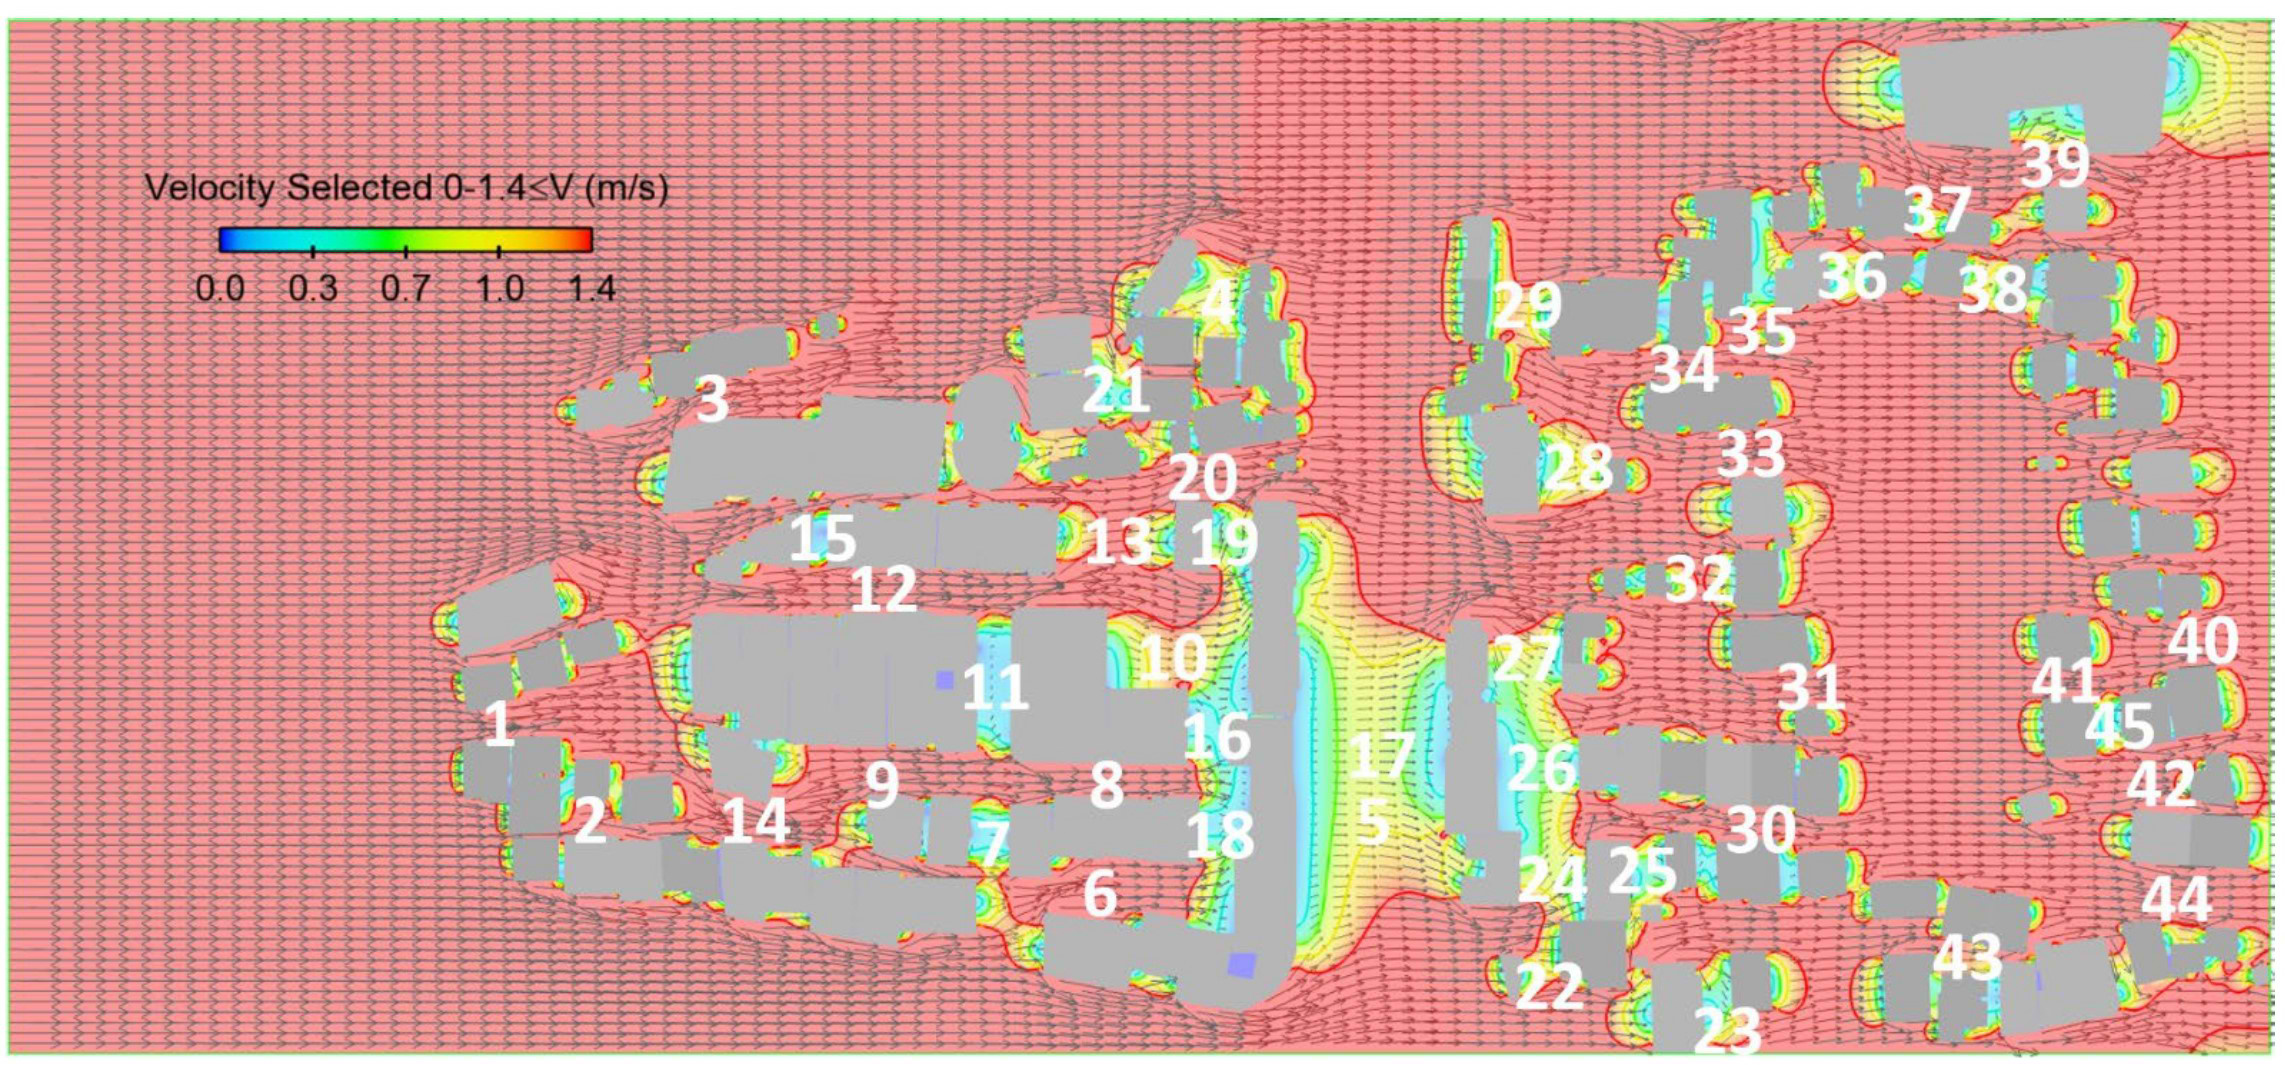
Fig. 6. Showing 45 points simulation area.
Wind velocity variations have been measured and all the factors influencing the flow pattern and wind velocity have been investigated. In Table 3, the correlations between the velocity and four variables are shown in the domain of the model. The linear regression analysis of variable factors and wind velocity has been presented in Fig. 7.
Table 3
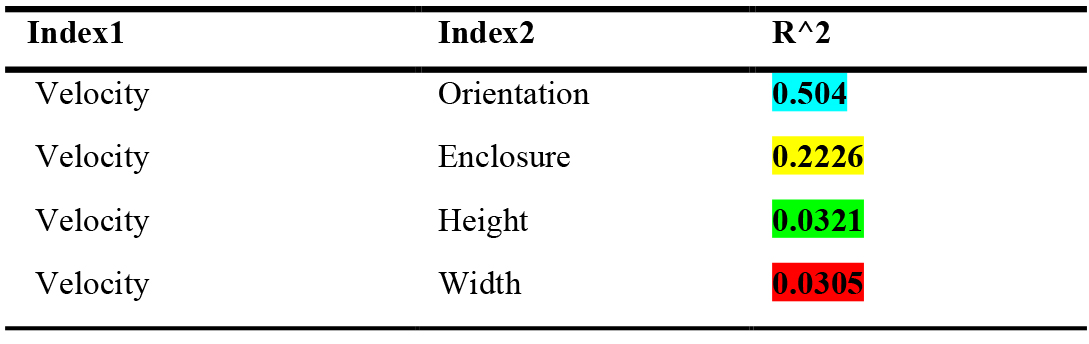
Table 3. Correlations between variable factors and wind velocity.
Figure 7
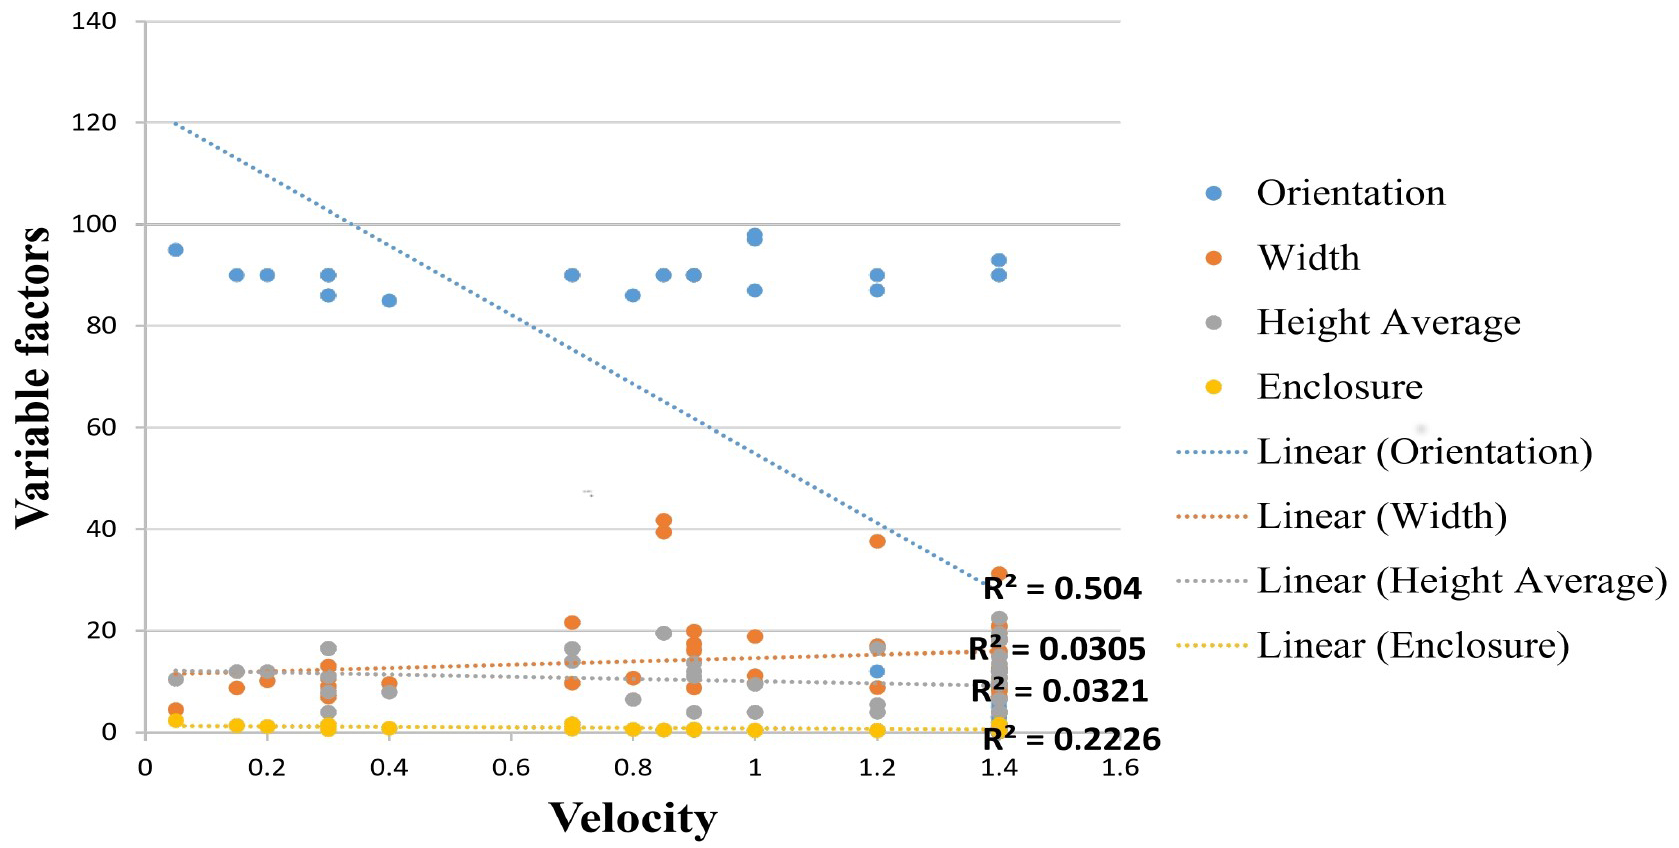
Fig. 7. Linear regression analysis of variable factors and wind velocity.
According to Table 3, the correlation of masses orientation to the wind is different from other factors. Its correlation coefficient is 0.504, and it has a significant positive correlation. When the mass's orientation reaches zero-degree, subsequently wind velocity increases and vice versa.
Correlation is significant between two variables of enclosure and wind velocity. Its correlation coefficient is 0.2226, and it has a positive correlation. It means that when the enclosure increases, the wind velocity increases too. Unlike this result, in some points, despite the high degree of enclosure, the wind flow rate is low, which may be due to changes in other variables.
The correlation between average building height and wind speed is 0.0321 and there is a 0.0305 correlation between width between building masses and wind velocity. The slope of the linear regression between variables is very weak, and it shows that their effect on wind velocity at a pedestrian level is not significant.
5.1.1. Points with different behavior
In Table 4, in the points where the behavior is different from the results, the correlation test between 4 variables and velocity is repeated. It is observed in Fig. 8 that the correlation of the mass's orientation, enclosure, height, and width are 0.0106, 0.5376, 0.0854, and 0.0034 respectively. There is the least correlation between the velocity and masse's orientation. The correlation between the velocity and the width between masses is also low, it can be concluded that a weak correlation between width between masses and velocity leads to a very weak correlation between the mass's orientation and the velocity.
Table 4
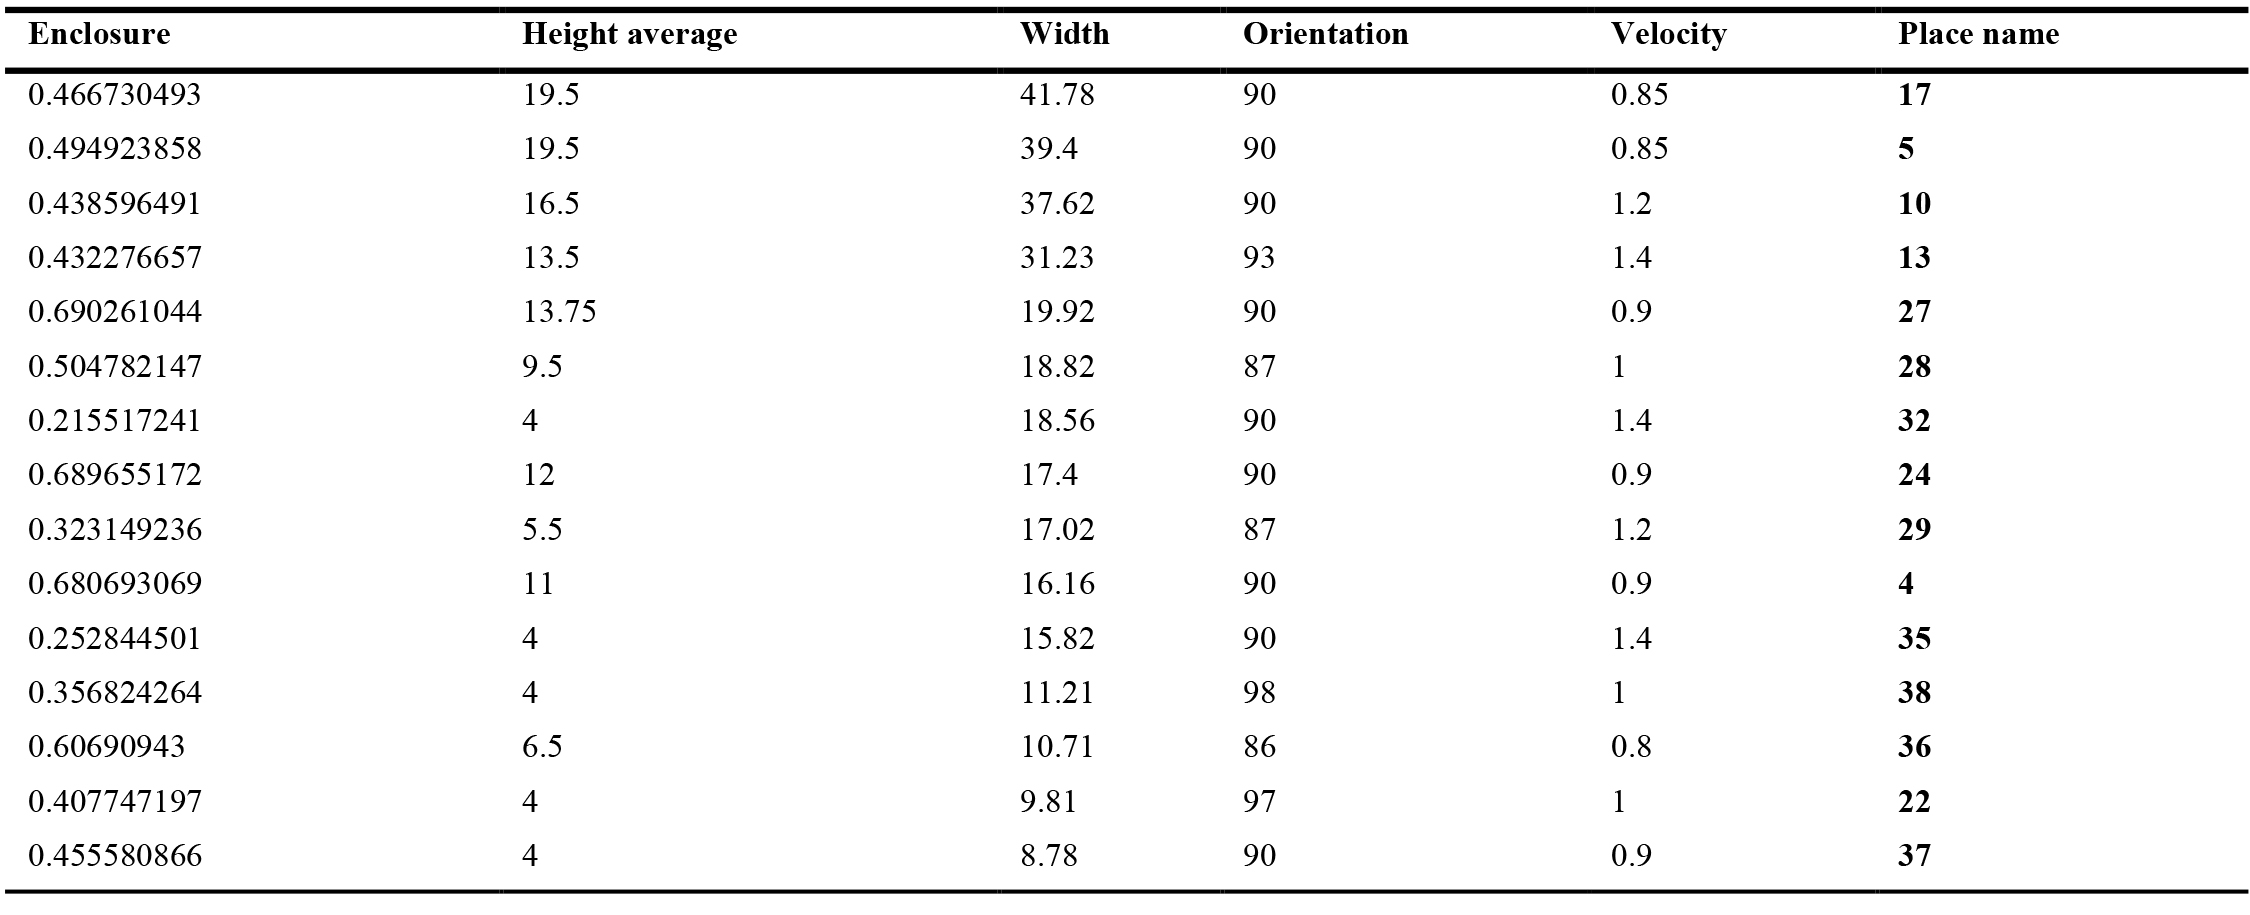
Table 4. Excluding 15 data measurements.
Figure 8
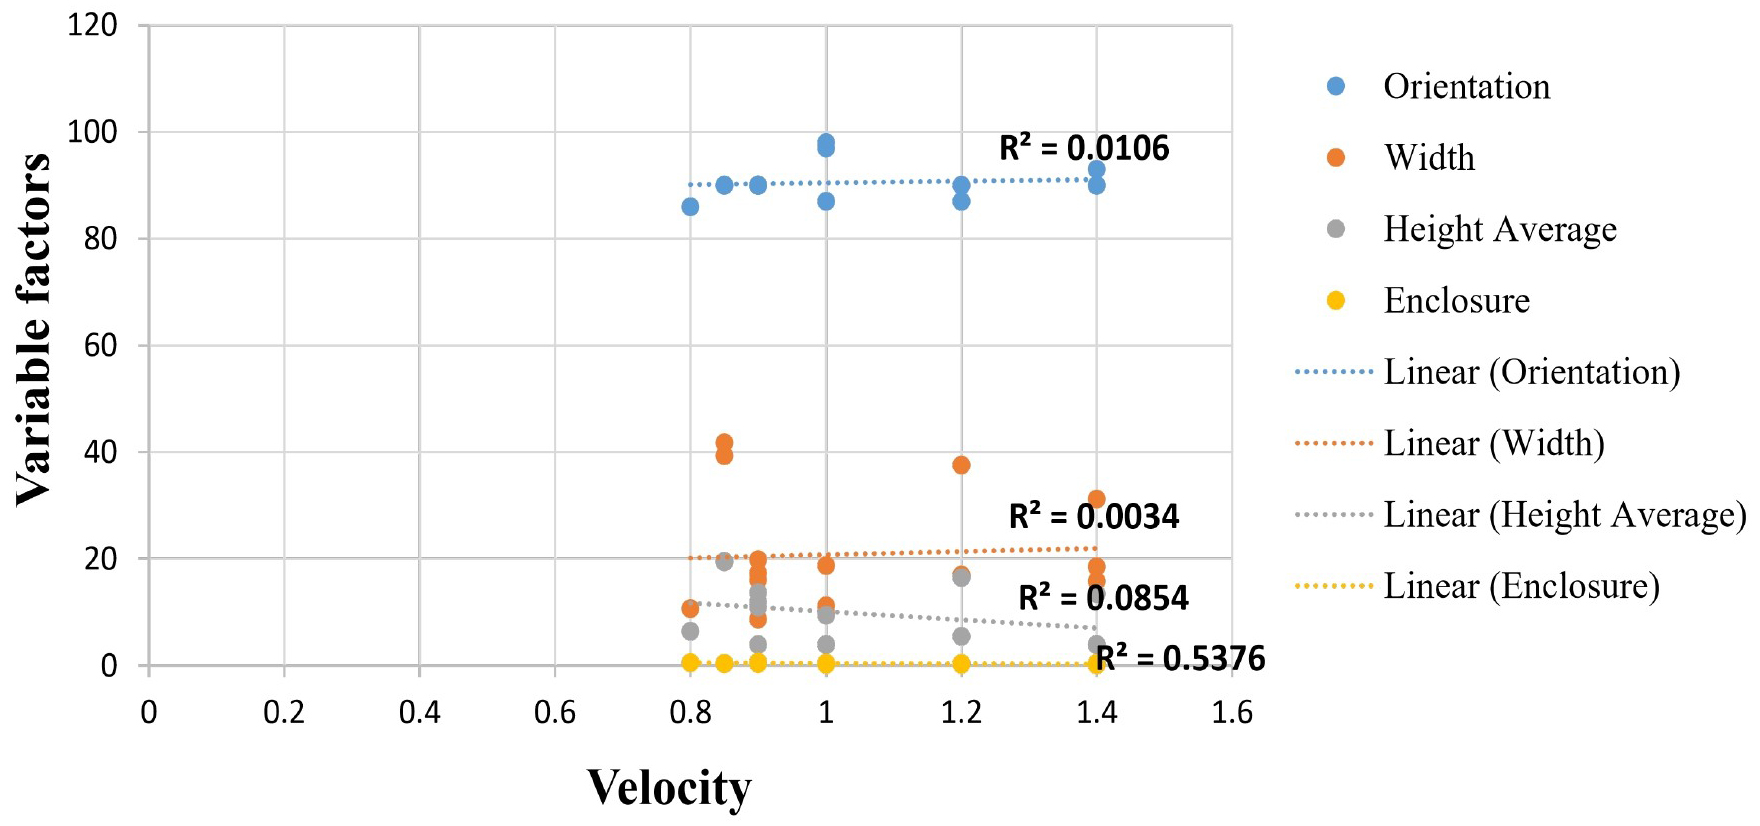
Fig. 8. Linear regression analysis of variable factors and wind velocity at 15 points.
5.1.2. TOPSIS statistical test
The proximity correlation coefficient of the four variables (orientation, enclosure, average height, and width between masses) and the wind velocity are calculated with the TOPSIS statistical test. The theoretical foundations of this technique are based on this relationship, which at first has been calculating the positive ideals (the most efficient mode) and the negative ideals (the least inefficient mode) for each of the variables; Then, the distance has been calculated for each Variable from positive ideals and negative ideals. The selected Variable has the least distance from the negative and the most distance from the positive ideal. According to this test, the proximity correlation coefficient of four variables is shown in Fig. 9, and they have a positive correlation with the velocity. The variables of orientation and enclosure have a high correlation. The mass's orientation reaches zero-degree; subsequently, the wind velocity increases, and if the enclosure increases, the wind velocity will increase too. This correlation shows that the meaningful relationship is between the two variables (orientation, enclosure) and wind velocity, so these parameters must be considered carefully in the design and development process of urban spaces.
Figure 9
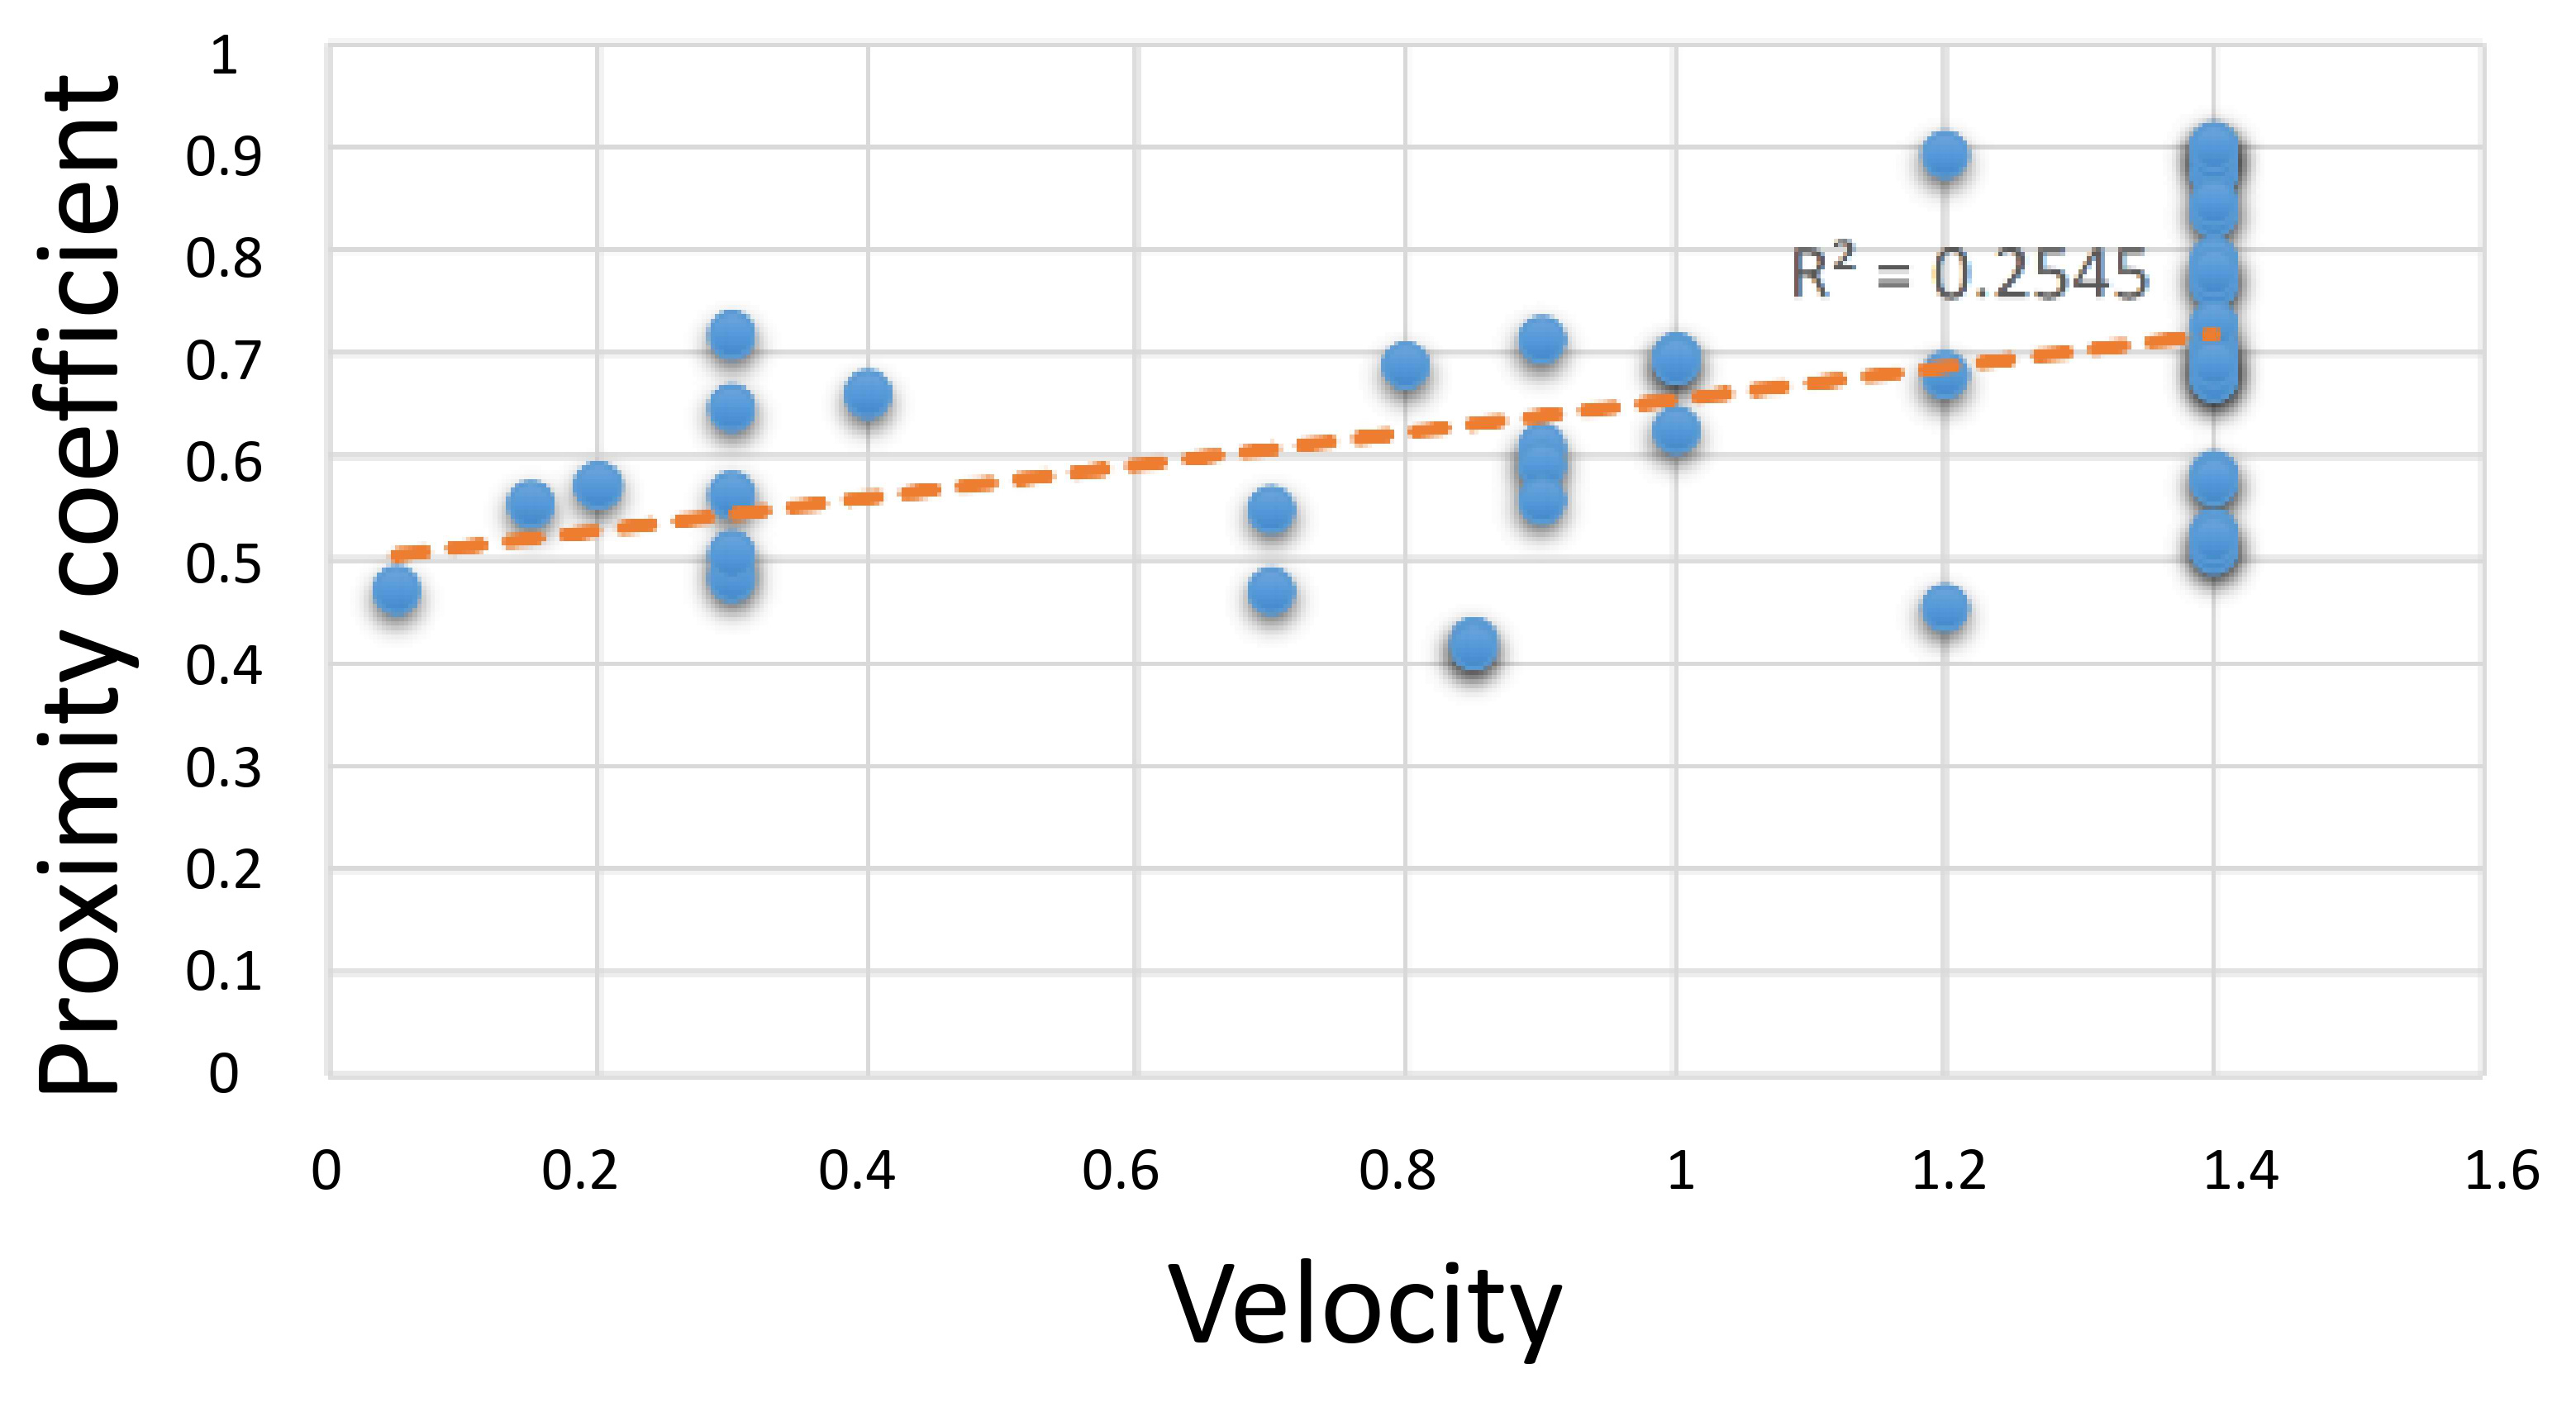
Fig. 9. Linear regression analysis coefficient of the proximity of 4 variables dependent and function variable (velocity).
The changing cities due to the consecutive rise of multi-story buildings in the urban environment necessitates a detailed computational and physical modeling to optimize the design of new buildings and control the exposure of the residents to humid air. In this study, the urban block development effects on wind flow in an urban environment were evaluated. In the first step, 3D steady-state RANS simulations were performed on the northern urban blocks of Babolsar. The following observations can be made:
- The results clearly show that the orientation of the building's mass reaching zero-degree can have positive effects in increasing wind velocity on-site, and the wind velocity increases along with the mass. Thus, the building's mass orientation must be in the same direction as the wind flow.
- The enclosure has a significant impact on the wind velocity. The height and width between masses have little effect on the wind velocity and direction alone. But the enclosure with an appropriate and balanced height and width can create a suitable condition for wind flow.
5.2. Suggested alternatives for two main effective factors in this area
Suggestions have been made to modify areas incompatible with the environmental comfort conditions according to the results of the current situation simulation in Fig. 10.
Figure 10
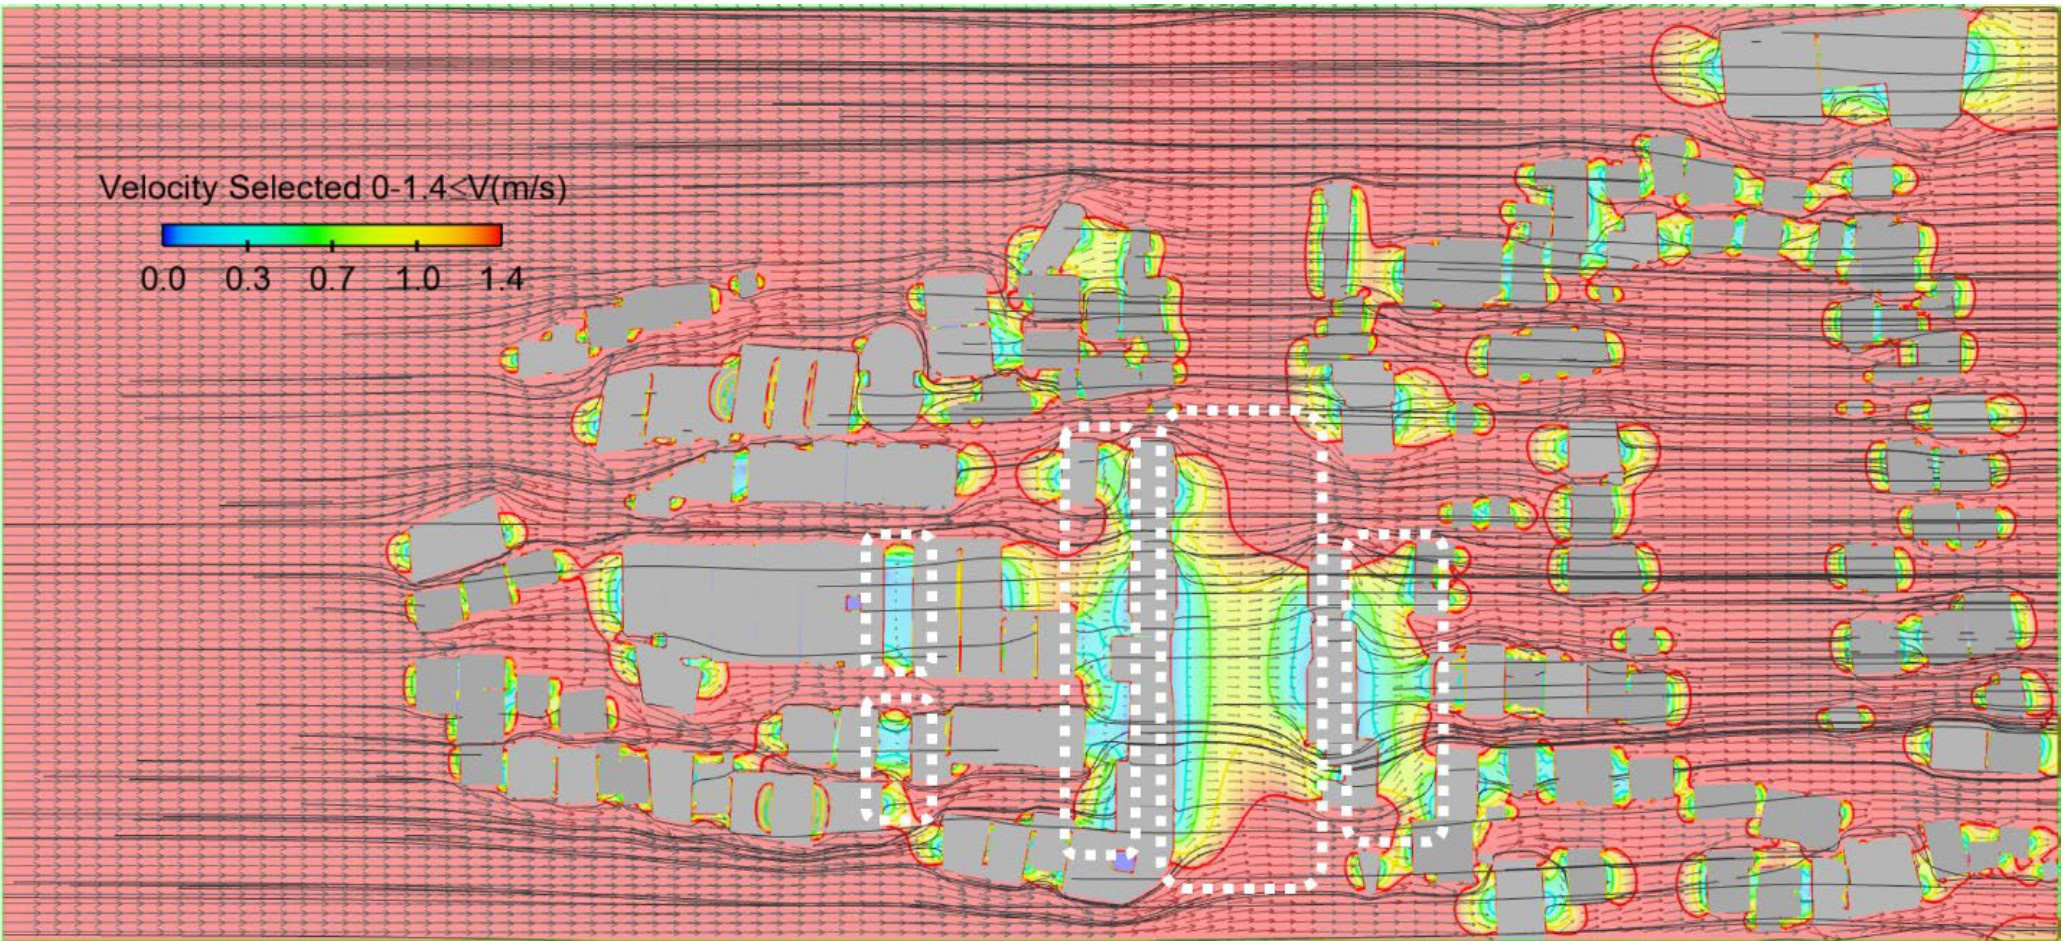
Fig. 10. Incompatible areas to environmental comfort conditions.
To this purpose, the variables of masses orientation to dominant wind and enclosure have been examined in the form of distinct proposed options for solving the problem
5.2.1. Create an opening to change the wind direction into the masses
5.2.1.1. Strategy No. 1: Creating permeability by opening along the passage in the prevailing wind direction
The line graphs show the numeral of wind velocity before and after the physical modification at the pedestrian level of 0-1.75 m and above 1.75 in the distance between 0-50 m in Fig. 11. Before and after the modification, the velocity graphs show different reactions. There is a gradual decrease in the velocity profile before modification followed by a rise after a constant value of 0 where the construction was built, but after the modification, there is a soft increase in velocity, followed by a rise, and then a drop. As can be seen, the velocity profile shows a big rise in velocity after modification due to the eliminating of the part of the building mass obstructing the prevailing wind direction.
Figure 11
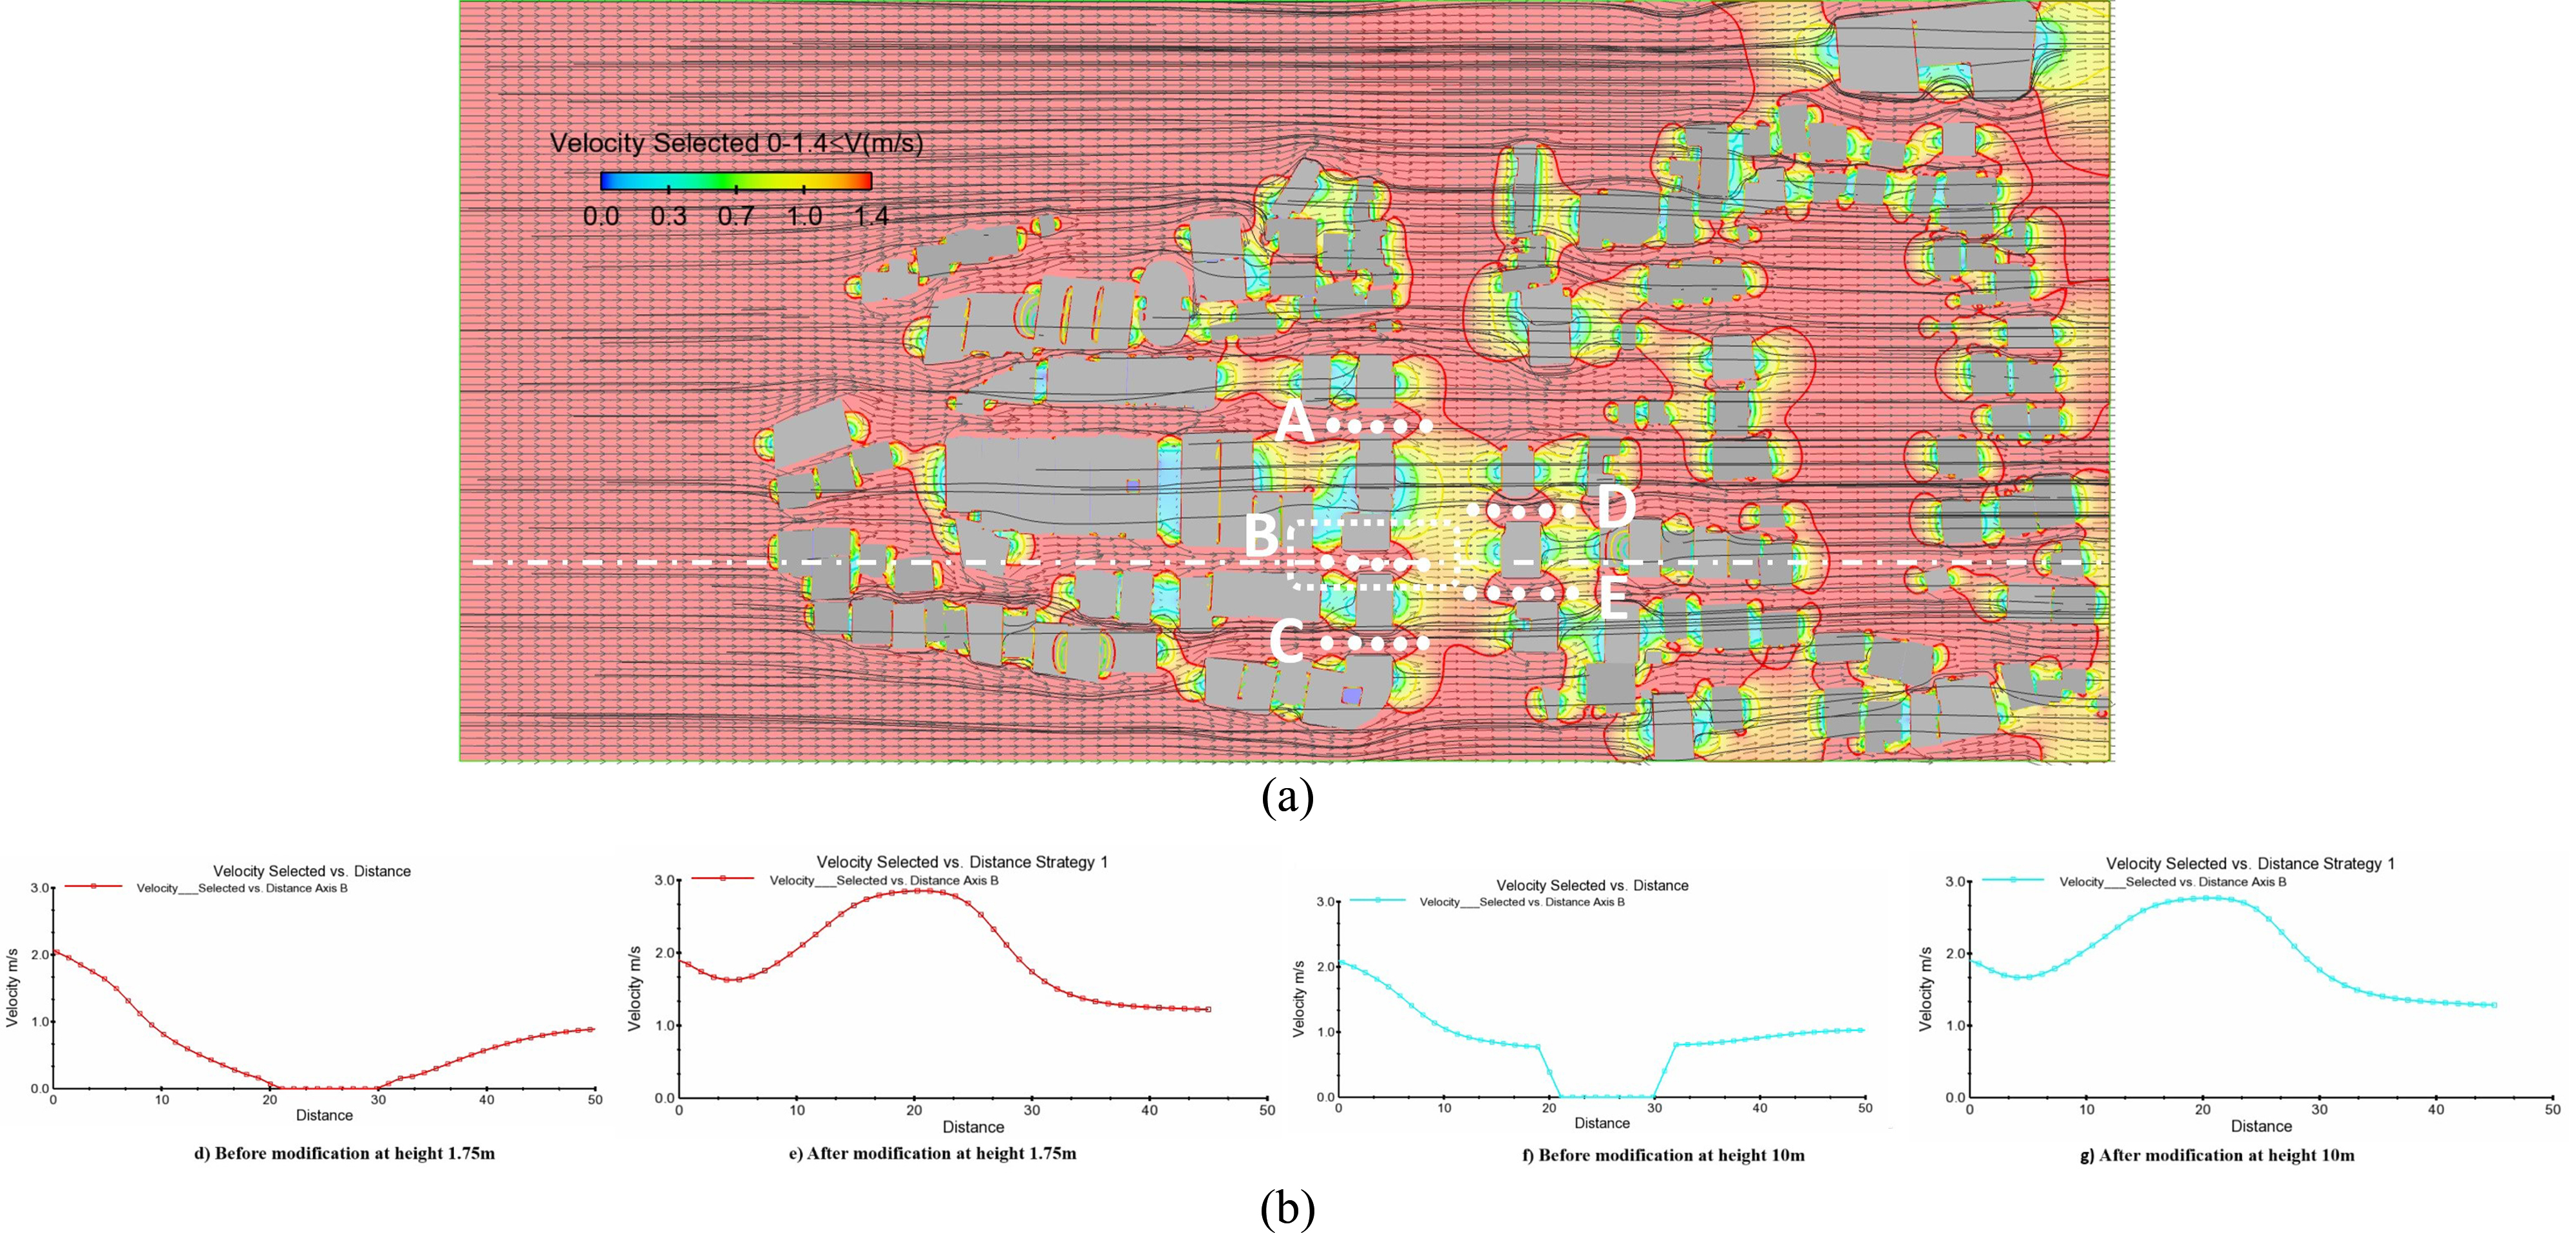
Fig. 11. (a) Modification plan and simulation of creating an opening along the passage in the prevailing wind direction and (b)Elaborate comparison between wind flow profiles of before and after modification of creating an opening in the axis B section.
5.2.1.2. Strategy No. 2: Creating permeability by opening along the passage on the ground floor in the prevailing wind direction
As in the strategy of opening along the passage in the prevailing wind direction (strategy No.1), the modifications were done at two levels in the distance between 0-50 m. At the pedestrian level, the before and after modifications are the same as in strategy No.1. However, above the pedestrian level at height 10 m, there is a sharp decrease in velocity profile after modification, followed by a rise after a constant value of 0 where the construction was built. As can be seen in Fig. 12, the velocity profile shows a clear fall in velocity after modification at height 10m due to the eliminating of the part of the building mass on the ground floor obstructing the prevailing wind direction.
Figure 12
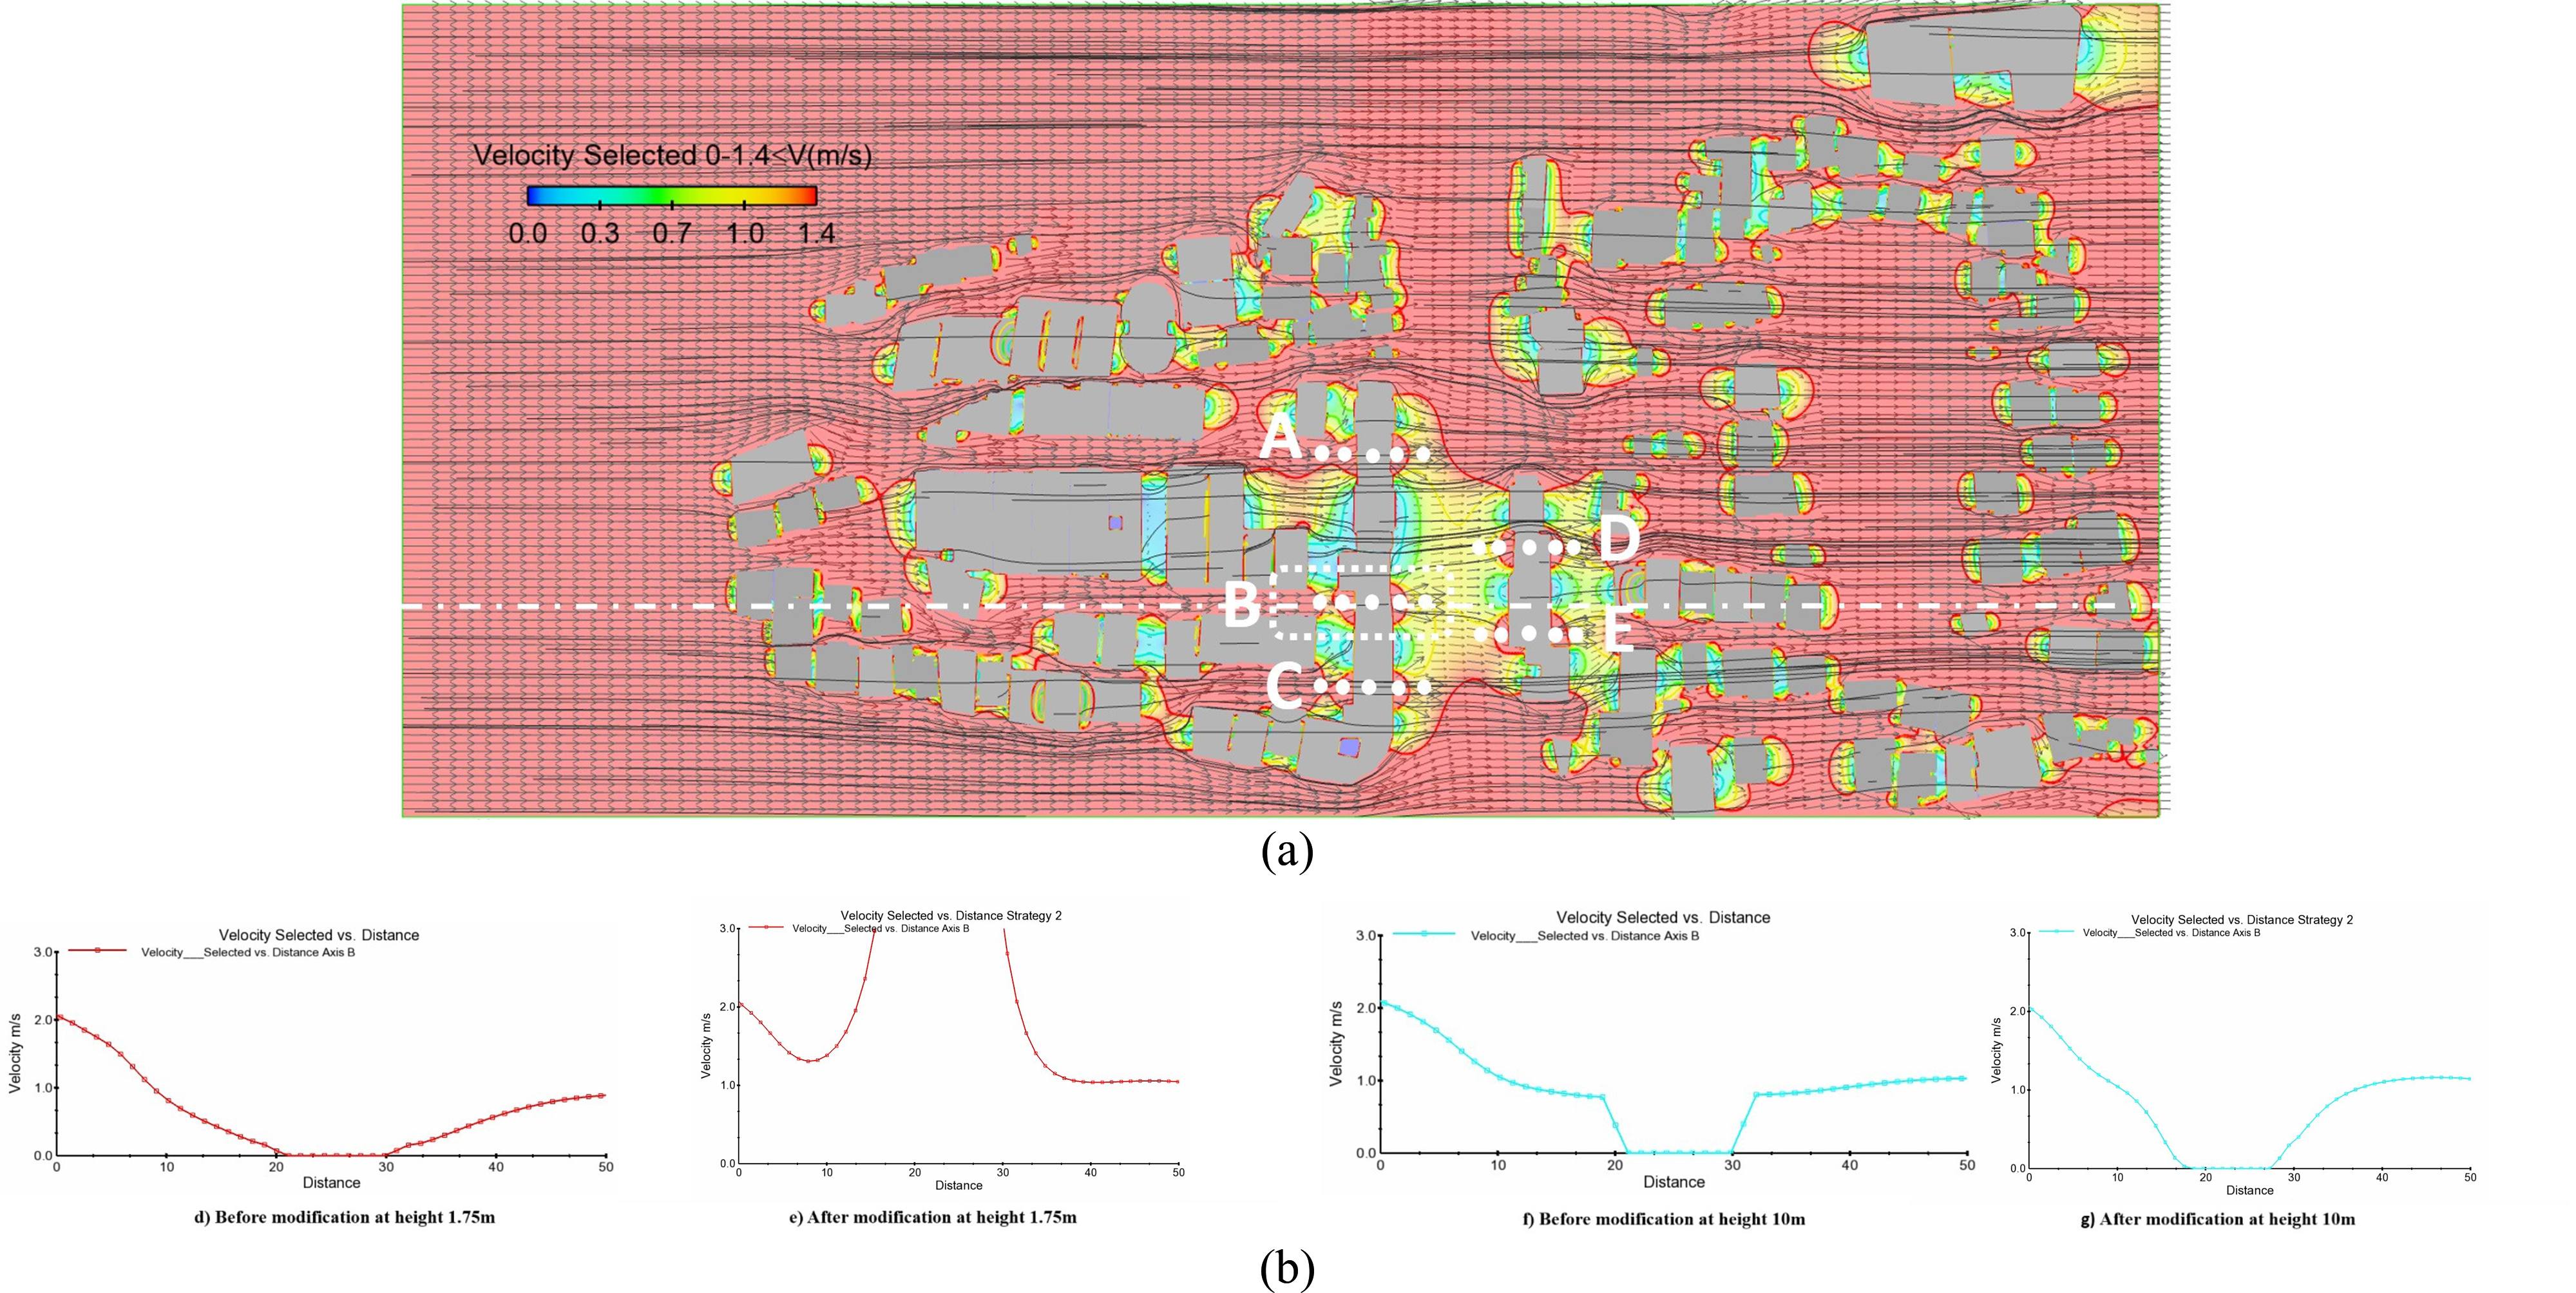
Fig. 12. (a) Modification plan and simulation of creating an opening along the passage on the ground floor and (b) Elaborate comparison between wind flow profiles of before and after modification of creating an opening along the passage on the ground floor in the axis B section.
5.2.1.3. Strategy No. 3: Creating open space between building masses by separating buildings in the wind direction
In Fig. 13, the strategy of creating open space between building masses by separating buildings in the wind direction is presented. The line graphs show wind velocity of the physical modifications at 1.75 m and 10m in the distance between 0-150 m. The velocity graphs show different reactions before and after the modification at both levels (at 1.75 m and 10 m) like the strategy of creating permeability by opening along passage (strategy No.1). There is a sharp decrease in velocity profiles before the modifications, followed by a sharp rise after a constant value of 0 where the constructions were built, but there is a sharp increase in velocity followed by a fall and then a rise in velocity profiles after modification. As can be seen, the velocity profiles show a large rise in velocity after modification due to creating open space between building masses in masses separation in the wind direction.
Figure 13
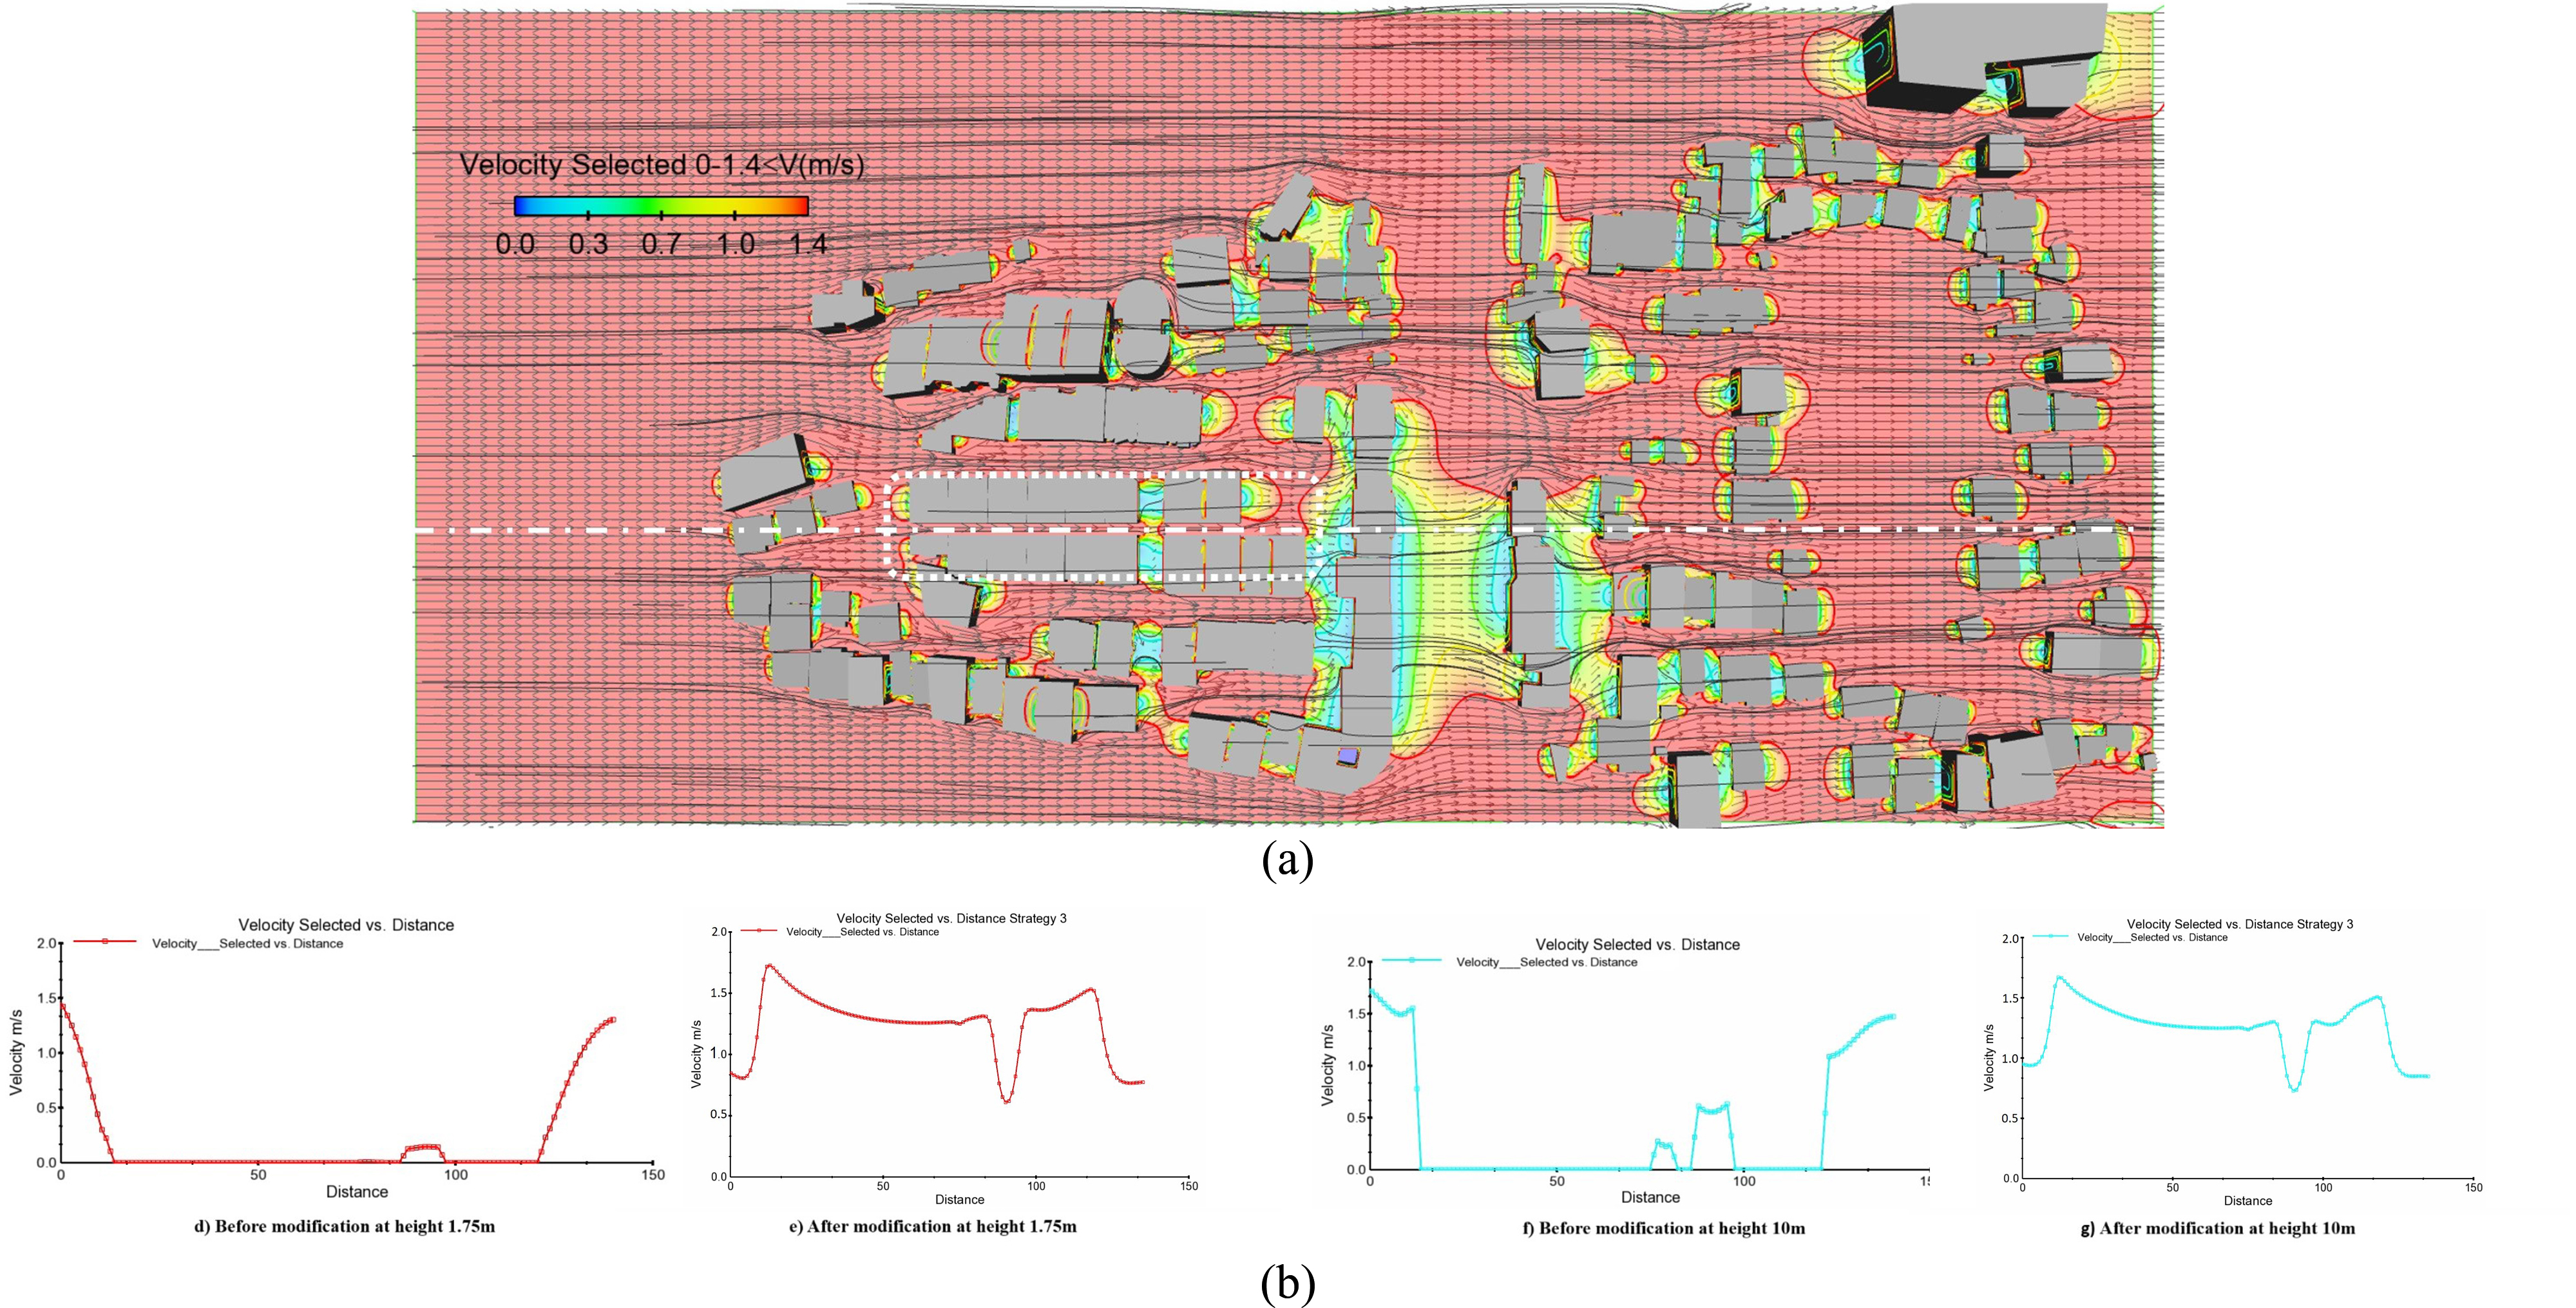
Fig. 13. (a) Modification plan and simulation of creating open space between building masses by separating buildings (b) Elaborate comparison between wind flow profiles of before and after modification of creating open space between building masses by separating buildings in the axis B section.
5.2.1.4. Strategy No. 4: Creating open space between building masses on the ground floor of masses aggregation in the wind direction
As in the strategy of creating open space between building masses by separating buildings in the wind direction (strategy No.3), the modifications are done at a distance of 0-150 meters in Fig. 14. At the pedestrian level, before and after are like in strategy No.3. However, above the pedestrian level, there is a sharp decrease in the velocity profiles before and after modifications, followed by a sharp rise after a long constant value of 0 where the constructions were built. As can be seen, the velocity profile shows a clear drop in velocity after the modification at10 m due to the eliminating of the open space between the building mass on the ground floor obstructing the prevailing wind direction.
Figure 14
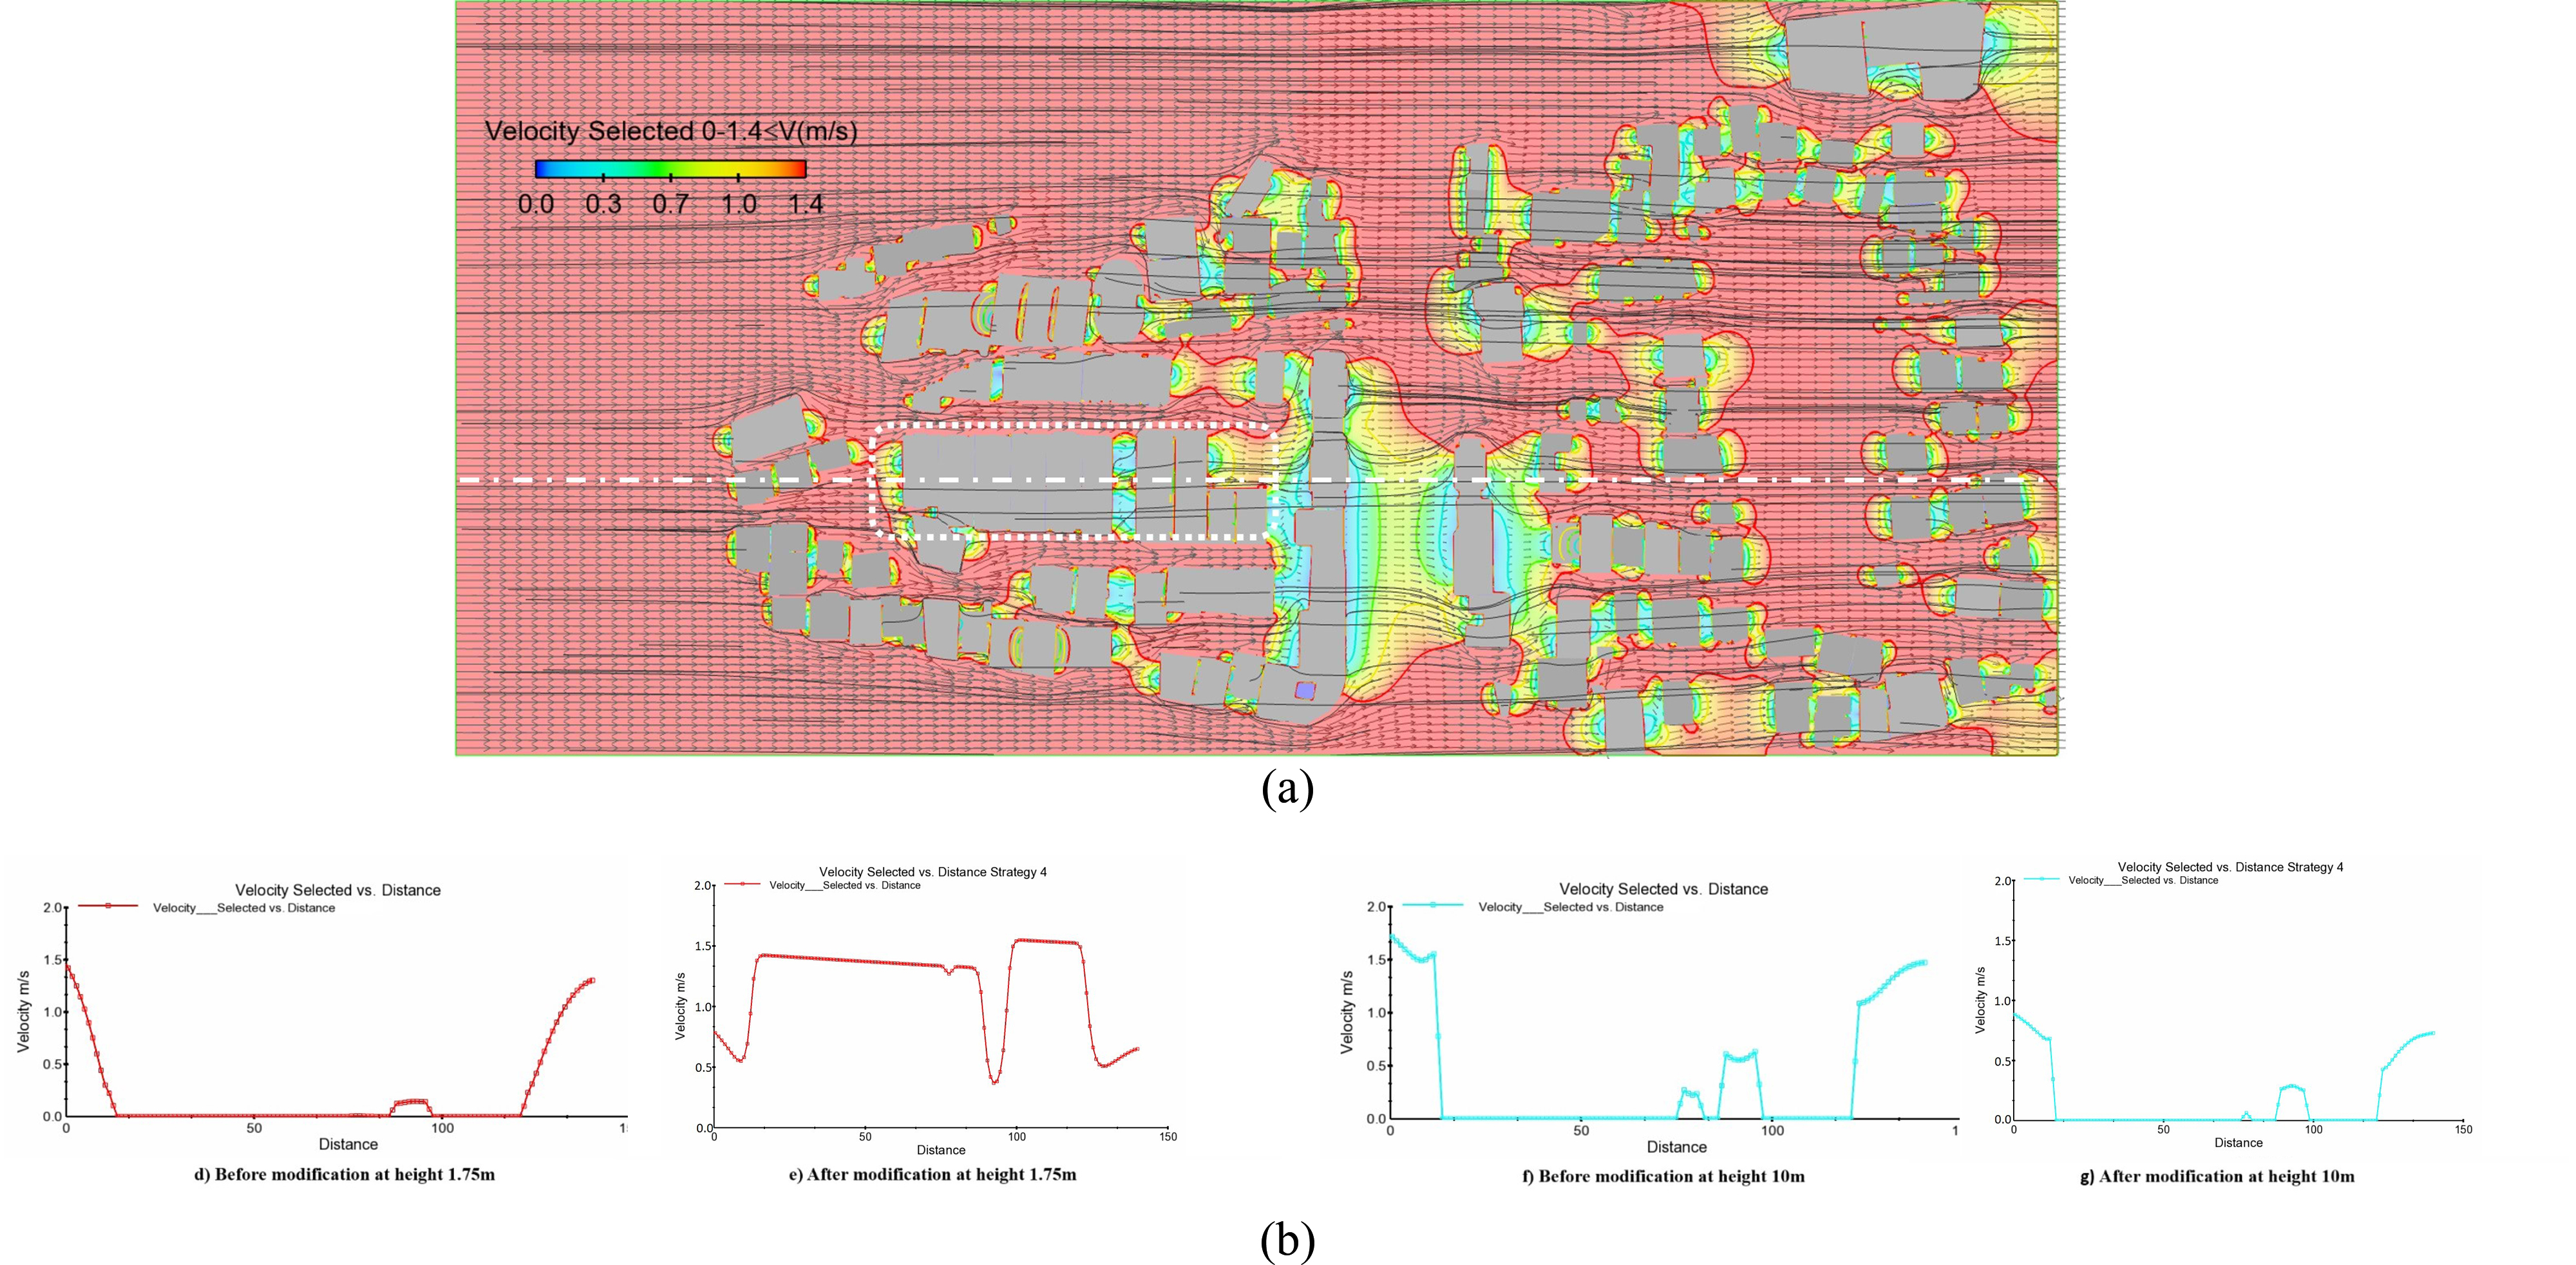
Fig. 14. (a) Modification plan and simulation of Creating open space between building masses on the ground floor of masses aggregation and (b) elaborate comparison between wind flow profiles of before and after modification of Creating open space between building masses on the ground floor of masses aggregation in the axis B section.
5.2.2. Enclosure between the masses
5.2.2.1. Strategy No. 5: Changing passage width A and B to 1/5A and 1/5B – changing enclosure E and E’ to 0.66E and 0.66E’ between masses
In the second part of the alternative suggestion, three alternatives of enclosure modifications are suggested in Figures 15-17. The line graphs show the wind velocity by changing passage width A and B to 1/5A and 1/5B, as a result changing enclosure E and E’ to 0.66E and 0.66E’ between masses. The modifications are displayed at 2 levels based on the previous ones (at height 1.75 m & 10 m) in the distance between 0 – 150 m in Fig. 15 for two axes (A&B). If you pay attention to before and after the modifications, it can be seen that there is no noticeable change in the velocity profiles. This means that increasing the proposed width is not enough to change the wind velocity conditions.
Figure 15
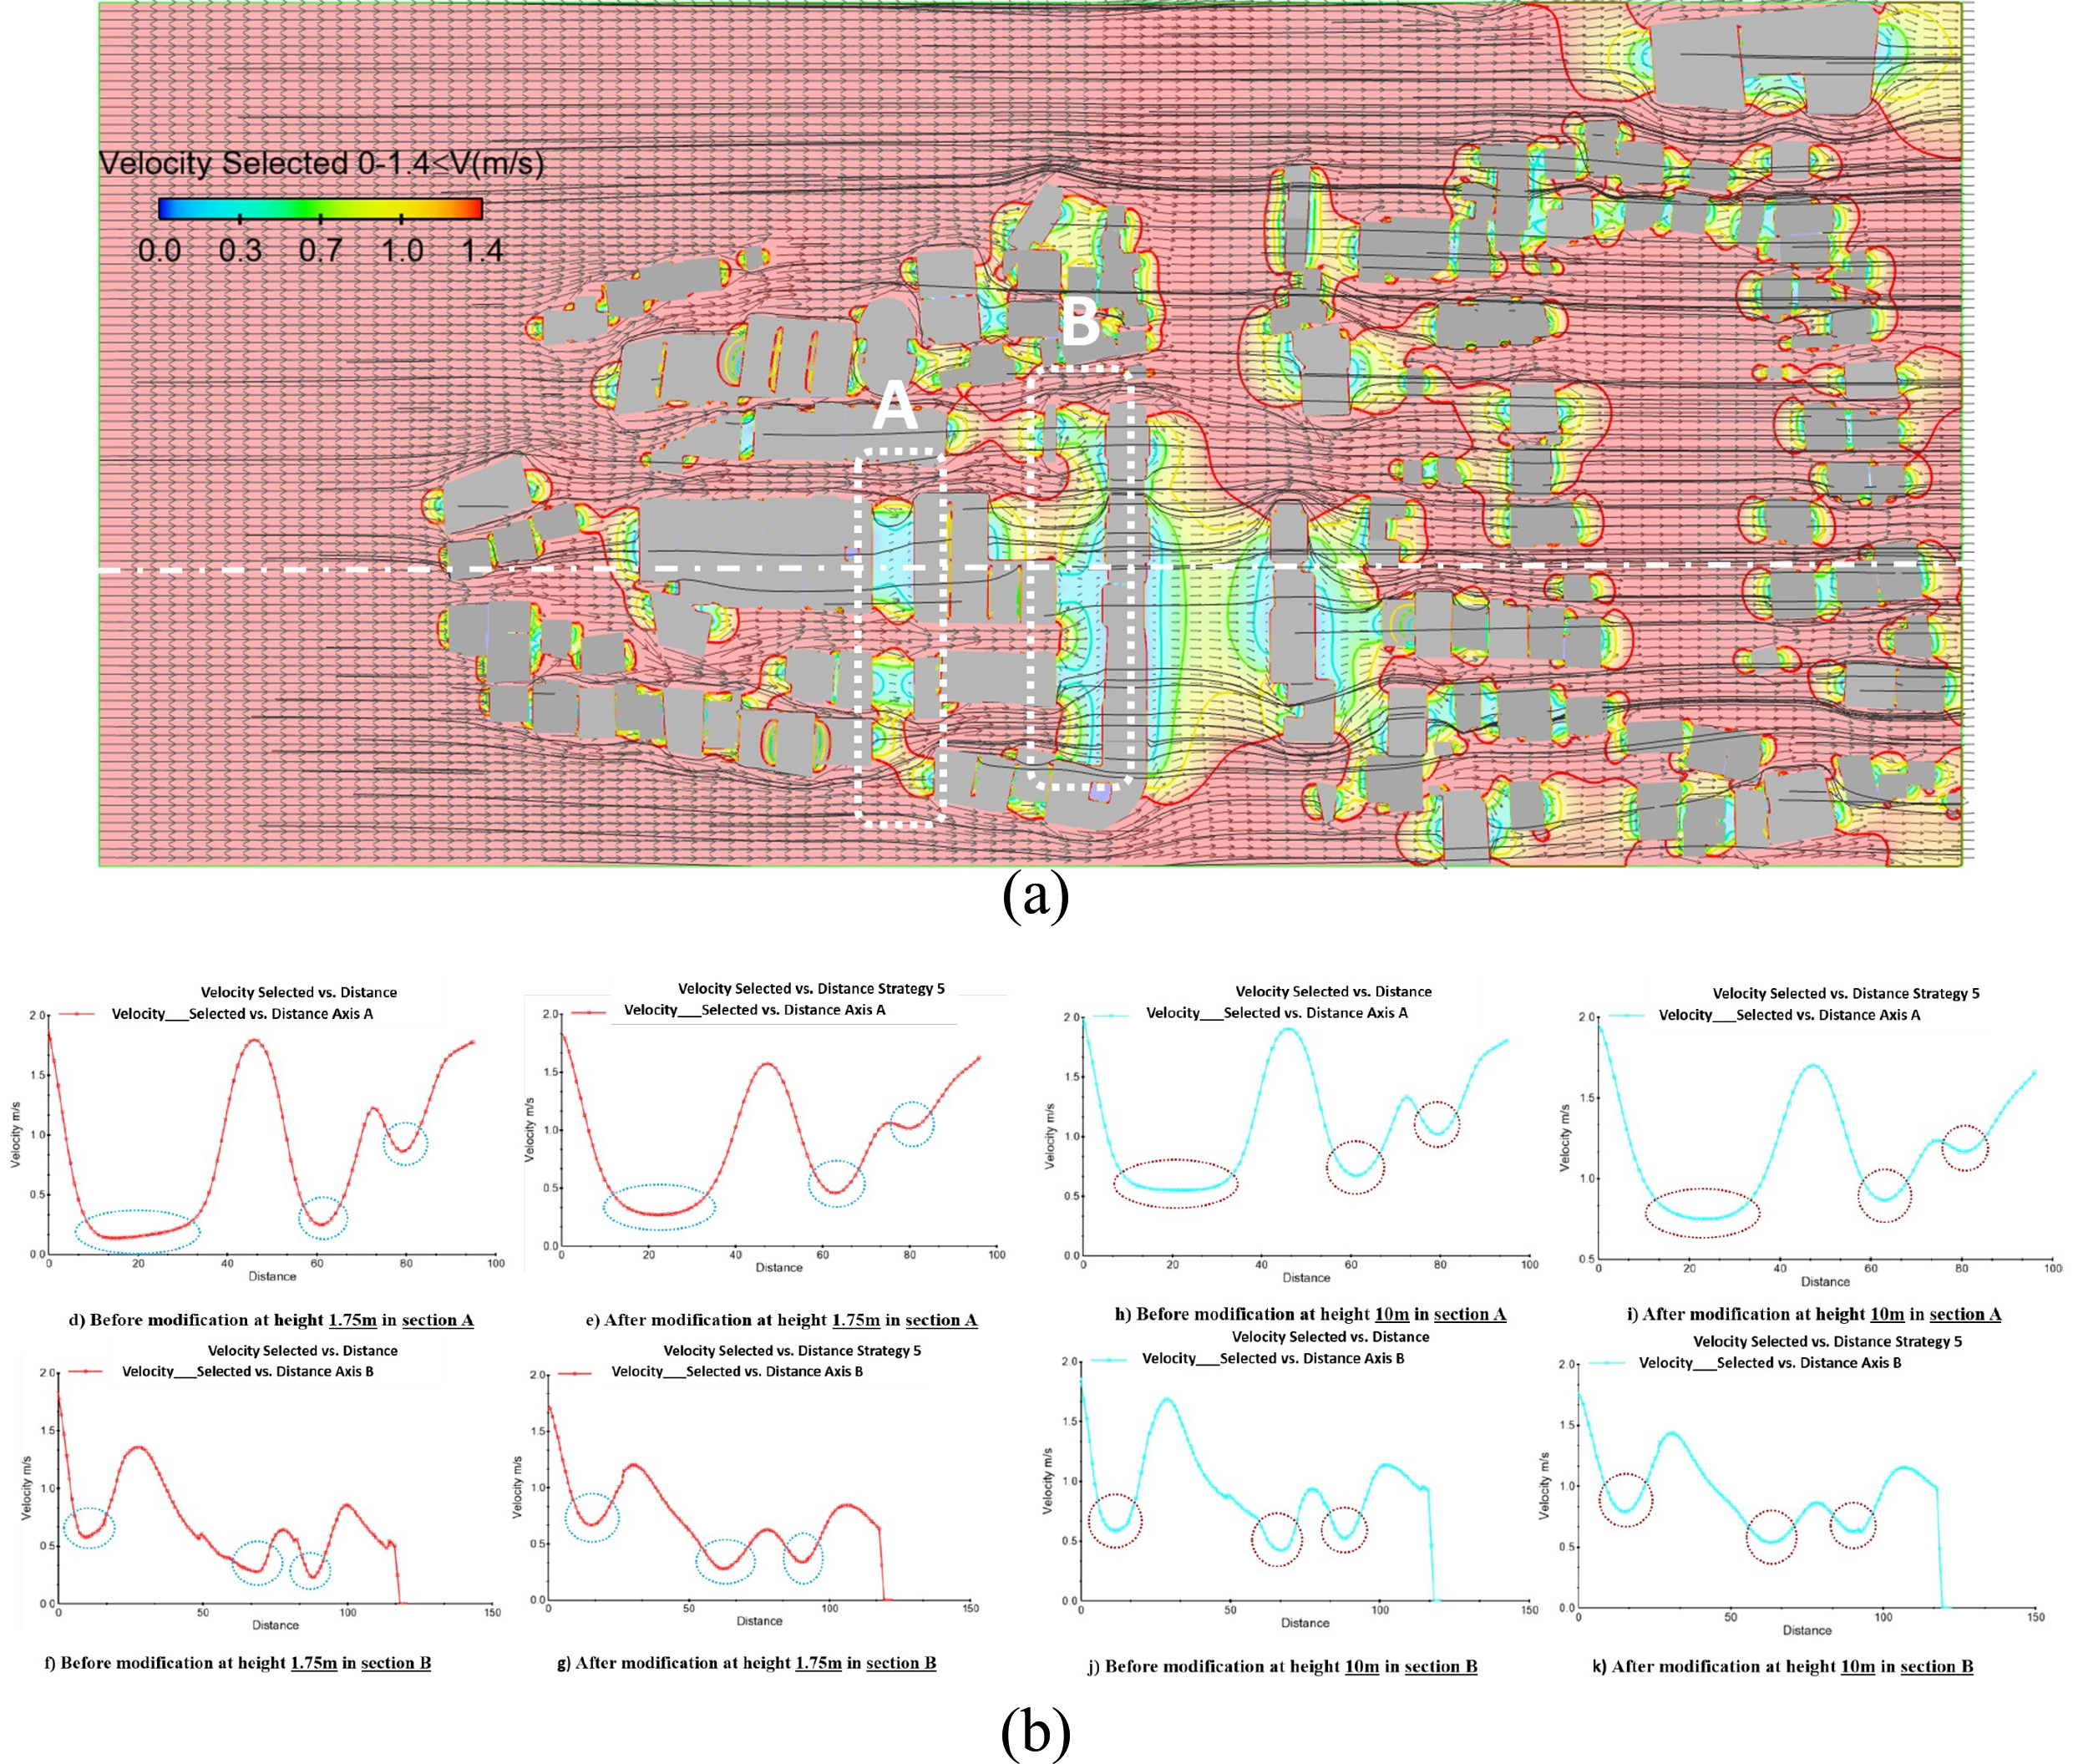
Fig. 15. (a) Modification plan and simulation of strategy No.5 and (b) elaborate comparison between wind flow profiles of before and after modification of sections A & B.
Figure 16
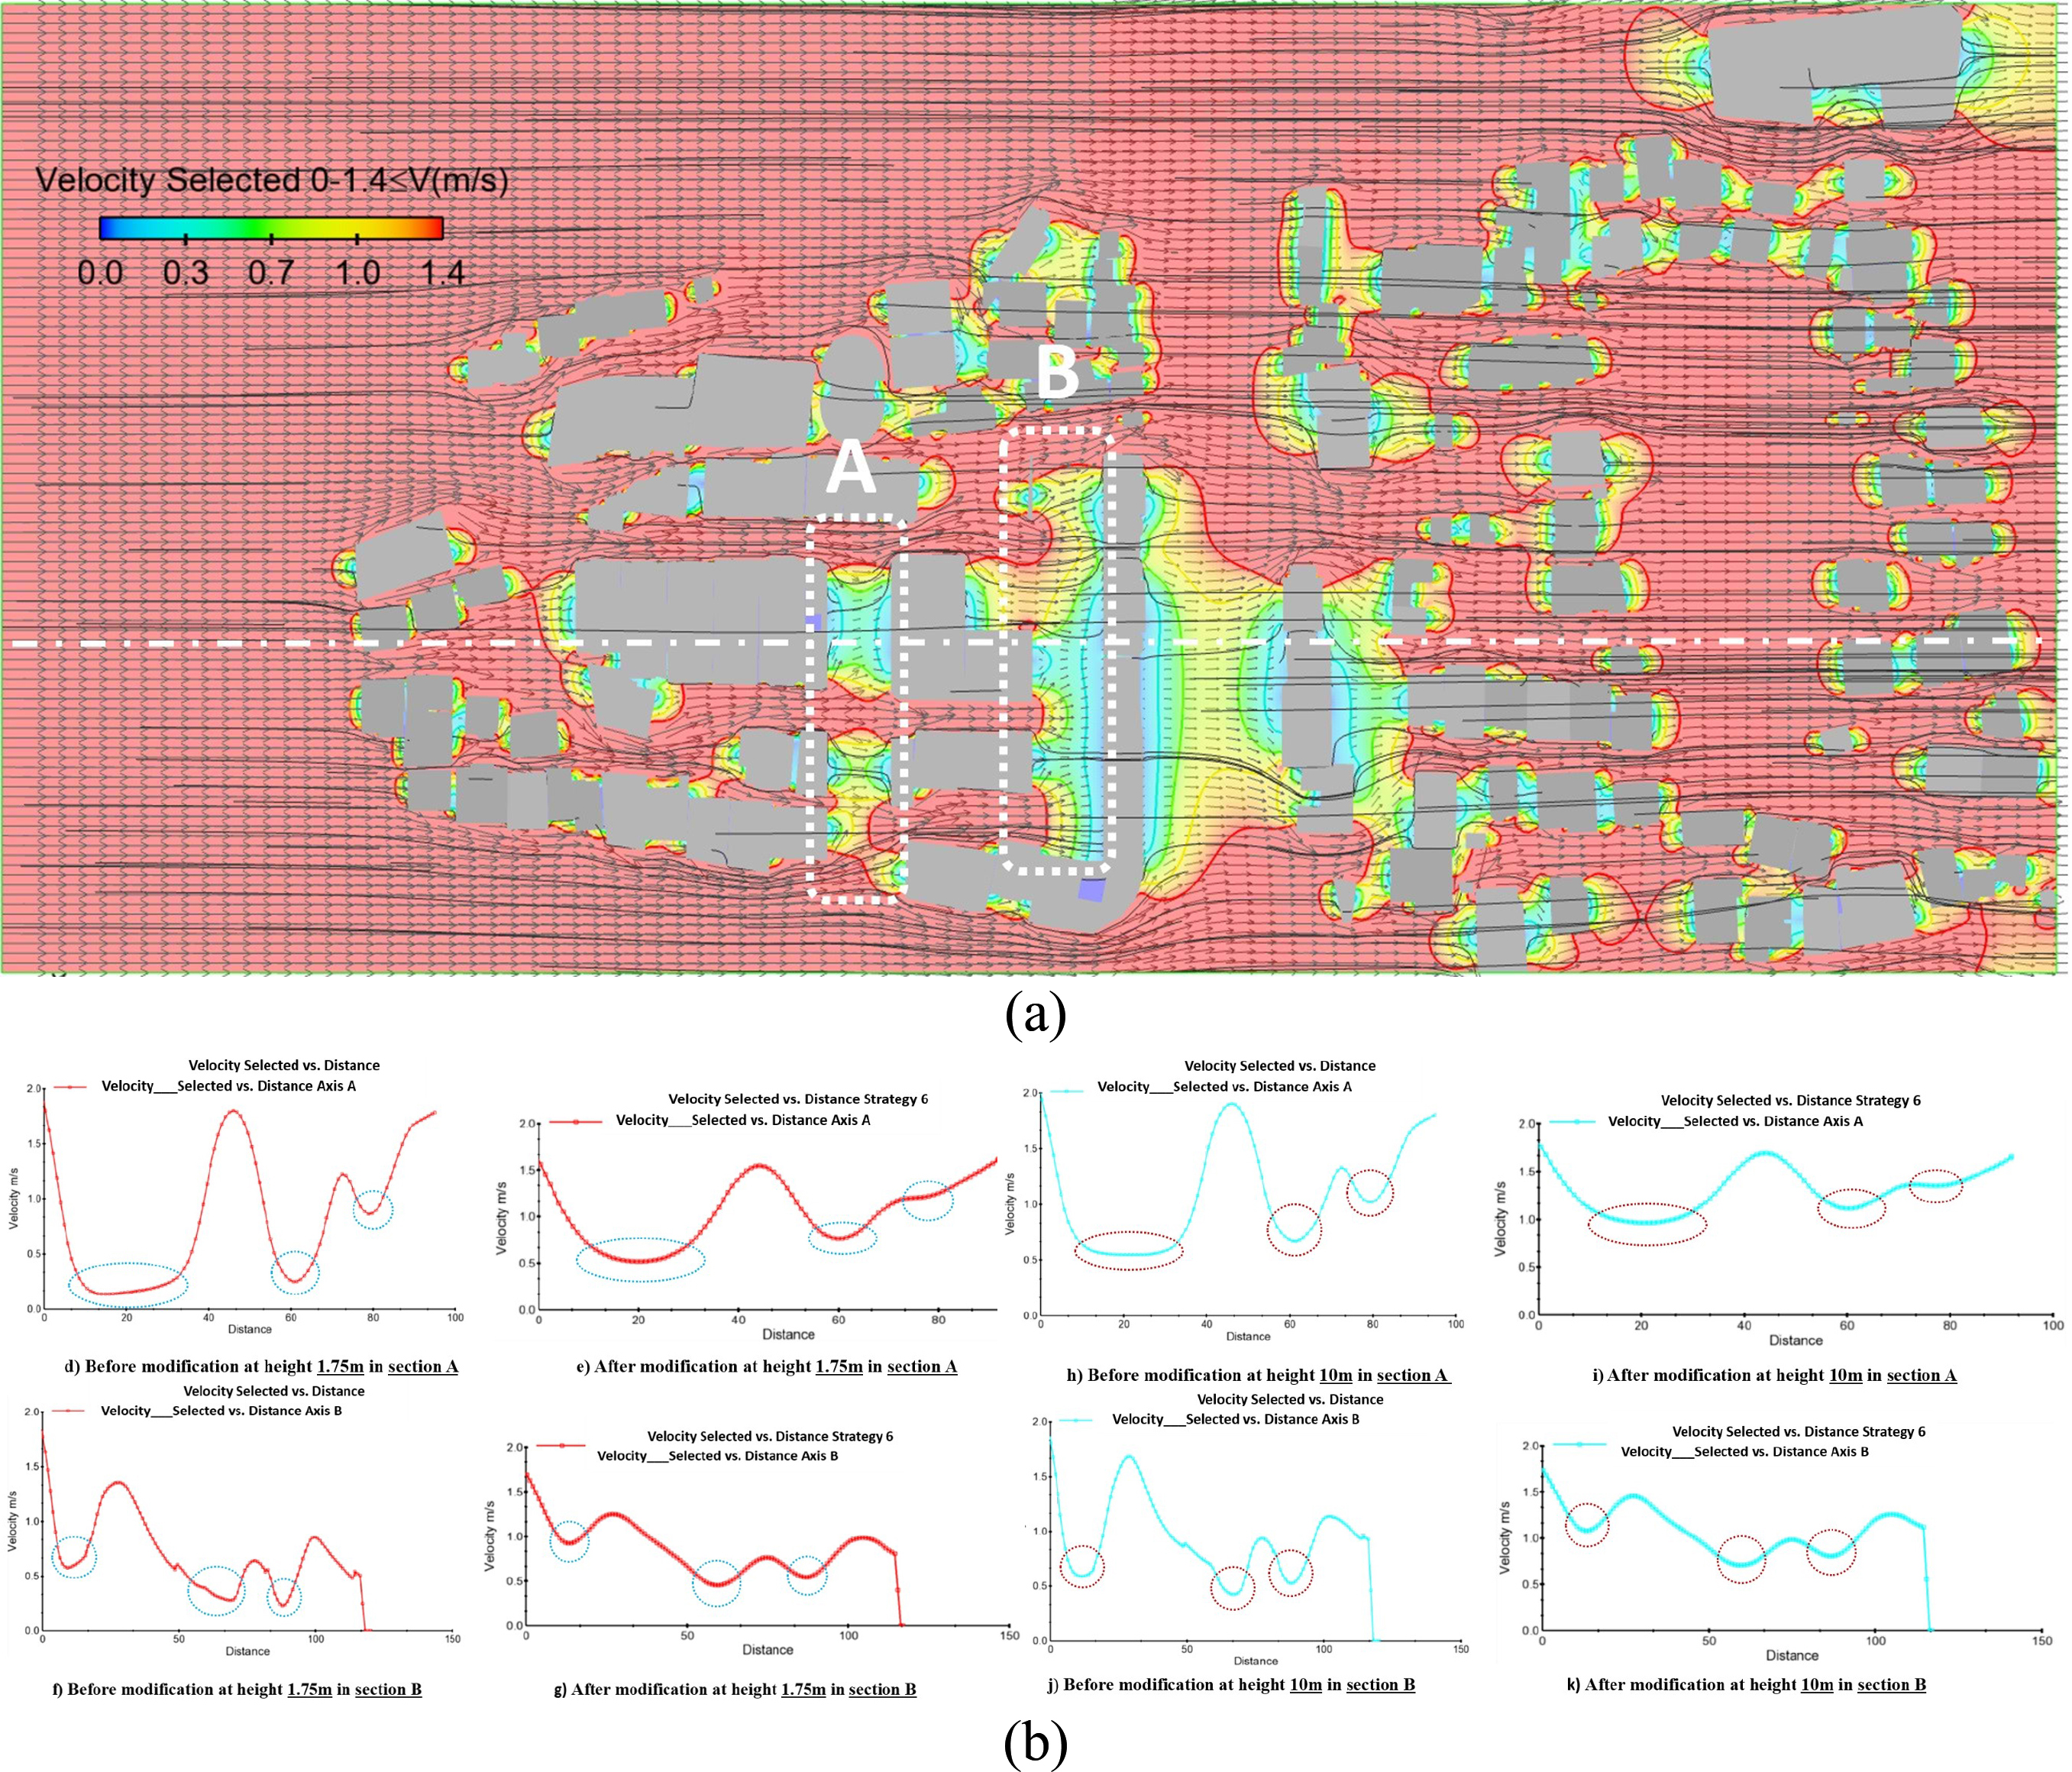
Fig. 16. (a) Modification plan and simulation of strategy No.6 (b) elaborate comparison between wind flow profiles of before and after modification of sections A & B.
Figure 17
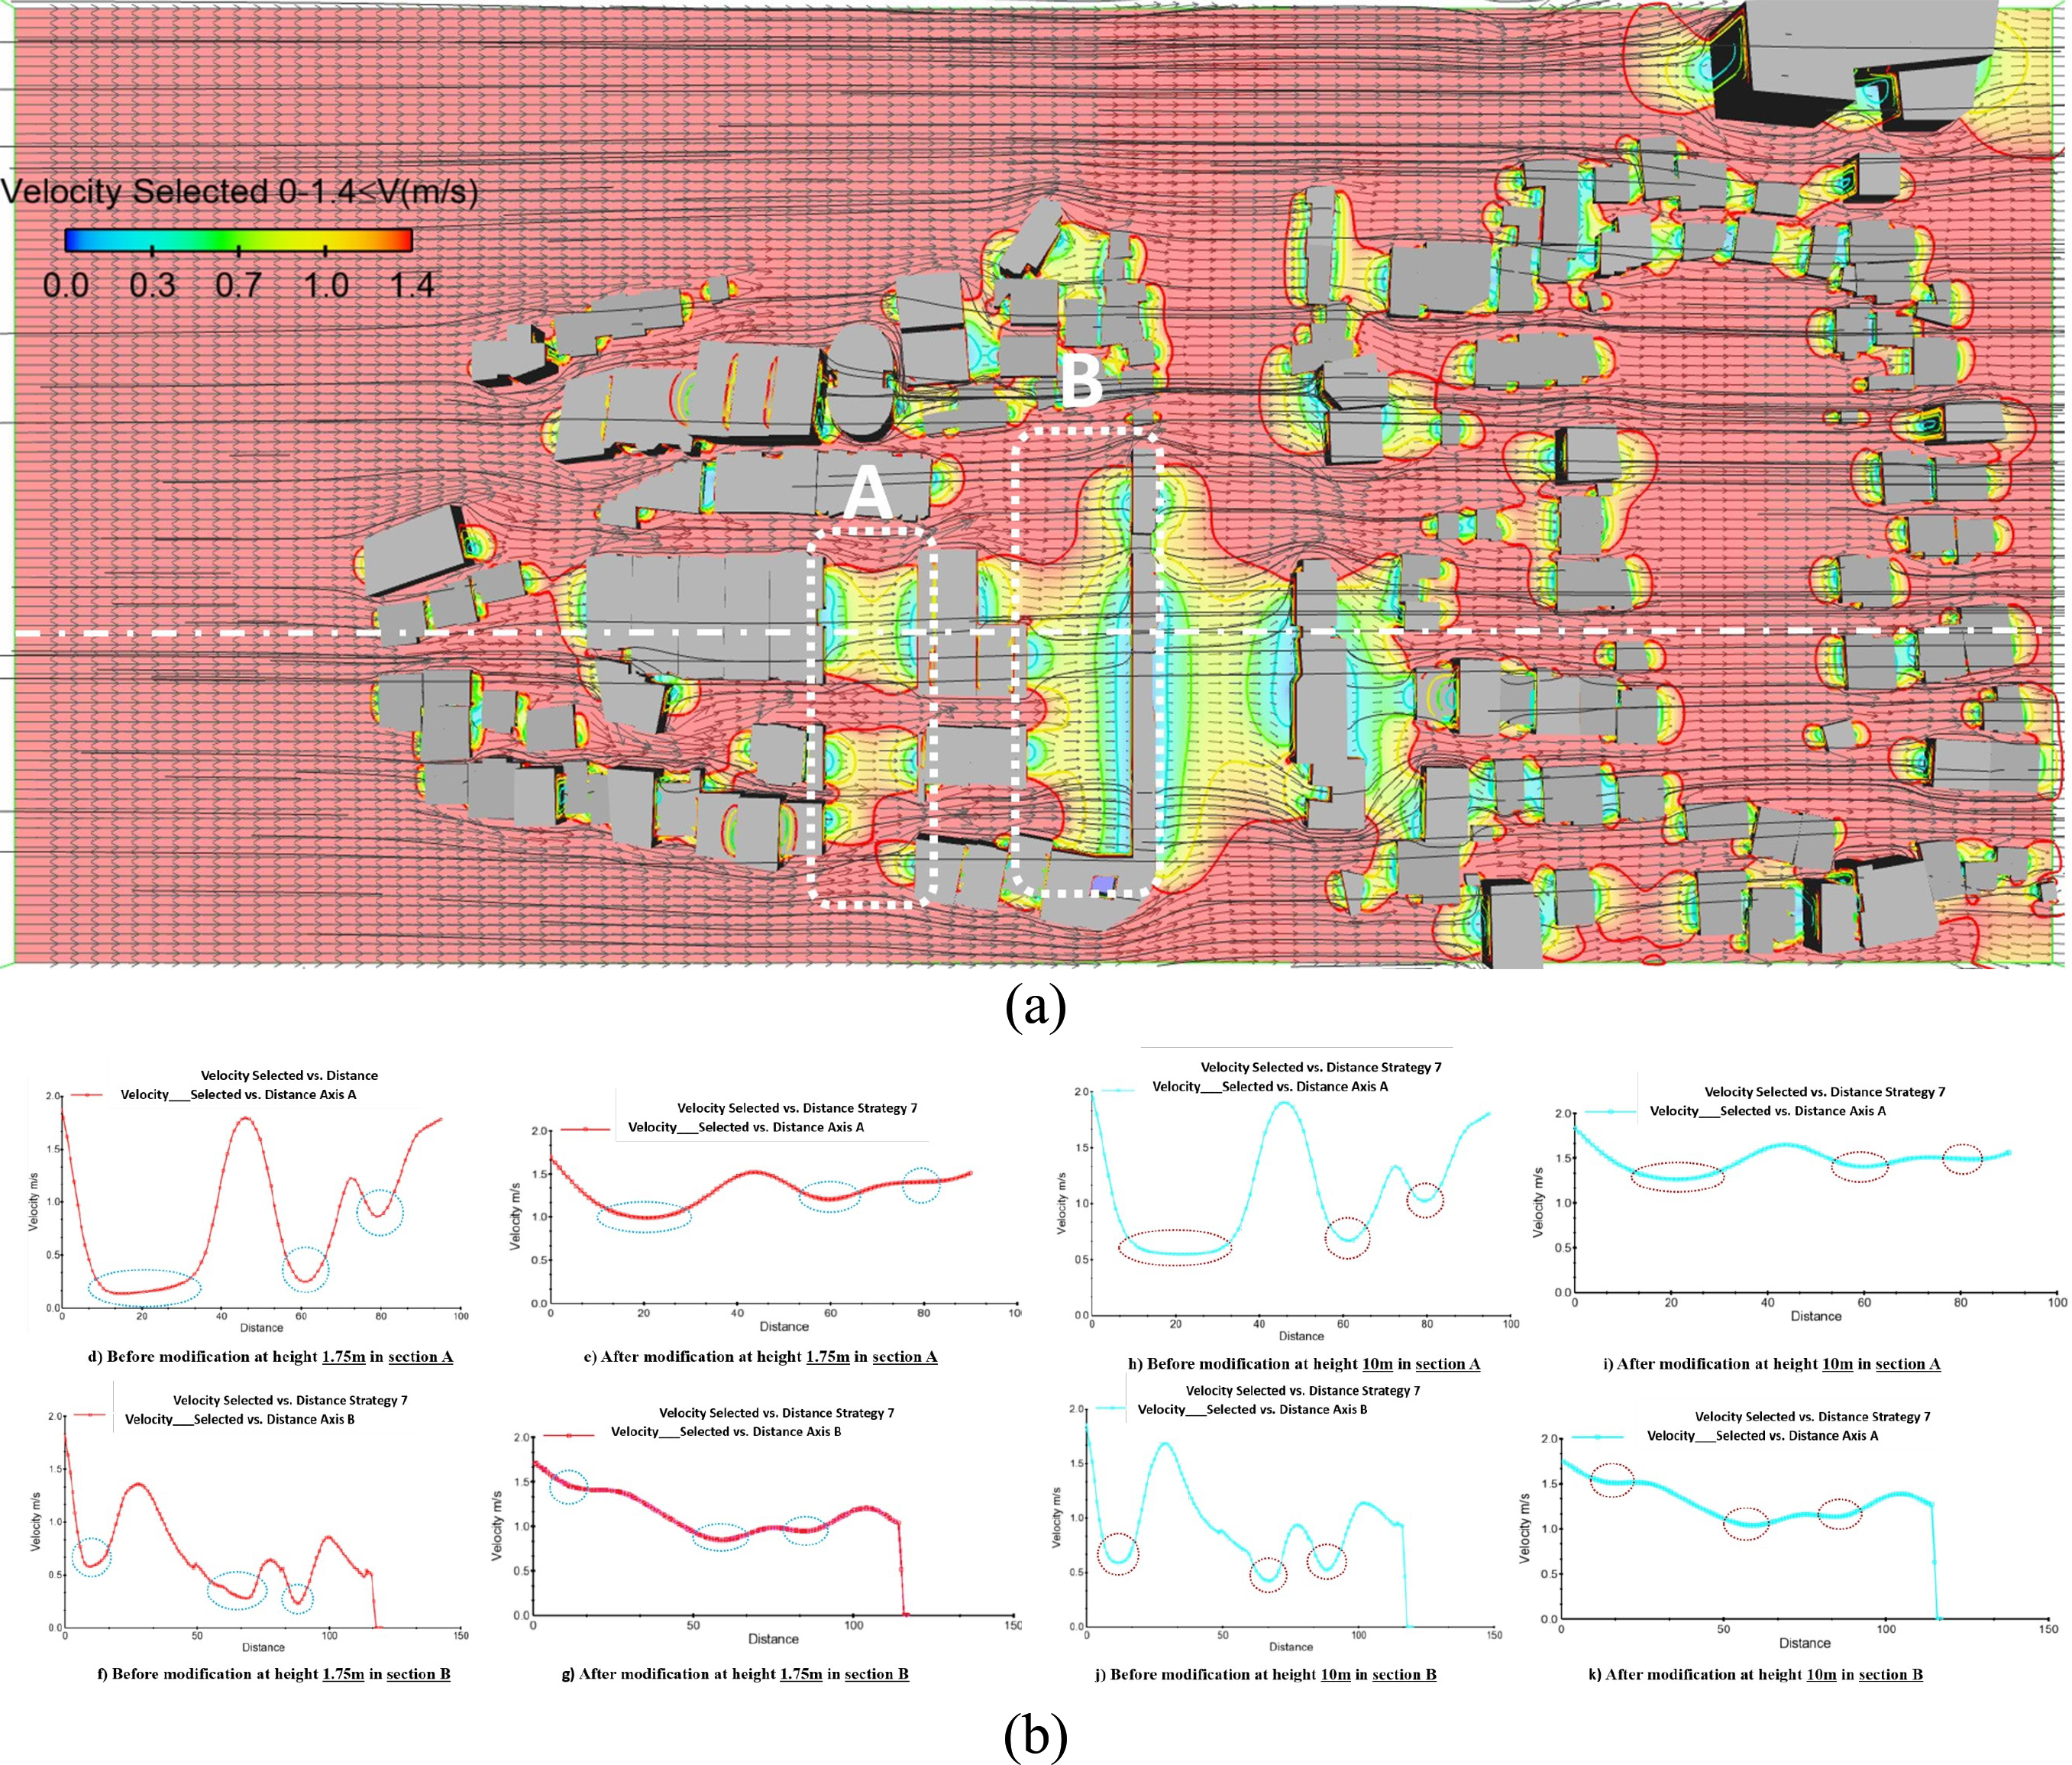
Fig. 17. (a) Modification plan and simulation of strategy No.7 and (b) elaborate comparison between wind flow profiles of before and after modification of sections A & B.
5.2.2.2. Strategy No. 6: Changing passage width A and B to 2A and 2B – changing enclosure E and E’ to 0.5E and 0.5E’ between masses
In Fig. 16, The line graphs show the wind velocity by changing passage width A and B to 2A and 2B, as a result changing enclosure E and E’ to 0.5E and 0.5E’ between masses. The modifications are represented at 2 levels (at height 1.75 m & 10 m). The line graphs of wind velocity have occurred in a distance between 0-150 m for two axes (A&B). If you look at before and after the corrections (marked on the diagrams), you can see that there is some change in the velocity profile, but in general, the wind flow velocity has not improved. This means that increasing the proposed width is necessary but not sufficient to change wind conditions.
5.2.2.3. Strategy No. 7: Changing passage width A and B to 3A and 3B – changing enclosure E and E’ to 0.33E and 0.33E’ between masses
The line graphs show the wind velocity of the physical modifications at the level of 1.75 m and 10 m same as the previous two strategies in the distance between 0-150 m for two axes (A&B). The strategy of changing passage width A and B to 3A and 3B – changing enclosure E and E’ to 0.33E and 0.33E’ between masses (strategy No.7), unlike the previous two strategies, the wind velocity increase after modifications by a large difference compared to before modification in Fig. 17. Exactly the points indicated on diagrams. These modifications show that the change in width between the buildings has made the freedom of flow and wind circulation. So, these changes in width between the buildings were appropriate and created a wind flow.
According to creating permeability by opening along passage (Strategy No.1) and also creating the opening just on the ground floor in the prevailing wind direction (strategy No.2) strategy No.1 is preferable to the strategy No.2 because the wind movement occurs better without prevention and has a significant effect. Meanwhile, creating an opening only on the ground floor prevents the wind movement in the upper levels, and the problem of the wind not moving in the higher part is not completely solved.
The strategies of creating open space between building masses by separating buildings (strategy No.3) and also creating it just on the ground floor (strategy No.4) were compared. It should be said that strategy No.3 is recommended because it is necessary to create an open space between buildings and pass the wind flow through all parts of the mass, and creating it on the ground floor will reduce the problem in the upper floors but will not solve it.
Regarding the enclosure between the masses by changing the width of the passage between the buildings, the passage width 1/5A,1/5B and 2A, 2B with the enclosure 0.66E, 0.66E’ and 0.5E, 0.5E’ (strategies No.5 and 6) were not responsive compared to the passage width 3A, 3B with the enclosure 0.33E, 0.33E’ (strategy No.7) and have low efficiency. But in strategy No.7 to improve wind-flow, the width of the north-south have been changed from A (A = 9M) to 3A and performs better than the previous two strategies for the prevailing urban wind flow, finally passages the velocity increases logically with this type of enclosure. Overall, to create a suitable enclosure for urban ventilation and wind movement, changes have been made in the passage's width and the space between the masses.
5.3. A combination of the best previous strategies as improving the wind environmental condition
Observing the principles of shape and volume in the texture in Fig. 18, an option will be selected and presented as the improvement design option. In this option, in addition to the least amount of the wind intensity reduction in the space between the masses, we see a common configuration in the design that will increase the efficiency of changes in texture.
Figure 18
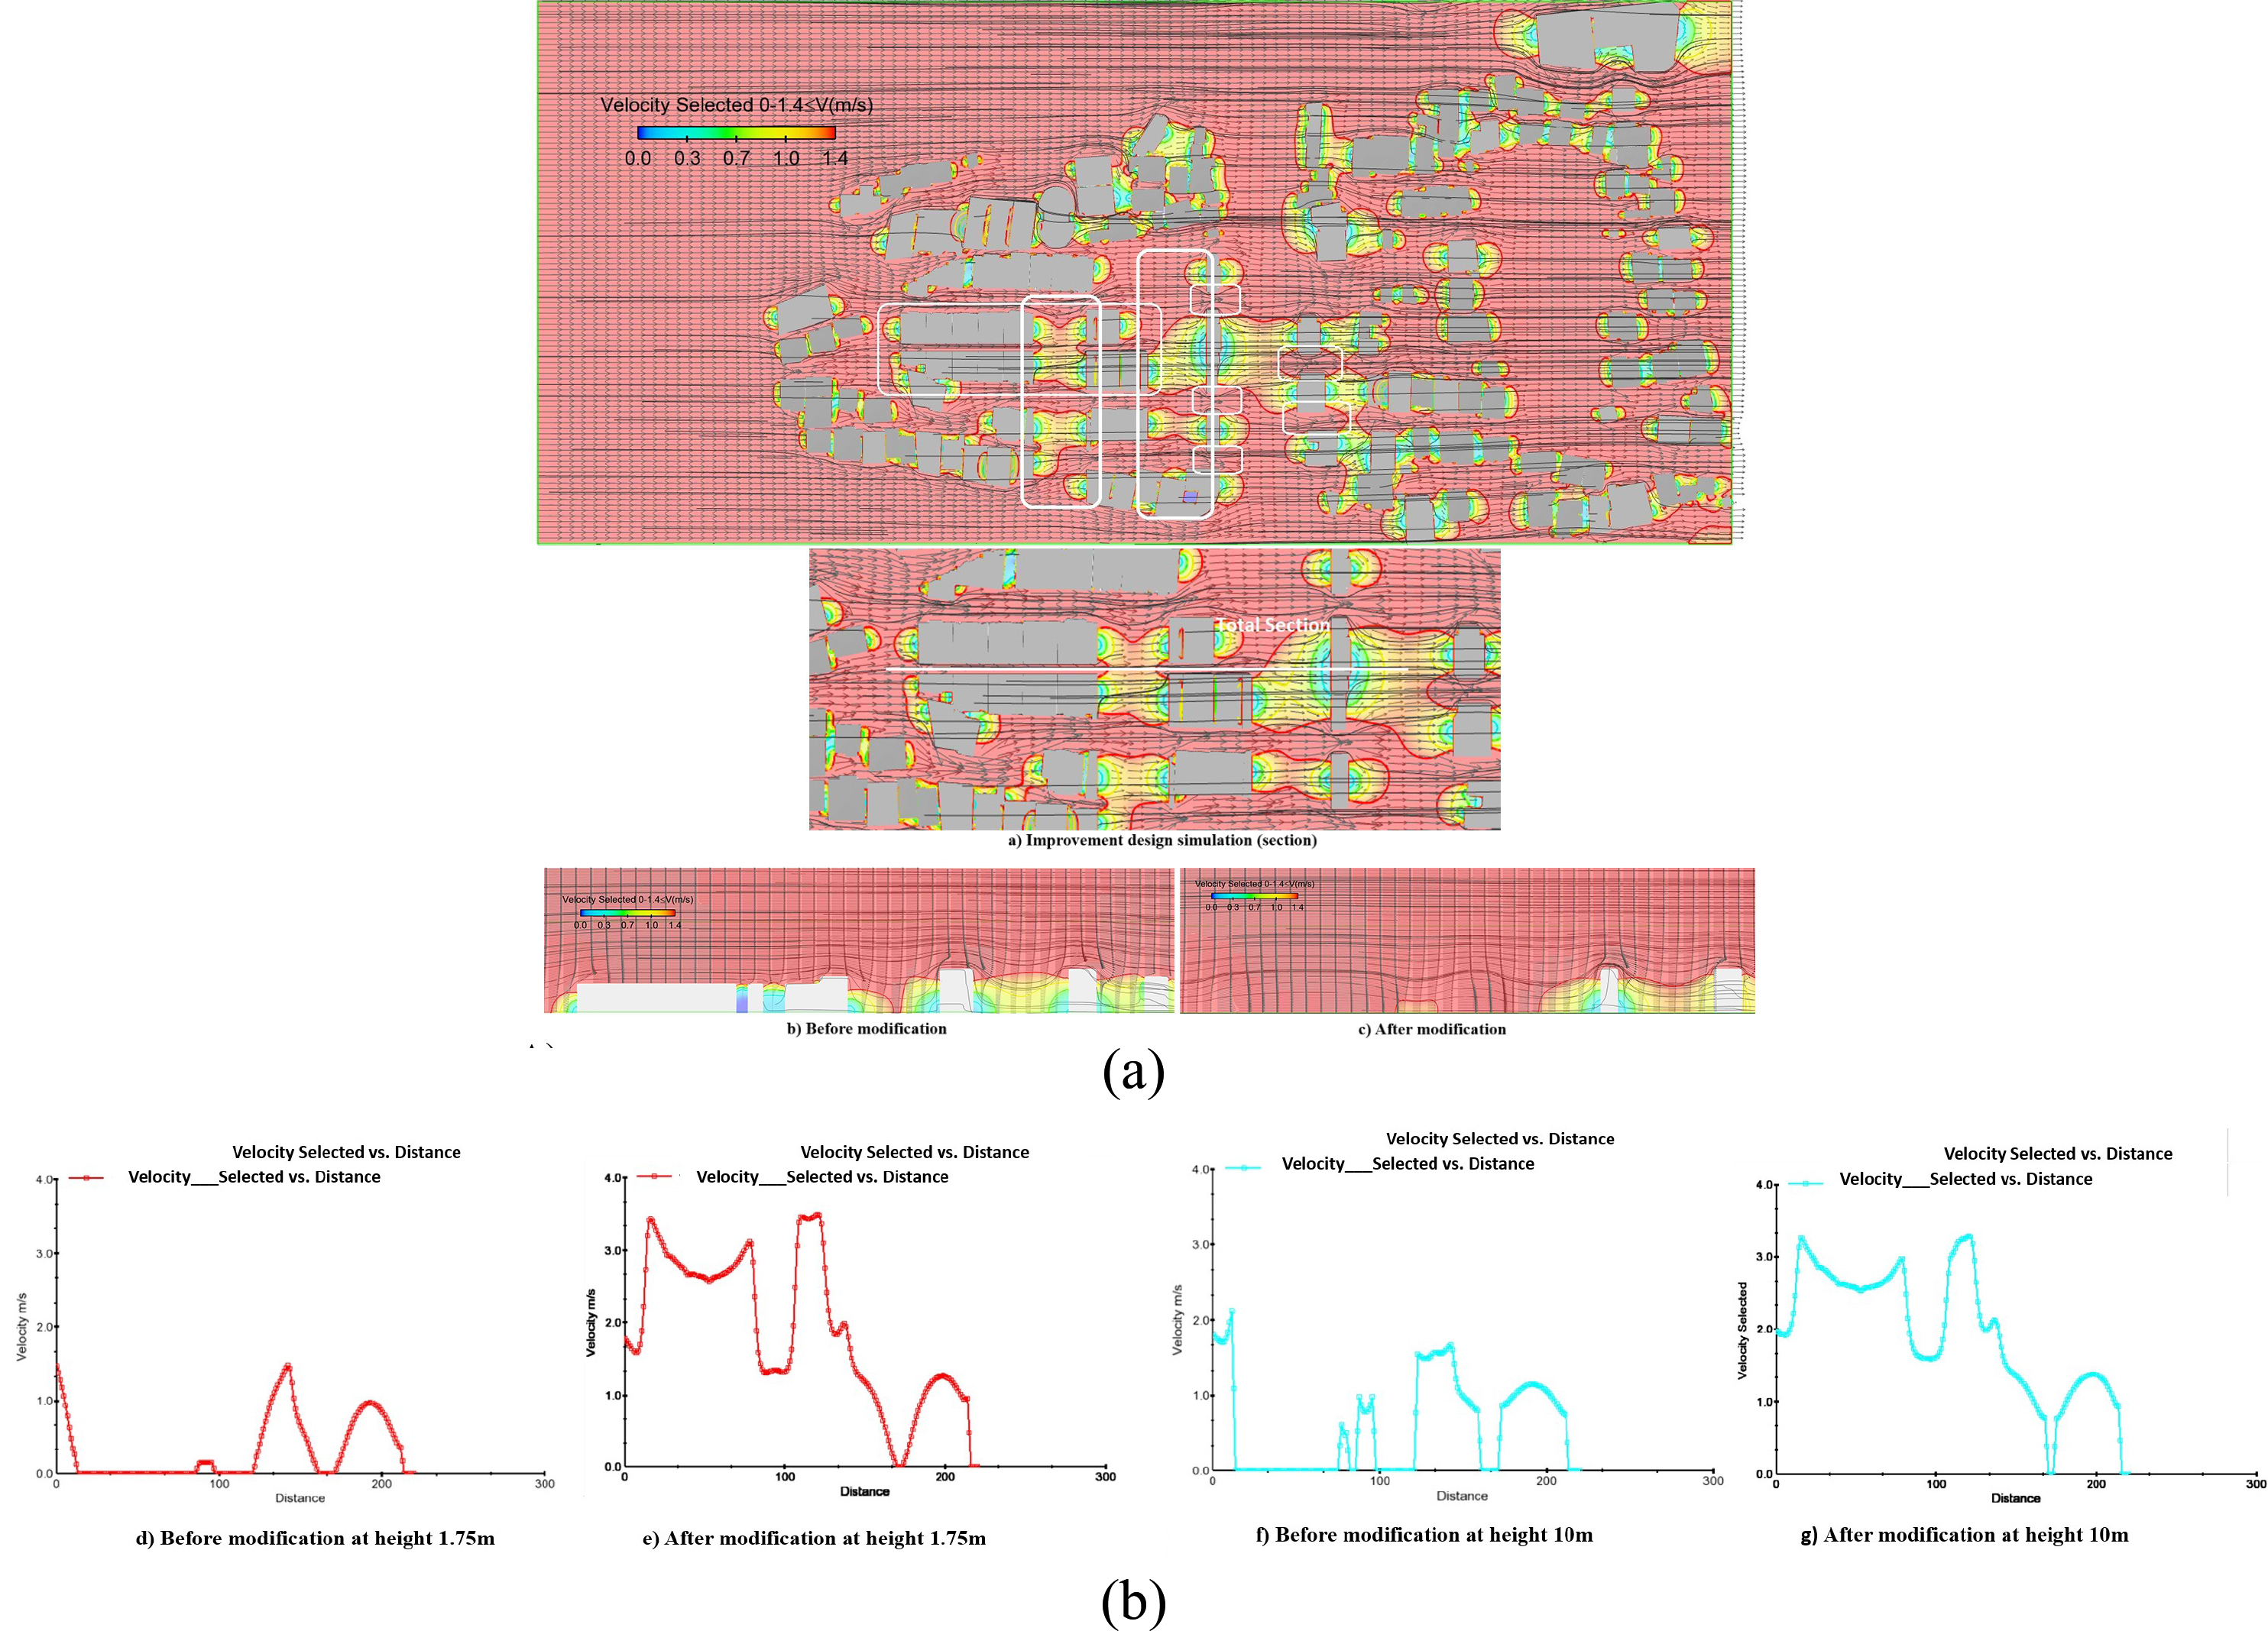
Fig. 18. (a) Improvement plan and simulation (b) simulation of wind current situation and the improvement design above height 1.75.
6. Discussion
Based on the result analysis in Section 4, 7 strategies have been presented to achieve a design appropriate to enhance the wind flow in urban blocks. Finally, a software-based analysis has increased the accuracy of this analysis. Based on the tested strategies, it can be seen that the strategies of creating permeability by opening along passage (Strategy No.1), creating open space between building masses by separating buildings (strategy No.3) and changing passage width A and B to 3A and 3B – changing enclosure E and E’ to 0.33E and 0.33E’ between masses (strategy No.7) establish the best velocity flow in the urban fabric and therefore will have the least velocity reduction in urban blocks.
- Recent studies have investigated the potential of the opening between building masses and the mass's orientation to the prevailing wind to control wind velocity. They have concluded that the prevailing wind flow, when parallel to the openings and the space between the buildings, increases the wind velocity and creates windy conditions for areas with high average velocity [34,16]. Also, increasing wind velocity between building blocks and streets parallel to the prevailing wind flow can cause stagnant wind movement and ventilation [45]. Creating permeability by opening along the passage (Strategy No.1) is preferable to creating it just on the ground floor (Strategy No.2) because the wind-flow distribution occurs without obstruction and causes a significant increase in wind velocity. In addition, creating an opening only on the ground floor obstructs the wind flow in the higher parts and the problem of lacking wind flow is not completely solved there [44].
- It is necessary to create an open space or permeability of wind flow in all parts of the building masses, creating infiltration on the ground floor will reduce the problem on the upper floors but will not solve it. According to studies by Du et al. 2018 [44] on the effect of porosity on wind comfort around a detached building and a group of buildings, it was decided to place the porosity on the first floor, which is closer to the pedestrian surface, (better than the second floor) is. Besides, wind comfort improves with increasing porosity. For the group of buildings, in the present study wind comfort is improved in the upstream areas by increasing the porosity of the building, while other areas are not sensitive to changes in the size of the porosity. Therefore, strategy No.3 works better for the upper levels.
- In the Babolsar master plan, height density has been recommended appropriately for the protection of agricultural lands and the useful application of buildable and residential lands. Therefore, to create a suitable enclosure for urban ventilation, changes have been recommended in the passages’ width and the space between the masses. Research on passages between urban masses and their effect on wind flow shows that increasing the passage's enclosure parallel to the prevailing wind flow increases wind velocity [56]. Moreover, reducing the enclosure of wind-blocking passages (90-degree angle to wind) increases the wind velocity [57]. As a result, according to studies, the passage width 3A, 3B with the enclosure 0.33E, 0.33E’ (strategy No.7) performs better for the prevailing urban wind flow than the passage width 1/5 and 2 times of existent width (strategies No.5 and 6), and the wind velocity is increased reasonably.
7. Conclusion
This study aims to evaluate the effect of tall buildings on wind distribution and intensity in humid and dense areas. The first phase was to provide increased velocity solutions for dehumidification and decentralization. Then, improving the structure of building masses and airflow leads to ameliorating the quality of urban spaces in high-rise urban blocks. Finally, it resulted in an urban space that is compatible with the climate and the comfort needs of residents.
As the theoretical implication, the wind is one of the influential climatic phenomena in humid areas, especially along the where coast the demand for high-rise buildings is high. The physical structure of building blocks has a significant effect to absorb and facilitate the circulation of desirable wind for dehumidification. The high wind velocity, in the range to create these conditions, has caused an inverse relationship with the amount of moisture trapped between the masses and the most optimal occurrence in this range, due to climatic conditions and high relative humidity.
As the practical implication, in answer to the first question of the research, On the analysis of the physics of buildings in terms of configuration and type of forms, it can be seen that wind flow changes and increases and decreases, and as a result, this is a sign of the direct impact of city physics on wind flow.
In answer to the second question of the research, it can be said, environmental comfort depends on two important factors in areas near the sea with high humidity and high demand for high-rise construction: the orientation of the building masses and the confinement to the prevailing wind. The significant actions to increase the velocity by orienting the buildings in the direction of the prevailing wind are the alignment of the wind flow with the passages, the narrow width of the passages, its canalization, and the removal of obstruction blocks.
The advantage of increasing and decreasing enclosure can also be expressed as follows:
- Increasing the enclosure increases the wind velocity in narrow passages, parallel to the prevailing wind flow and wind channeling in them.
- Reducing the enclosure increases the wind velocity with wide passages and perpendicular to the prevailing wind flow (creating an interconnected wall and preventing the wind flow passage).
Finally, the answer to the third question can be stated as follows, condition-improving factors have different results in the two cases. These two modes depend on the direction of wind flow, which means that in the direction of wind flow, the wind flow increases with the increasing enclosure by reducing the width of passages between tall buildings. The same result with the direction of flow perpendicular to the building masses, by reducing the enclosure can increase the wind velocity relatively or create a way for the permeability of wind flow. Applying each of these factors alone grants a small change in the wind flow increase, which is not enough to improve the environmental conditions. Improving the structure of the urban block by applying the best alternatives of important factors simultaneously has improved the wind flow conditions.
We must emphasize the need for extensive research to thoroughly investigate the process by which the study establishes a significant correlation between orientation and enclosure factors. By providing a comprehensive and detailed description, we can uncover a wide range of potential optimization strategies. This will further enhance our understanding and offer valuable insights into the intricate relationship between orientation and enclosure factors.
Contributions
S. A. Aghajanzadeh: Writing- Original draft preparation, Conceptualization, Methodology, Software, Data curation, Visualization, Writing - Review & Editing, Supervision; S. M. Hosseini: Writing - Review & Editing, Visualization, Methodology, Supervision. M. Taban: Supervision, Project administration; M. Lorzangeneh: Formal analysis, Investigation.
Declaration of competing interest
The authors declare no conflict of interest.
References
- J.E. Cohen, Human Population: The Next Half Century, Science 302 (2003) 1172-1175. https://doi.org/10.1126/science.1088665
- X. Ying, Y. Wang, W. Li, Z. Liu, G. Ding, Group Layout Pattern and Outdoor Wind Environment of Enclosed O ffi ce Buildings in Hangzhou, Energies 13 (2020) 1-16. https://doi.org/10.3390/en13020406
- S. Golany, Urban design morphology and thermal performance, Atmospheric Environment 30 (1996) 455-465. https://doi.org/10.1016/1352-2310(95)00266-9
- C. Yuan, E. Ng, Building porosity for better urban ventilation in high-density cities - A computational parametric study, Building and Environment 50 (2012) 176-189. https://doi.org/10.1016/j.buildenv.2011.10.023
- B. Giyasov, I. Giyasova, B. Giyasov, I. Giyasova, The Impact of High-Rise Buildings on the Living Environment, E3SWC, 33 (2018) 01045. https://doi.org/10.1051/e3sconf/20183301045
- aula Barros, Linda Ng Fat, Leandro M.T. Garcia, Anne Dorothée Slovic, Nikolas Thomopoulos, Thiago Herick de Sá, Pedro Morais, Jennifer S. Mindell, Social consequences and mental health outcomes of living in high-rise residential buildings and the influence of planning, urban design and architectural decisions: A systematic review, Cities 93 2019) 263-272. https://doi.org/10.1016/j.cities.2019.05.015
- T. Kubota, M. Miura, Y. Tominaga, A. Mochida, Wind tunnel tests on the relationship between building density and pedestrian-level wind velocity: Development of guidelines for realizing acceptable wind environment in residential neighborhoods, Building and Environment 43 (2008) 1699-1708. https://doi.org/10.1016/j.buildenv.2007.10.015
- F. Yang, F. Qian, S.S.Y. Lau, Urban form and density as indicators for summertime outdoor ventilation potential: A case study on high-rise housing in Shanghai, Building and Environment 70 (2013) 122-137. https://doi.org/10.1016/j.buildenv.2013.08.019
- N. Shishegar, Street Design and Urban Microclimate: Analyzing the Effects of Street Geometry and Orientation on Airflowand Solar Access in Urban Canyons, Journal of Clean Energy Technologies 1 (2013) 52-56. https://doi.org/10.7763/JOCET.2013.V1.13
- E. Erell, D. Pearlmutter, T.J. Williamson, Urban microclimate : designing the spaces between buildings, first ed., Routledge, London, 2010.
- B.J. He, L. Ding, D. Prasad, Urban ventilation and its potential for local warming mitigation: A field experiment in an open low-rise gridiron precinct, Sustainable Cities and Society, 55 (2020) 102028. https://doi.org/10.1016/j.scs.2020.102028
- R. Ramponi, B. Blocken, L.B. de Coo, W.D. Janssen, CFD simulation of outdoor ventilation of generic urban configurations with different urban densities and equal and unequal street widths, Building and Environment 92 (2015) 152-166. https://doi.org/10.1016/j.buildenv.2015.04.018
- R. Buccolieri, M. Sandberg, S. Di Sabatino, City breathability and its link to pollutant concentration distribution within urban-like geometries, Atmospheric Environment 44 (2010) 1894-1903. https://doi.org/10.1016/j.atmosenv.2010.02.022
- R.X. Lee, S.K. Jusuf, N.H. Wong, The study of height variation on outdoor ventilation for Singapore's high-rise residential housing estates, International Journal of Low-Carbon Technologies 10 (2015) 15-33. https://doi.org/10.1093/ijlct/ctt013
- P.P. Pancholy, K. Clemens, P. Geoghegan, M. Jermy, M. Moyers-Gonzalez, P.L. Wilson, Numerical study of flow pattern and pedestrian level wind comfort inside a uniform street canyon at different angles of attack, Proceedings of the 20th Australasian Fluid Mechanics Conference, AFMC 2016, (2016).
- X. Shi, Y. Zhu, J. Duan, R. Shao, J. Wang, Assessment of pedestrian wind environment in urban planning design, Landscape and Urban Planning, 140 (2015) 17-28. https://doi.org/10.1016/j.landurbplan.2015.03.013
- J. Hang, Y. Li, M. Sandberg, L. Claesson, Wind conditions and ventilation in high-rise long street models, Building and Environment 45 (2010) 1353-1365. https://doi.org/10.1016/j.buildenv.2009.11.019
- M. Jȩdrzejewski, M. Pocwierz, K. Zielonko-Jung, The problem of airflow around building clusters in different configurations, Archive of Mechanical Engineering 64 (2017) 401-418. https://doi.org/10.1515/meceng-2017-0024
- R.E. Dadioti, S. Rees, Validation of a Detached Eddy Simulation (DES) Model in Complex Urban Environment, Athens Journal of Sciences, 3 (2016) 113-136. https://doi.org/10.30958/ajs.3-2-3
- Y. Gao, R. Yao, B. Li, E. Turkbeyler, Q. Luo, A. Short, Field studies on the effect of built forms on urban wind environments, Renewable Energy Complete (2012) 148-154. https://doi.org/10.1016/j.renene.2012.03.005
- J. Hang, Y. Li, M. Sandberg, R. Buccolieri, S. Di Sabatino, The influence of building height variability on pollutant dispersion and pedestrian ventilation in idealized high-rise urban areas, Building and Environment 56 (2012) 346-360. https://doi.org/10.1016/j.buildenv.2012.03.023
- Z. Tong, Y. Chen, A. Malkawi, Estimating natural ventilation potential for high-rise buildings considering boundary layer meteorology, Applied Energy 193 (2017) 276-286. https://doi.org/10.1016/j.apenergy.2017.02.041
- C.Y. Wen, Y.H. Juan, A.S. Yang, Enhancement of city breathability with half open spaces in ideal urban street canyons, Building and Environment 112 (2017) 322-336. https://doi.org/10.1016/j.buildenv.2016.11.048
- W. Wang, E. Ng, C. Yuan, S. Raasch, Large-eddy simulations of ventilation for thermal comfort - A parametric study of generic urban configurations with perpendicular approaching winds, Urban Climate 20 (2017) 202-227. https://doi.org/10.1016/j.uclim.2017.04.007
- X. Zhang, A.U. Weerasuriya, X. Zhang, K.T. Tse, B. Lu, C.Y. Li, C.H. Liu, Pedestrian wind comfort near a super-tall building with various configurations in an urban-like setting, Building Simulation, 13 (2020) 1385-1408. https://doi.org/10.1007/s12273-020-0658-6
- J. Yang, B. Shi, Y. Shi, S. Marvin, Y. Zheng, G. Xia, Air pollution dispersal in high density urban areas: Research on the triadic relation of wind, air pollution, and urban form, Sustainable Cities and Society 54 (2020) 101941. https://doi.org/10.1016/j.scs.2019.101941
- E. Andreou, The effect of urban layout, street geometry and orientation on shading conditions in urban canyons in the Mediterranean, Renewable Energy 63 (2014) 587-596. https://doi.org/10.1016/j.renene.2013.09.051
- Y. Nakamura, T.R. Oke, Wind, temperature and stability conditions in an east-west oriented urban canyon, Atmospheric Environment (1967), 22 (1988) 2691-2700. https://doi.org/10.1016/0004-6981(88)90437-4
- J.H.P. Bay, S. Lehmann, Growing compact: Urban form, density and sustainability, Taylor and Francis, 2017.
- A. Cao, Q. Li, Q. Meng, Effects of Orientation of Urban Roads on the Local Thermal Environment in Guangzhou City, Procedia Engineering, 121 (2015) 2075-2082. https://doi.org/10.1016/j.proeng.2015.09.209
- X.X. Li, C.H. Liu, D.Y.C. Leung, Development of a k-ε model for the determination of air exchange rates for street canyons, Atmospheric Environment, 39 (2005) 7285-7296. https://doi.org/10.1016/j.atmosenv.2005.09.007
- F. Ali-Toudert, H. Mayer, Numerical study on the effects of aspect ratio and orientation of an urban street canyon on outdoor thermal comfort in hot and dry climate, Building and Environment, 41 (2006) 94-108. https://doi.org/10.1016/j.buildenv.2005.01.013
- B. Blocken, P. Moonen, T. Stathopoulos, J. Carmeliet, Numerical Study on the Existence of the Venturi Effect in Passages between Perpendicular Buildings, Journal of Engineering Mechanics 134 (2008) 1021-1028. https://doi.org/10.1061/(ASCE)0733-9399(2008)134:12(1021)
- Z. Weijie, Q. Jing, L. Xin, CFD simulation for urban environment planning, Proceedings - International Conference on Management and Service Science, MASS 2009, (2009).
- F. Bourbia, F. Boucheriba, Impact of street design on urban microclimate for semi arid climate ( Constantine ), Renewable Energy 35 (2010) 343-347. https://doi.org/10.1016/j.renene.2009.07.017
- J. Hang, Y. Li, Ventilation strategy and air change rates in idealized high-rise compact urban areas, Building and Environment 45 (2010) 2754-2767. https://doi.org/10.1016/j.buildenv.2010.06.004
- K.A. Al-Sallal, L. Al-Rais, Outdoor airflow analysis and potential for passive cooling in the modern urban context of Dubai, Renewable Energy, 38 (2012) 40-49. https://doi.org/10.1016/j.renene.2011.06.046
- B. Hong, B. Lin, Numerical studies of the outdoor wind environment and thermal comfort at pedestrian level in housing blocks with different building layout patterns and trees arrangement, Renewable Energy, 73 (2015) 18-27. https://doi.org/10.1016/j.renene.2014.05.060
- J. Hang, Q. Wang, X. Chen, M. Sandberg, W. Zhu, R. Buccolieri, S. Di Sabatino, City breathability in medium density urban-like geometries evaluated through the pollutant transport rate and the net escape velocity, Building and Environment 94 (2015) 166-182. https://doi.org/10.1016/j.buildenv.2015.08.002
- Y. Gan, H. Chen, Discussion on the Applicability of Urban Morphology Index System for Block Natural Ventilation Research, Procedia Engineering 169 (2016) 240-247. https://doi.org/10.1016/j.proeng.2016.10.029
- S. Zeyaeyan, A. Tohidi, A. Ranjbar, E. Dabaghsaz, The Effect of Locating High-Rise Buildings On the Wind Flow Using CFD Simulation , Case Study Chitgar Towers in Tehran ε ω ω ε ω ε, 6 (2014) 12-17.
- F. Guo, P. Zhu, S. Wang, D. Duan, Y. Jin, Improving Natural Ventilation Performance in a High-Density Urban District: A Building Morphology Method, in: Procedia Engineering, Elsevier Ltd, 2017: pp. 952-958. https://doi.org/10.1016/j.proeng.2017.10.149
- Y.H. Juan, A.S. Yang, C.Y. Wen, Y.T. Lee, P.C. Wang, Optimization procedures for enhancement of city breathability using arcade design in a realistic high-rise urban area, Building and Environment 121 (2017) 247-261. https://doi.org/10.1016/j.buildenv.2017.05.035
- Y. Du, C.M. Mak, B. sin Tang, Effects of building height and porosity on pedestrian level wind comfort in a high-density urban built environment, Building Simulation 11 (2018) 1215-1228. https://doi.org/10.1007/s12273-018-0451-y
- H. Qin, P. Lin, S.S.Y. Lau, D. Song, Influence of site and tower types on urban natural ventilation performance in high-rise high-density urban environment, Building and Environment 179 (2020). https://doi.org/10.1016/j.buildenv.2020.106960
- Y. Jiang, C. Wu, M. Teng, Impact of residential building layouts on microclimate in a high temperature and high humidity region, Sustainability (Switzerland), 12 (2020). https://doi.org/10.3390/su12031046
- I.D. Stewart, T.R. Oke, Local climate zones for urban temperature studies, Bulletin of the American Meteorological Society, 93 (2012) 1879-1900. https://doi.org/10.1175/BAMS-D-11-00019.1
- D.K. Papanastasiou, C. Kittas, Maximum urban heat island intensity in a medium-sized coastal Mediterranean city, Theoretical and Applied Climatology 107 (2012) 407-416. https://doi.org/10.1007/s00704-011-0491-z
- Flow Science, User Manual: FLOW-3D® Cast 32, (2009) 1-49. https://doi.org/10.1016/j.advwatres.2008.09.005
- C.W. Hirt, B.D. Nichols, Volume of fluid (VOF) method for the dynamics of free boundaries, Journal of Computational Physics 39 (1981) 201-225. https://doi.org/10.1016/0021-9991(81)90145-5
- Z. Mahmoudian, S. Baharvand, B. Lashkar-Ara, Investigating the Flow Pattern in Baffle Fishway Denil Type, Irrigation Sciences and Engineering 42 (2019) 179-196.
- V. Yakhot, S.A. Orszag, S. Thangam, T.B. Gatski, C.G. Speziale, Development of turbulence models for shear flows by a double expansion technique, Physics of Fluids A, 4 (1992) 1510-1520. https://doi.org/10.1063/1.858424
- Y. Toparlar, B. Blocken, B. Maiheu, G.J.F. van Heijst, A review on the CFD analysis of urban microclimate, Renewable and Sustainable Energy Reviews, 80 (2017) 1613-1640. https://doi.org/10.1016/j.rser.2017.05.248
- B. Blocken, W.D. Janssen, T. van Hooff, CFD simulation for pedestrian wind comfort and wind safety in urban areas: General decision framework and case study for the Eindhoven University campus, Environmental Modelling and Software 30 (2012) 15-34. https://doi.org/10.1016/j.envsoft.2011.11.009
- J. Franke, C. Hirsch, G. Jensen, H.W. Krüs, S.D. Miles, M. Schatzmann, P.S. Westbury, J.A. Wisse, N. Wright, Recommendations on the use of CFD in wind engineering, Uniwersytet Śląski, (2004) C.1.1-C1.11. https://doi.org/10.1016/0927-0248(93)90088-K
- L.P. Muniz-gäal, C.C. Pezzuto, M. Fabius, H. De Carvalho, L. Toledo, M. Mota, Urban geometry and the microclimate of street canyons in tropical climate, Building and Environment (2019) 106547. https://doi.org/10.1016/j.buildenv.2019.106547
- Y. Lin, T. Ichinose, Y. Yamao, H. Mouri, Wind velocity and temperature fields under different surface heating conditions in a street canyon in wind tunnel experiments, Building and Environment (2019) 106500. https://doi.org/10.1016/j.buildenv.2019.106500
Copyright © 2023 The Author(s). Published by solarlits.com.

3532
Total views
Citations
SHARE ON


