Article Outline
2. Identification of multi-evaluation criteria
4. Validation simulation model
Declaration of competing interest
Figures and tables
Volume 11 Issue 2 pp. 349-371 • doi: 10.15627/jd.2024.24
Parametric Optimization Approach to Evaluate Dynamic Shading Within Double-Skin Insulated Glazed Units for Multi-Criteria Daylighting Performance in Tropics
Ali Ahmed Bahdad,a Nooriati Taib,∗,a Fahad Saud Allahaim, b Ali Mohammed Ajlanb
Author affiliations
a School of Housing, Building and Planning, Universiti Sains Malaysia, 11800, Penang, Malaysia
b Department of Architecture and Building Science, College of Architecture and Planning, King Saud University, Riyadh 11421, Saudi Arabia
*Corresponding author.
alibahaddad@gmail.com (A. A. Bahdad)
nooriati@usm.my (N. Taib)
fallahaim@ksu.edu.sa (F. S. Allahaim)
aajlan@ksu.edu.my (A. M. Ajlan)
History: Received 23 July 2024 | Revised 27 August 2024 | Accepted 5 September 2024 | Published online 5 November 2024
Copyright: © 2024 The Author(s). Published by solarlits.com. This is an open access article under the CC BY license (http://creativecommons.org/licenses/by/4.0/).
Citation: Ali Ahmed Bahdad, Nooriati Taib, Fahad Saud Allahaim, Ali Mohammed Ajlan, Parametric Optimization Approach to Evaluate Dynamic Shading Within Double-Skin Insulated Glazed Units for Multi-Criteria Daylighting Performance in Tropics, Journal of Daylighting 11 (2024) 349-371. https://dx.doi.org/10.15627/jd.2024.24
Figures and tables
Abstract
This research aims to support the choice of an appropriate dynamic louver shading system (DL-SS) within double-skin facade insulated glazed units (DSF-IGUs) as a high-performance integrated window system (DSF-IGUs/DL-SS) that meets both thermal and energy performance via daylight availability under a tropical climate. The research framework has developed a multi-objective optimization method to achieve research objectives via optimizing two different scenarios of the proposed system. The first scenario was optimized for daylighting availability, meanwhile, the second scenario was optimized for energy and thermal performance. For each scenario, the best solutions are selected from respective Pareto fronts according to energy efficiency criteria, thermal comfort via enhancing daylighting availability. Based on the best options resulting from both optimizations, the final step involved comparing the results of all performance indicators in the best cases to select the best solution. Overall, based on the optimizing objectives, the ranking of the best cases varied based on giving priority to the improvement objective in the optimization process. For each scenario, the best solutions are selected from the respective Pareto fronts. Overall, ranking of the best cases varied based on giving priority to the improvement objectives. Optimizing DL-SS within DSF-IGUs while giving priority to improving energy and thermal comfort while maintaining daylighting at acceptable levels is more reasonable. Thus, the DSF-IGUs/DL-SS best-case resulting from the second optimization scenario was overcome all best cases and ranked first in energy and thermal comfort. Compared to the base case, the differences of total Predicted mean vote and percentage of dissatisfied for better thermal comfort achieved were -0.35% and -1.48% with an average decreased by 22.99% and 28.72%, respectively. The differences of total energy and cooling load for better energy performance reduced by -96.84 kwh/m2. and -86.88 kwh with an average decreased by 25.33% and 26.20%, respectively. Meanwhile, the total satisfied of spatial Daylight Autonomy for better daylighting distribution and better daylighting availability of useful daylighting illuminance improvement were improved by -5.54% and +24.76% with an average percentage variation increased by 6.25% and 36.87%, respectively.
Keywords
IGUs glazing, Dynamic shading, Genetic algorithms, Thermal comfort
Nomenclature
| GUs | Insulated Glazed Units |
| DSF | Double-Skin Facades |
| SHGC | Solar Heat Gain Coefficient |
| SS | Shading System |
| DS | Dynamic Shading |
| DSF-IGUs | Double-Skin Facade Insulated Glazed Units |
| DL-SS | Dynamic Louver Shading System |
| sDA | Spatial Daylight Autonomy |
| UDI | Useful Daylighting Illuminance |
| PMV | Predicted Mean Vote |
| PPD | Percentage Of Dissatisfied |
| EUI | Energy Use Intensity |
| MOO | Multi-Objective Optimization |
| GA | Genetic Algorithm |
| NSGA-II | Non-Dominated Sorting Genetic Algorithm |
| DSt | Depth of slots |
| SSt | Spacing between slots |
| ASt | Angle of slots |
1. Introduction
The optimization of glazing system design involves a number of factors, such as dynamically changing constraints (such as weather patterns) and different goals (such as optimizing natural light, views, and energy efficiency). This remark emphasizes how glazing systems with predetermined design qualities cannot be formed using standard static procedures since they are unable to adjust to changing environmental circumstances. Thus, a unique glazing system that offers responsive multifunction for responding to the living environment is needed to improve overall building efficiency [1]. A single glass window's primary drawback in terms of window system design is its inability to withstand heat well enough, which typically results in excessive summertime cooling energy usage. Adopting double-layer glass with a sandwich is a popular approach to improve the thermal insulation of windows in order to provide a good indoor thermal comfort environment and increase the energy efficiency of the building [2]. However, because solar radiation significantly interferes with the glazing system's ability to have a positive impact on the building, using a double-layered glazing system alone is far from sufficient to meet the objectives of building energy conservation and comfort [3]. Numerous techniques for glazing have been established thus far. Passive technologies such as vacuum glazing, tinted glass, low-emissivity coatings, antireflective coatings, and insulated glass are categorized as static windows. Both the solar energy reflection off the window surface and the thermal energy flow through the window may be controlled with the use of these technologies. These kinds can lower the energy requirements for buildings in a range of climates. Nevertheless, the weather has an impact on how well they function. Another option that makes use of technologies that adapt to changing external conditions is dynamic windows. These windows employ the internal interaction of materials. Thermochromic materials, electrochromic materials, liquid crystal glazing, and photovoltaic glazing are some of the most important dynamic technologies. However, these techniques are plagued by high material costs [4]. However, researching new and creative glazing systems that can effectively balance many daylighting performance parameters, including thermal and visual performance and energy-saving capabilities, is therefore crucial [5,6]. In the past several decades, high-performance Insulated Glazed Units (IGUs) have been used in the design of classic double-glazing system technology, also known as double-skin facades (DSF), to prioritize indoor comfort, low energy consumption, and sustainability. The IGUs' exceptional visual comfort, thermal performance, and aesthetic appeal have drawn a lot of interest [7].
However, when evaluating the thermal performance of glazing, two factors are usually taken into account: the solar heat gain coefficient (also known as SHGC) and the overall heat transmission coefficient (also known as U-value). Although high-performance windows often have low U-values, the ideal SHGC values vary depending on the season; high values are preferable for interior solar gains during heating mode and low levels for solar transmission limitation during cooling mode [8]. The use of high-performance IGUs into DSF systems alone, however, is far from sufficient to meet the criteria of both visual and comfort standards and building energy conservation because the effects of solar radiation through window glazing on building comfort and energy consumption vary depending on the season [9]. However, adopting DSF with a sandwich interstitial shading is a common technique to improve the thermal insulation of DSF, which in turn helps to construct good indoor visual and thermal comfort environments and improve the building's energy efficiency. Therefore, in order to maximize several competing aspects, DSF with IGUs glazing panels must be paired with shading system (SS). The perspective and cross-section of the construction of the system illustrated in Fig. 1. Architectural design has paid more attention to solar gain vs. overheating, daylight vs. lighting loads, and daylight and view vs. glare, particularly for commercial buildings that appear to have huge glazing surfaces [3]. It is therefore the most challenging task to offset daylight harvesting and manage discomfort concerns (such as glare and overheating) when selecting an SS inside a DSF. Because there are drawbacks to solar shading (SS), such as higher lighting costs and reduced winter solar gain, which raise energy costs [10]. As a result, optimizing indoor comfort levels and minimizing energy consumption should be the goal of SS design, which is also a challenging and multi-objective optimization (MOO).
Until recently, several conventional SS were developed, such as louvers, sunshades, and venetian roller blinds. These are often used since they are less expensive and simpler to install. Fixed SS may not function as intended if the operational requirements change over time. because These systems have limited capacity to adapt to changes in indoor or outdoor ambient conditions during the course of a day or season [10]. Dynamic shading (DS) is a daylighting technique that can be used to reduce energy consumption and improve interior building light efficiency. DS can prevent direct solar radiation from entering the structure and protect indoor environments from summertime sun exposure [11]. DS has been shown in earlier research to dramatically lower cooling loads and save up to 40% of energy [12,13]. However, compared to a nonuniform distribution of daylight, uniform daylighting may result in lower energy use. Therefore, improved visual comfort and energy savings result from more accurate control over dynamic shading [14]. The term "DS" here refers to the capacity to adapt to or benefit from outside weather conditions in a way that meets requirements for occupant comfort and well-being. According to this paradigm, daylighting is one of the key elements of space identity and quality and has the capacity to have a big influence on occupant productivity, comfort, health, and resource conservation. DS can be controlled automatically by sensors and actuators, or manually by the inhabitants using motorized equipment. The manually controlled version has a very poor efficiency since the occupants do not adjust the shading's location and angle whenever it would be more comfortable and energy-efficient. A manually operated dynamic system's energy-saving performance is quite unpredictable [15].
There have been numerous studies on DS within DSF systems, and most studies have incorporated field tests or simulation modeling analysis. The present issue with DSF is that in order for them to function as intended, they need to operate in a sufficiently dynamic manner. These systems have, nevertheless, been extensively researched separately to enhance interior environments by taking into account various factors such as daylighting availability, thermal and visual comfort, and energy efficiency; nonetheless, those technologies were not systematically compared. For example, Park and Augenbroe [16] studied how to optimize the DSF by adjusting the ventilation dampers and louver slat angles. They emphasized that in order to achieve greater energy efficiency in a DSF glazing system, the DSF ideal functioning for shading and ventilation would be required. According to Gratiaand De Herde [17], the orientations, insulation levels, and locations of shading devices are some of the variables that affect the efficiency of DSF. The study displayed a range of heating and cooling consumption outcomes depending on the orientations and insulation levels of the DSF. Furthermore, Firląg and Yazdanian [18] assessed different control approaches for automated window shading systems installed on a model house situated in four US cities. The controls are rule sets that make use of measurements of solar radiation and both interior and outdoor temperatures. The results of the simulation-based research show that these controls have comparable effects on site energy usage savings for the locations that were taken into consideration. Lu [19] study dynamic shading and glazing technologies to improve energy, visual, and thermal performance. The study concluded that the combination of dynamic glazing and kinetic shade outperformed other solutions in terms of overall performance and score. In study by Singh and Lazarus [20], The integration of four double glazing and combinations of internal woven roller blinds has been suggested and evaluated to enhance the energy efficiency and aesthetic comfort of newly constructed or renovated office buildings. For every combination, the energy consumptions, energy saving potentials, daylight autonomy, useful daylight illuminance, and discomfort glare free time have all been computed, compared, and analyzed. The findings of the simulation demonstrate that the office space's energy and aesthetic performances can be significantly impacted by the glass and shading options used. In order to lower energy consumption and raise thermal comfort in a residential building, Ebrahimi-Moghadam and Ildarabadi [21] employed optimal shading standards. For the eastern, western, and southern facades, they supplied the ideal shading in terms of angle, depth, and number. Al-Masrani and Al-Obaidi [22] research examined the impact of planar screen rotation on energy savings and daylight availability metrics when applying perforated solar screens on building facades. The conclusions of this study were drawn to emphasize the efficiency of developed shading systems in the tropics.
Extensive research has been conducted shading systems, yielding a diverse array of findings from field and laboratory experiments, as well as computer modeling analysis. An analysis of previous studies shows that those studies mostly looked into DSF and shading independently, as well as the effect of a small number of factors while keeping the others constant of interior and exterior shading system. Few research, however, have concentrated on SS between DSF glazing panels. However, due to conflicted objectives related to daylight design in terms visual comfort, thermal comfort, and energy performance, is always affected by the combined and interrelated effects of all variables. Another gap in studies dealing with the use of double-skin facade Insulated Glazed Units (DSF-IGUs), as it focused primarily on improving thermal and energy, meanwhile daylighting comes in second place. This research would cover these gaps in systematic evaluations of various parameters of dynamic louver shading system (DL-SS) within DSF-IGUs as high-performance integrated window system. The goal of the study is to tackle the difficult task of optimizing building design for daylighting performance in order to reduce thermal discomfort. This is because, aside from energy loads in tropical climates, thermal discomfort is one of the two main issues with daylighting design in buildings. There are also worries about the possible negative impacts on thermal discomfort and energy loads, even though all studies agree that uniform distribution of daylight can save and boost energy performance. The purpose of this study is to ascertain whether it is possible to supply an indoor office workspace with consistent and homogeneous daylight that is in line with thermal comfort and energy efficiency. To this end, a novel method of controlling the DL-SS system applied to the DSF-IGUs between panels has been developed in this study.
The main novelty is to quantify the weight of the contribution of both factors of DL-SS within DSF-IGUs to thermal comfort and energy performance via optimal daylighting availability. The contribution of this paper is lied to design of the proposed system and its contribution to achieving the conflicting goals of improved daylight design. The system is designed so that the primary purpose of DFS-IGUs is to control the direct sun and solar heat gain, meanwhile, the DL-SS aims to enhance the daylighting availability by reflect the sun light deeper and blocked to fall directly in the front areas. The objective of this paper is to compare the daylighting availability, energy performance, and thermal performance of a DL-SS within DFS-IGUs. This study develops a model based on an algorithmic system for the multiple window control system that can control daylight penetration to achieve the best-balanced daylighting, thermal performance, and energy efficiency simultaneously. The multi-criteria approach based on a parametric control and optimized method is used in this study via applied genetic algorithm multi-objective optimization approach to examine the objective functions based on simultaneous influential factors for comparing and ranking the chosen alternatives of dynamic shadings parameters and glazing in order to obtain an optimal model of this proposed system for achieving low energy consumption and improving thermal comfort from daylight availability. In order to help with the decision-making process for the design of high-performance integrated window system and their application in real conditions, this paper provides insight into optimizing design strategies for novel high-performance integrated window system DSF-IGUs/DL-SS through the use of a multi-step parametric and optimized method. This can help with the development of the next generation of highly energy-efficient windows.
2. Identification of multi-evaluation criteria
Numerous elements are often taken into account in window system research, such as energy parameters, solar heat gain, sunshine, and occupant behavior. An analysis is conducted using a set of multi-domain criteria with competing fitness objectives for optimizing daylighting into space while reducing energy consumption and occupant discomfort. This is done in order to use the multi-criteria technique for comparing and evaluating the chosen alternatives. In this research, there are three general objectives: reducing building energy consumption (EUI), and thermal comfort (PMV and PPD), and maximizing daylight availability (spatial Daylight Autonomy (sDA) and Useful daylighting illuminance (UDI)).
2.1. Daylighting performance metrics
The IES defines spatial Daylight Autonomy (sDA) as "the percentage of an analysis area that meets a minimum daylight illuminance level for a specified fraction of the operating hours per year" when assessing daylight illuminance. Put another way, this indicator demonstrates that there is adequate light in the workplace during the entire year [23]. By measuring the quantity of daylight in a specific area, the sDA calculates the percentage of that area that is over the desired illuminance (300lx) during a certain time of year (50 annual hours) [24]. Additionally, sDA displays the proportion of space that meets the 300 lx goal illuminance and at least 50% of the time spent in an indoor area on a yearly basis. [25] The yearly frequency of daylighting illumination across the workplace that falls within the range that users deem "useful" is known as the Useful daylighting illuminance (UDI) index [26]. UDI is used to assess daylight illuminance based on CBDM simulation as suggested by Nabil and Mardaljevic [27]. UDI is the most widely used metric, which has upper and lower value ranges and measures the frequency with which daylight illuminances fall within a given range during the working year (it was previously suggested to be 100–2000 lux and extended to 100–3000 lux) [28]. Notably, differing local standards or comfort needs led to different illuminance value ranges being used for the UDI bins in previous investigations, such as UDI500–1000 [29,30], UDI100–2000 [31], and UDI500–2000 [32], for Instance. Carlucci and Causone [33] used data from extensive field studies of occupant behavior to define UDI as illuminances falling between 100 and 2000 lux. Santos and Leitão [34] applied the UDI metric with four distinct bins: UDI underlit (<100 lx), UDI useful (100–300 lx), UDI autonomous (300–2000 lx), and UDI over-lit (>2000 lx). Bianand Luo [35] surveyed preferred UDI range of 300–2000 lx was chosen by most of the participant. The UDI range has recently been further separated into three bins for more methodical investigation: (i) 100–500 lux; (ii) 500–1000 lux; and (iii) 1000–2000 lux [20]. From the perspective of visual comfort, there should be enough natural light on the work plane that is free from glare, hence reducing the need for artificial lighting during office hours. According to earlier research, the UDI values of the final two bins were integrated into a single bin (500–2000 lx) and utilized in the analysis because this illuminance range has the lowest glare problems and can totally eliminate the need for artificial lighting (i.e. only illuminance values close to 2000 lx may produce glare) [36].
The IESNA standard and LEED standards state that 300 to 500 lx is the required level of illumination for office work. [37] In 2018, the most recent international standard for natural lighting, EN17037:2018, was released by the European Union. The standard comprised the following four aspects: daylight provision, sunlight, view, and glare. In contrast to the IES's recommendations, daylight provision is quantified using sDA and subsequently classified into three levels based on the illumination threshold. Furthermore, a lot of academics have looked into the relationship between daylighting measurements and users' visual comfort [38]. Additionally, threshold values for daylighting measures based on subjective assessment have been covered in several research. According to Dangol and Islam [39] observations, employees favoured an illumination intensity of 500 lx above 300 lx. Meanwhile, 500 lx was proposed as a limit level by other investigations [38]. In this study, 50% of sDA and UDI illuminance thresholds based on EN17037:2018 standard and recommended previous research of 500 lux to 2000 lux was considered to evaluate the availability of daylighting.
2.2. Thermal and energy performance
The static model (Predicted mean vote (PMV) and percentage of dissatisfied (PPD)) and the adaptive model are the two models used to model and evaluate thermal comfort [40]. Research on thermal comfort has mostly concentrated on the static technique, with efforts being made to enhance the proportion of pleased users of the adaptive approach [41]. Predicted mean vote (PMV) represents the thermal perception based on a sizable sample size. This index has a range of -3 to + 3, with the following categories: -3 means "cold," -2 means "cool," -1 means "slightly cool," 0 means "neutral," +1 means "slightly warm," +2 means "warm," and +3 means "hot." Additionally, one indicator that calculates the proportion of persons unhappy with PMV is the expected percentage of dissatisfied (PPD). Thermally acceptable indoor environments must satisfy at least 80% of space occupants, according to ASHRAE 55 criteria. It is also advised that the acceptable PPD for thermal comfort should be less than 10%, and the PMV should be between -0.5 and 0.5 [42]. Energy performance was measured using Energy Use Intensity (EUI) [43]. The office energy performance is represented by the EUI measure, which is also used to evaluate the overall heating, cooling, thermal loads, and solar gains.
3. Methodology
3.1. Genetic algorithm method and optimization tools
In the research community, mathematical problem descriptions are employed when the goal is to solve certain problems. However, they are not a simple or realistic assignment for design teams. By employing certain optimization algorithms or brute force approaches to search the whole solution space, this method has the advantage of making the genuine ideal more easily found [44]. In order to fully utilize the advantages of subjective control, optimization algorithms are introduced to explore alternatives with desired performances in sufficient quantity. This allows for the automatic compromise of multiple objectives while architects input the constraints of design variables and make the final decision. But in order to use optimization methods to relevant design issues successfully, one must be aware of their advantages and disadvantages. Tabu search, sequential search, particle swarm optimization (PSO), and genetic algorithm (GA) are the primary optimization techniques used in the building design. The first two are part of the search algorithm, while the latter two are part of the evolutionary algorithm [45].
The majority of research on building optimization employs a method of genetic algorithm (GA)-based MOO combines the use of optimization algorithms with simulation tools to produce automatic optimization [46]. Rhino with the Grasshopper plugin is one of the most widely used pieces of software in the field of optimization through parametric modelling. With the aid of Grasshopper, a graphical algorithm editor connected to Rhinoceros 3D, designers lacking formal scripting experience may swiftly create parametric forms. [47] Grasshopper can offer reliable performance in the design and optimization process by creating an architectural design that takes the environment into consideration. The Grasshopper plugins, Ladybug, Honeybee, and Octopus, are extensively utilised in parametric design, simulation, and optimization firms. [19] Ladybug and Honeybee were employed to conduct environmental assessments and calculate received daylight illuminance, energy usage, visual and thermal comfort. The honeybee plugin was used to simulate the model, variables, and goals of daylight optimization. And the EnergyPlus software used to evaluate the quantity of energy usage and thermal comfort. [42] On the other hand, Octopus is a multi-objective optimization tool that finds the optimum solutions for a range of parameters by applying the Pareto principle [48]. The field of GA-based MOO encompasses two distinct approaches: classical methods and non-traditional methods. Within the classical methods, mathematical principles have been employed to transform multi-objective optimization into a singular scalar objective problem. This transformation is achieved through the integration of user-provided weights for each individual objective. On the other hand, non-traditional methods rely on stochastic rules to identify a collection of Pareto fronts. All of the viable choice variable space's non-dominated solution sets are represented by these Pareto fronts. The border of the viable objective function space corresponds to a Pareto-optimal front, which is simply a range of compromises and trade-offs between two or more competing objectives [49]. This study employed GA-based MOO for a three-objective optimization using the non-dominated sorting genetic algorithm (NSGA-II). The NSGA-II algorithm improves the GA-based selection operation for solving the MOO.
3.2. Research framework
Aiming to support the selection of an acceptable DSF-IGUs and DS for an office building in a tropical climate, this study provides a multi-step methodological simulation-based methodology that combines daylighting, thermal, and energy-related assessments of the performance of the various choices available with multi-criteria approaches, as shown in Fig. 2. The framework of the present study utilizes a comprehensive framework which amalgamates parametric design, integrated daylight, and energy performance simulation tools, as well as GA-based MOO. Consequently, the research framework employs a method of parametric design that was formulated within Rhino/Grasshopper, Ladybug and Honeybee plug-ins. Grasshopper as a parametric interface, Rhino as a modeling tool, and Octopus as a generic algorithm multi-objective optimization. It was essential to include these tools in order to achieve the study's objectives. The tools Ladybug and Honeybee for daylight and energy analysis applications based on Radiance and EnergyPlus. The Ladybug plug-in is used to analyze several aspects of the fundamental design process, such as thermal comfort, sun radiation, shade, and weather. With the integration of energy modeling (EnergyPlus) and daylighting simulation (DaySIM and Radiance), Honeybee Plug-in provides a powerful interface for both designers and users. The Honeybee Plugin can simulate thermal energy and building loads, optimize energy consumption, assess sunshine and lighting, and do a lot more [50]. For these kinds of issues, the GA optimization approach with the Pareto Front in the Octopus multi-objective optimization plug-in of Grasshopper is a suitable option. When compared to previous solutions, the Pareto Front method offers a series of solutions from the Pareto front with fewer goal conflicts [51]. The framework started with Rhinoceros 3D and Grasshopper plugins to model the case study and identify the design variables of glazing properties and shading parameters. After identifying the DSF-IGUs and DL-SS parameters, these options are incorporated into the office building model, and their performance is evaluated using multi-objective optimization with three competing objectives to discover the most optimized trade-off solution. The design parameters of DL-SS within DSF-IGUs are connected to the GA input of Octopus, and the daylight and energy simulation outputs are connected to the Fitness input by reducing building energy consumption (EUI), and thermal comfort (PMV and PPD), and maximizing daylight availability (spatial Daylight Autonomy (sDA) and Useful daylighting illuminance (UDI)) in this study.
Figure 2
Fig. 2. Details of a multi-step methodological simulation-based approach integrating parametric models, daylight availability, thermal comfort, and energy simulations, and multi-objective optimization.
3.3. Model geometry and simulation setup
Figure 3 depicts the office model evaluated in this study with parametrically design as shown in Fig. 4, which was created in the tropical climate of Penang/Malaysia. Penang has a hot, humid tropical climate, just like other cities in Malaysia. The sun path diagram for Malaysia, as depicted in Fig. 5, demonstrated that the sun is nearly perpendicular to the horizontal surface at solar noon with minimal fluctuation throughout the year. There are two distinct solar solstices, occurring on June 21 and December, and two equinoxes, occurring on March 21 and September. The figure shows how the azimuth and altitude angles are almost perpendicular to the horizontal plane on the approximate dates of the two equinoxes, which are March 21 and September 21, respectively. The sun is highly inclined towards the north on June 21 and towards the south on December 21 [52]. According to Qahtan [53] Malaysia receives around 4, 31 kWh/m2 of total radiation year, or roughly 10 hours per day, due to its distinct sun path. As a result, the interior temperature rises. The average monthly solar radiation ranged from 4 to 4.6 kWh/m2, whereas the monthly sunshine durations varied from 9 to 13 hours. The highest monthly average was 4.52 kWh/m2 in February and 4.6 kWh/m2 in September. The average monthly maximum temperature varies from 33.5 ◦C in March/April to 31.9 ◦C in December, with an annual mean air temperature of 27 ◦C. However, from January to May, the monthly mean minimum temperatures vary from 23.1 °C to 24.3 °C [54].
The model has built with dimensions of 12.0 m width, 7.0 m depth, and 3.0 m height. The room was thought to be located on the middle floor of a multi-story building. It is surrounded by other office rooms, except for the facade, which faces south for daylighting. The south orientation was chosen because of the sun's path in Malaysia,[6,55] where the south-facing surface receives more sunlight [56,57]. As a result, the remainder of the wall is regarded as adiabatic and the south façade as diabatic. Since most office building facades have large amounts of glass, a 95% window-to-wall ratio is designated for south facade. The windows have double-clear glazing installed with an 80 cm space between each panel. Based on earlier research, a visual transmittance of 68% was chosen for glazing [58,59]. Table 1 displays the primary parameters of the office space model as well as the reflectance of opaque materials. These surface materials are perfect for offices, which have been used in this study. [59,60] The occupancy hours chosen were from 8:00 a.m. to 18:00 p.m., which are the hours when office workers work throughout the year. The analytical grid was situated at a work-plane height of 0.80 m. The spacing between sensor sites was 100 cm, with a total of 225 points, and their distance from the walls was 0.75 m (Fig. 3). Since the interior temperature is changing in accordance with applied temperature control system setpoints, the interior thermal mass of the model is of interest for this process in order to illustrate the "best-case of dynamic glazing with dynamic shading applied to double-glazing unit in tropical areas dominated by cooling demands" [48]. As a result, the office space was configured to have full air conditioning year-round and was simulated as a thermal zone. For mechanically conditioned buildings, the cooling setpoint, according to Nasrollah zadeh [61] is between 23 and 26°C, respectively. These values can be adjusted to the maximum or minimum depending on a specified range [62,63]. According to a study by [64], a room temperature of 26 °C with running fans provides the most comfortable thermal state in a tropical climate, with thermal sensation that is closest to neutral. Thermal acceptability significantly increased with the temperature set-point raised from 23 to 26 degrees Celsius, and the amount of electrical energy utilized for comfort cooling was reduced as a result. Talami and Jakubiec [65] study showed that the system set-point temperature has an increased importance for operational efficiency allowing the room temperatures ranging from 24.8 °C to 27 °C. Meanwhile, Malaysian Standard MS1525:2007 recommended the cooling temperature set points for comfort room temperature ranged from 23 to 26 °C. [66] Therefore, the 26°C indoor setpoint temperature used in this study during the day was based on the majority of earlier studies.
3.4. Design variables of DFS-IGUs and DL-SS
As mentioned above, the main idea of the proposed system in this study has two parts; to control the direct sun and solar heat gain through DSF-IGUs, and to enhance the daylighting availability by the optimum design parameters of the DL-SS through reflecting the sunlight deeper and blocked to fall directly into the front areas. Thus, there were two design variables for the high-performance integrated window systems in this study: DSF-IGUs glazing types and DL-SS parameters. This paper focuses on comparisons of four advanced glass types were classified into double glazing with Low-E coating as types of IGUs applied to DSF panels. The parameters of the four IGUs used in the simulations as shown in Table 2. These properties have been obtained from previous study by Le and Park [1]. Meanwhile, the aluminium louvres were used in this investigation as a product that is sold commercially. The design parameters of the DL-SS are parametrically controlled by changed their values to find the best solutions. As indicated in Table 3, the three design parameters that comprise the optimization parameters of the louvre in this study are their minimum/maximum and interval values. These parameters were selected as the most parameters optimized in previous studies i;e [67-70]. Figure 6 showed a detailed cross-section with characteristics of the three parameters of the proposed DL-SS. The optimization of DL-SS was organized into four distinct groups based on four IGUs glazing. In other words, the optimization of DL-SS was performed using one type of IGUs at a time. Thus, the properties of the IGUs are fixed while the parameters of the DL-SS are variable. Through parametric optimization connections, a comprehensive set of 252 configurations of DL-SS was generated for every type of IGUs.
3.5. Simulation scenarios and analysis process
The multi-step method allows the comparison of diverse alternatives of DL-SS sandwiched within DSF-IGUs are considered. For this research, as mentioned before four types of DSF-IGUs are selected, leading to the definition of four possible solutions. Two distinct procedures were used to compare the findings of the daylight coverage analysis in order to enhance the distribution of daylight during the office's occupancy hours of 8:00 am to 18:00 pm. As mentioned before, the main objective of this research is to improve thermal comfort and energy performance via utilizing optimal daylight availability. thus DL-SS within DSF-IGUs optimized into two scenarios to find the best design parameters for daylighting availability and energy performance. The first scenario was Optimized DSF-IGUs/DL-SS for daylighting availability, meanwhile, the second scenario was Optimized for energy and thermal performance. In first scenario, MOO via GA considered three objectives; UDI, EUI, and PPD is run to find the optimal DSF-IGUs/DL-SS parameters. In this case, the optimized run to achieve the best sDA and UDI percentages, given that increasing daylighting availability is DL-SS's primary purpose. It is therefore important to highlight that the primary criterion that influenced the choice of solutions was obtaining the highest percentage of UDI500−2000lux in the first position, followed by a lower percentage of total thermal load and solar gains in the second position. In the second step, the most influential criteria in the selection and ranking of the best solutions of DSF-IGUs/DL-SS parameters resulted from GA-MOO optimization processes was reducing the EUI and PPD in the first place, meanwhile keeping the UDI within the best recommended range.
During the optimization process, the office assumed that the air-conditioned was on with cooling setpoint 26 C, and the electrical lighting ware completely turned off. For both optimization steps, the optimization loop for both optimization steps ran for 20 generations, with 50 people in each generation. For the base case and four test cases of the DSF-IGU type, the entire set of about 252 design options from the DL-SS parameters that were chosen based on Table 3 were compared with one another. The best solutions were chosen as optimal design solutions based on two optimized scenarios. After performing MOO with the goal of finding the best combination of DL-SS parameters, results show different optimal solutions that minimize both the energy needs of EUI and PPD, PMV for improve thermal comfort, with provide an efficient daylight availability sDA and UDI of an office room in a tropical climate. In order to provide more design explorer solutions for each scenario, the final solution sets were saved to CSV files. Then, in each DSF-IGUs/DL-SS design instance, Design Explorer permits the creation of parallel coordinate charts to validate various design scenarios. The results of the parametric experimentation are displayed in Fig. 7, a parallel coordinate plot with a single line representing each design solution and matching performance indication. added to that UDI 500–2000 lx performance metric for each optimal solution had been presented. Table 4 displayed the best values of each design parameter of DL-SS for each DSF-IGUs case.
Figure 7
Fig. 7. Parallel coordinate and UDI 500–2000 lx performance of eight optimal solutions resulted from both optimization processes.
Table 4
Table 4. Best parameters values of DL-SS in all optimized cases solutions for both optimization processes.
4. Validation simulation model
A number of publications have successfully validated Honeybee and Ladybird plugins in recent years. As a result, these plug-ins were used in the research to simulate daylight and energy. In order to calibrate the illuminance value in this study with the anticipated readings in the simulation software, actual measurements for the illuminance value were collected in a tiny, single room inside a residential building with south facing as shown in Fig. 8. Interior surfaces (walls, floor, and ceiling) were painted white, meanwhile the material of simulation model was set in honeybee as same as real model by using Radiance parameters to convert the colours into reflectance using RGB values (red, green, blue). Illuminance data were recorded in using illuminance lux meter (TL-600 Digital Data Logging) with accuracy reading ± 4% from 0 to 10.000lx; ± 10 from 10.000 to 200.000 lx. Readings were recorded on 21 of February 2024 from 8;00 am to 18:00 am, and the average of each hour was compared with the average of simulation value. Readings were recorded at height of 80 cm at the centre of the room to reduce the errors in the measuring devices by avoiding solar radiation falling directly on the lux meter sensor (Fig. 8), which may cause some errors in the reading due to the high temperature of the sensor. In addition, due to the nature of the climate in the tropics, which is constantly changing, it differs from Model sky in simulation software which was run using climate data recorded for one year for the location of Penang, Malaysia (EnergyPlus weather file (.epw), using a Typical Meteorological Year – TMY). A comparison between the expected values from the simulation and the actual data is shown in Fig. 9. According to Hirning and Isoardi [71], there should be no more than a 15% difference between the calculated and measured values. As shown in the figure, since there was less than a 15% difference, it may be claimed that the simulation tools produce findings that are precise enough. In another studies by author using scaled-model [72] and real measurements [73] to validate the simulation model at tropics and subtropics climates respectively, found that the maximum average of relative difference was approximately 7.20% and 14.53%. The discrepancy between the field measurements' observed illuminance values and the illuminance sensors in both models account for the mistakes.
Figure 9
Fig. 9. Calibration between the anticipated results from the simulation model and the on-site measurements.
5. Results analysis
The comparison of the daylight coverage analysis’s results was performed during the occupancy time in the office from 8:00 am to 18:00 pm. In addition to the performance metrics, the daylighting level was measured at a total of three measurement points along the axis of the room. This section records the simulation results of daylighting availability using sDA and UDI, thermal comfort based on PMV and PPD indexes, and energy performance based on EUI.
5.1. Optimized for daylighting availability
In the first optimization scenario, as mentioned before, the optimization process is focused on achieving the best sDA and UDI percentages, as the primary purpose of DL-SS within DSF-IGUs system is to enhance the availability of daylighting. As previously mentioned, the primary goal of this study is to maximize the visual and thermal comfort of occupants while simultaneously minimizing energy consumption through the optimization of daylighting availability. In the context of daylighting analysis, the absence of an upper limit threshold in the sDA metric poses challenges when comparing the enhancements in daylighting. Therefore, UDI metric is employed, which measures the proportion of areas receiving illuminance between 500 lux and 2000 lux for 50% of the time in this study. Figure 10 illustrates the variation in sDA and UDI thresholds for different combinations of high-performance integrated window system DSF-IGUs/DL-SS and RC. The sDA value is represented by the horizontal line. It is evident that the sDA remains consistently lower than the RC for all DSF-IGUs/DL-SS cases. It is important to note that a higher sDA value does not necessarily indicate better indoor daylight. In this particular instance, the results suggest that the test cases exhibit improved distribution of daylighting. In the figure, the bars illustrate the variations in UDI values (500-2000 lux) with different combinations of DSF-IGUs/DL-SS. The optimization of RC and DSF-IGUs/DL-SS cases provide insights into the annual daylight comfort and discomfort periods. The comfort period refers to the duration during which the average indoor illuminance is maintained within the recommended range (500-2000 lx). On the other hand, the discomfort periods indicate the duration in which the average indoor illuminance falls below or exceeds the recommended range. However, for better daylighting distribution and availability, since sDA has no upper threshold, thus, in this study reducing sDA and improving UDI within the recommended range are used for better describing daylighting availability.
Figure 10
Fig. 10. Annual sDA and UDI Assessment of Base Case and optimized cases resulted from 1st scenario of optimization.
From Fig. 10, it is clearly noted that optimized DL-SS within DSF-IGUs performs much better than DSF-CG (RC case). For the best cases, DSF-IGUs-01/DL-SS followed by DSF-IGUs-02/DL-SS had a high percentage of areas receiving sufficient daylight. Meanwhile, other test cases had significantly varied daylight amounts during the day. From the Figure, it is clearly noted that the amount of useful daylighting availability was increased with increasing the UDI percentage, meanwhile at the same time, the daylight distribution became more homogeneous with decreasing sDA percentage. In The best cases, the average percentage of hours where the UDI is in the most desired range increases from 67.15% for RC to 91.91%, and sDA decreases from 88.6% to 66.4% after optimizing SDS parameters. As shown in Fig. 11 the integration of DL-SS into DSF-IGUs enhances the room's daylighting quality, particularly in the area around the window where over-illumination is typically an issue with traditional glass. From the figure, it is clearly noted that, in the first best case, the illuminance value in the front area of space was reduced from 1912 lux for RC to 764 lux, and the areas in the middle and back areas were enhanced from 418 lux and 239 lux for RC to 485 lux and 293 lux. In the second-best case, the illuminance value in the front area of space was reduced from 1912 lux to 748 lux, and the areas in the middle and back areas were enhanced from 418 lux and 239 lux to 483 lux and 292 lux respectively.
Figure 11
Fig. 11. Daylighting level at centre of the space at three sensors resulted from 1st scenario of optimization.
Figure 12 presented the PMV and PPD compression. It is clearly noted that the best cases were significantly improved thermal comfort by improve PMV and PPD metrics. The percentage of both PMV and PPD was decreasing for more comfort. The first best case with PMV = 1.19 and the second-best case with PMV = 1.38 show that these two cases had the best performance in the PMV factor compared to RC and other cases. Furthermore, in all optimized circumstances, the value of PPD performance an additional measure of thermal comfort in this optimization decreases. The highest decrease in the PPD factor is related to the two best-cases with PPD values was 37.93% and 45.63% respectively. Compared to RC, in the first best case, the average percentage of PMV decreased from 1.53 for RC to 1.19, and PPD from 51.42 to 37.93. In The second-best case, the average percentage of PMV decreased from 1.53 for RC to 1.38, and PPD from 51.42 to 45.63.
Figure 12
Fig. 12. PMV and PPD Assessment of Base Case and optimized cases resulted from 1st scenario of optimization.
Reducing energy consumption was selected as one of the primary research objectives in this particular investigation. The energy performance was evaluated by considering the Total Energy Use Intensity (EUI), cooling load, heating load, and interior lighting. In light of the tropical climate conditions, which do not entail a heating load period due to the geographical location, it was assumed that the heating load would be zero as used in previous studies. Following the optimization process, the optimal solutions exhibited superior outcomes in terms of energy reduction when compared to the RC. The bar chart depicted in Fig. 13 showcased the breakdown of EUI for both the RC and the DSF-IGUs/DL-SS cases. Notably, all DSF-IGUs/DL-SS cases demonstrated the lowest average lighting EUI. Total EUI and cooling load displayed the most significant variations. From the figure, it is clearly noted that the best cases significantly decreased total EUI. Compared to RC which achieved a total EUI about 382.24 kWh/m2 y, in the best cases, the average total EUI decreases to 315.4 kWh/m2 y and 325.8 kWh/m2 y respectively. The first best-case had the highest decrease among the cases by -66.88 kWh/m2 y, while the second best case reduced total EUI by -66.44 kWh/m2 y.
Figure 13
Fig. 13. Annual EUI Assessment of Base Case and optimized cases resulted from 1st scenario of optimization.
5.2. Optimization for energy and thermal performance
In this optimization scenario, the most influential criteria in the selection and ranking of the best solutions of SDS parameters resulted from MOO optimization processes was reducing the EUI and PPD in the first place, meanwhile keeping the sDA and UDI within the recommended range. The optimization results in this scenario have a similar theme to the results obtained in the first scenario, where the case of DSF-IGUs-01/DL-SS followed by DSF-IGUs-02/DL-SS are the best cases in all optimized metrics in terms of sDA, UDI, PMV, PPD, and EUI.as shown in Fig. 14 to Fig. 17. Considering daylight availability, from Fig. 14, it is clearly noted that the best cases, had a high percentage of areas receiving sufficient daylight. the amount of useful daylighting availability was increased with increasing the UDI percentage, at the same time, the daylight distribution became more homogeneous with decreasing sDA percentage. In The best cases, the average percentage of hours where the UDI is increases from 67.15% for RC to 89.91%, and sDA decreases from 88.6% to 79.09%. In The second-best cases, the average percentage of hours where the UDI is increases from 67.15% to 90.96%, and sDA decreases from 88.6% to 67.27%. In the first best case, the illuminating value in the front area of space was reduced from 1912.06 lux for RC to 564.20 lux, and the areas in the middle and back areas were enhanced from 418.52 lux and 239.75 lux for RC to 470.06 lux and 2990.68 lux. In the second-best case, the illuminating value in the front area of space was reduced from to 548.74 lux, and the areas in the middle and back areas were enhanced by increasing the illuminating value to 473.45 lux and 283.32 lux respectively.
Figure 14
Fig. 14. Annual sDA and UDI Assessment of RC and optimized cases resulted from 2nd scenario of optimization.
Figure 15
Fig. 15. Daylighting level at centre of the space at three sensors resulted from 2nd scenario of optimization.
Figure 16
Fig. 16. PMV and PPD Assessment of Base Case and optimized cases resulted from 2nd scenario of optimization.
Figure 17
Fig. 17. Annual EUI Assessment of RC and optimized cases resulted from 2nd scenario of optimization.
Regarding to thermal comfort as shown in Fig. 16, it is clearly noted that the best cases were significantly improved thermal comfort by improve PMV and PPD metrics. The percentage of both PMV and PPD was decreasing for more comfort. The first best case with PMV = 1.18 and the second-best case with PMV = 1.32. Moreover, the value of PPD was decreases in all optimized cases. The highest decrease in the PPD factor is related to the first best cases with PPD values were 35.93% and 41.63% respectively. Compared to RC, the first best case, the average percentage of PMV decreased from 1.53 for RC to 1.18, and PPD from 51.42 to 35.93. In The second-best case, the average percentage of PMV decreased from 1.53 for RC to 1.32, and PPD from 51.42 to 41.63. For energy performance, the bar chart depicted in Fig. 17 showcased the breakdown of EUI for both the RC and the different test cases. From the Figure, it is clearly noted that the best cases, significantly decreased total EUI. Compared to RC which achieved a total EUI about 382.24 kWh/m2 y, in the best cases, the average total EUI decreases to 285.4 kWh/m2 y and 25.8 kWh/m2 y respectively. The first best case had the highest decrease by -96.84 kWh/m2 y, while the second-best case reduced total EUI by -86.44 kWh/m2 y.
6. Discussion
6.1. Comparing the best cases
In this study, the optimization process was conducted under two distinct scenarios in order to identify the most favorable choices of the solution. The initial scenario involved optimizing DSF-IGUs/DL-SS specifically for daylighting availability. On the other hand, the second scenario focused on optimizing DSF-IGUs/DL-SS to enhance energy efficiency and thermal performance. In the first optimization, priority was given to daylight availability, while in the second optimization, energy efficiency and thermal comfort were given first. The final step involved comparing the results of sDA, UDI, PMV, PPD, and EUI for the best solutions selected from both optimization scenarios. This comparison aimed to identify the most optimal choices in terms of daylighting availability, thermal comfort, and energy performance. To achieve the best solution, it is required to assess the improvement of PMV, PPD, and EUI from the improvement of sDA and UDI. Table 5 and Figs. 18-20 presented a comparison of the differences of all metrics of all cases compared to RC.
Figure 18
Fig. 18. Average percentage variation of sDA and UDI resulted from both optimization scenario.
Figure 19
Fig. 19. An average percentage variation of thermal comfort of MVP and PPD resulted from both optimization scenario.
Figure 20
Fig. 20. An average percentage variation of energy performance of total EUI and cooling load resulted from both optimization scenario.
Table 5
Table 5. Comparison of the differences values of optimized metrics between optimized cases and the reference model resulted from both optimization process.
From table and the figures, the average percentage variation of daylight illuminance of sDA and UDI for the optimized DSF-IGUs/DL-SS cases are calculated compared to RC during office hours is presented. Based on the best options resulting from both optimizations, which concluded that the case DSF-IGUs-01/DL-SS has the best performance and DSF-IGUs-02/DL-SS has the second-best performance in terms of receiving daylight to reduce energy consumption and increase the performance of thermal comfort. As mentioned above, for better daylighting distribution and availability, reducing sDA and improving UDI within the recommended range are used for better describing daylighting availability. By comparing these best cases resulted from first optimization scenario with RC, it can be concluded that average variation of sDA and UDI percentages for the first best case was improved by -6.25% for sDA, and increased the UDI values by +36.86%, meanwhile, the second-best case average variation of sDA was improved by -8.30% and increased the UDI values by +35.46%. The average of PMV and PPD decreased by -22.34% and -26.22% in the first solution, and by -9.91% and -11.26% in the second solution. The total EUI and cooling load decreased by –17.49% and -20.17% in the first solution, and by -14.77% and -22.16% in the second solution. For the second optimization scenario, the average variation of sDA for the first best case was improved by -10.76%, and increased the UDI values by +33.89%, meanwhile, the second-best case average variation of sDA was improved by -24.10% and increased the UDI values by +35.46%. The average of PMV and PPD decreased by -22.99% and -28.72% in the first solution, and by -13.83% and -17.43% in the second solution. The total EUI and cooling load decreased by –25.33% and -26.20% in the first solution, and by -22.61% and -26.08% in the second solution.
6.2. Overall comparison
Based on the outcomes of two optimization scenarios, the scores and rankings of best instances for each performance indicator are covered in this part. For easier comprehension, the comparison was shown in charts and tables. Thermal comfort, energy use, and visual comfort were all given equal weight in this final comparison. Based on the best options resulting from both optimizations, The final step involved comparing the results of sDA, UDI, PMV, PPD, and EUI for the best solutions selected from both optimization scenarios. This comparison aimed to identify the most optimal choices in terms of daylighting availability, thermal comfort, and energy performance Figs. 21-23 summarized the average percentage variation (PIV%) of all metrics for all test cases compared to RC case. Meanwhile, Tables 6-8 comparing the differences and the PIV% of the optimal design cases with the number of output metrics sDA, UDI, EUI, PMV, and PPD compared to the RC to achieve the best one.
Figure 21
Fig. 21. PIV% of sDA and UDI for optimized cases compared to RC case resulted from both optimization scenario.
Figure 22
Fig. 22. PIV% of MVP and PPD for optimized cases compared to RC case resulted from both optimization scenario.
Figure 23
Fig. 23. PIV% of total EUI and cooling load for optimized cases compared to RC case resulted from both optimization scenario.
Table 6
Table 6. sDA and UDI comparing the best cases resulted from both optimization scenario with the number of daylighting metrics to achieve the best one.
Table 7
Table 7. MPV and PPD comparing the best cases resulted from both optimization scenario with the number of thermal performance metrics to achieve the best one.
Table 8
Table 8. EUI and Cooling load comparing the best cases resulted from both optimization scenario with the number of energy metrics to achieve the best one.
The tables show the overall scores of the metrics and rank these solutions based on the three objectives. Based on the best options resulting from both optimizations, which concluded that cases DSF-IGUs-01/DL-SS and DSF-IGUs-02/DL-SS have the best performance in terms of receiving daylight to reduce energy consumption and increase the performance of thermal comfort. Table 6 showed the differences and PIV% in daylight availability of four optimal solutions compared to RC. This stage of comparison, the solutions ranking based on daylighting availability. The best one with the highest score was test case DSF-IGUs-01/DL-SS resulted from first scenario optimization. The total satisfied sDA for better daylighting distribution and better daylighting availability UDI improvement were improved by -5.54% and +24.76% with an average PIV% increased by 6.25% and 36.87%, respectively. The second-highest score was achieved by test case DSF-IGUs-02/DL-SS resulted from first scenario optimization, were sDA and UDI improved by -7.36% and +23.81% with an average PIV% increased by 8.30% and 35.46%, respectively. The best cases resulting from second scenario optimization were ranking in third and fourth place. Table 6 shows the differences and PIV% in thermal comfort of four optimal solutions compared to RC. This stage of comparison, the solutions ranking is based on improvement of thermal comfort by decreasing the percentage of PMV and PPD value. The best one with the highest score was test case DSF-IGUs-01/DL-SS resulted from second scenario optimization. The differences of total PMV and PPD as shown in Table 7 for better thermal comfort achieved were -0.35% and -1.48% with an average PIV% decreased by 22.99% and 28.72%, respectively. The second-highest score was achieved by test DSF-IGUs-01/DL-SS resulted from first scenario optimization, where PMV and PPD decreased by -0.34% and -13.48% with an average PIV% decreased by 22.34% and 26.22%, respectively. Cases DSF-IGUs-02/DL-SS resulted from both optimization scenario resulting from second scenario optimization were ranking in third and fourth place. Table 8 shows the differences and PIV% in energy performance of four optimal solutions compared to RC. This stage of comparison, the solutions ranking is based on minimizing energy. Cases resulted from the second scenario optimization DSF-IGUs-01/DL-SS and DSF-IGUs-01/DL-SS achieved the highest score respectively, where the cases resulted from first scenario optimization were ranking in third and fourth place as presented in the table. The differences of total EUI and cooling load for better energy performance reduced by -96.84 kwh/m2 yr and -86.88 kwh with an average PIV% decreased by 25.33% and 26.20%, respectively. The second-highest score was decreased the total EUI and cooling load by -86.44% and -86.48% with an average PIV% decreased by 22.61% and 26.08%, respectively.
Overall, based on the optimizing objectives, the ranking of the best cases varied based on giving priority to the improvement objective in the optimization process. The best-case DSF-IGUs-01/DL-SS resulted from the second optimization scenario was overcome all best cases and ranked first in energy and thermal comfort. In this case, it is clearly noted that optimization DSF-IGUs/DL-SS with giving priority to improving energy and thermal comfort while maintaining lighting at acceptable levels is more reasonable since the main role for DSF-IGUs with DL-SS is to control the direct sun and solar heat Gain. The outcomes of the final best optimized solution resulted from both optimization steps based on best balanced of all metrics are presented in Fig. 24, which provide an illuminance map illustrating the sDA and UDI percentages for best case.
Figure 24
Fig. 24. Daylighting representations of the sDA and UDI metrics performance of the (a) RC and(b) final best optimized cases.
7. Conclusion
It is important to investigate the relationship between window design, shading, and daylight provision in office buildings, particularly in tropical climates where solar radiation is not optimally utilized in building design. Thus, the window design and its shading should aim to balance multi-criteria daylighting performance, including daylight availability and thermal comfort, with energy performance. The present study sought to optimize thermal comfort and energy performance via utilizing optimal daylight availability in the office space in the geographical area of Penang Island, Malaysia, which has a tropical climate. This paper focuses on comparisons among the four IGUs glazing types applied to DSF with sandwich DL-SS between panels. The performance of high-performance integrated window system DSF-IGUs/DL-SS have been simulated and optimized, the different outcomes in performance have been examined. In order to find evolutionary and parametric optimum solutions, the optimization approach uses GA-based MOO to define input variables and the objective function by minimizing and maximizing its threshold. Several optimal alternatives that reduce energy requirements and thermal discomfort while enhancing daylight availability in an office space for a tropical environment are revealed by the findings of a MOO that was conducted with the aim of determining the best combination of DSF-IGU attributes and best DL-SS parameters. As the primary purpose of DSF-IGUs/DL-SS is to control the direct sun and solar heat gain.
According to the results, the optimally optimized case provides improved availability and distribution of daylight throughout the office space, with an annual average of 90% area coverage for the 500–2000 lx daylight illuminance range. The suggested solution also guarantees maximum thermal comfort while using the least amount of energy. Compared to the RC, the differences of total PMV and PPD for better thermal comfort achieved were -0.35% and -1.48% with an average PIV% decreased by 22.99% and 28.72%, respectively. The differences of total energy and cooling load for better energy performance reduced by -96.84 kwh/m2. and -86.88 kwh with an average PIV% decreased by 25.33% and 26.20%, respectively. Meanwhile, the total satisfied sDA for better daylighting distribution and better daylighting availability UDI improvement were improved by -5.54% and +24.76% with an average percentage variation (PIV%) increased by 6.25% and 36.87%, respectively. This result is in agreement with other studies, in particular the study by Huang and Niu [74] about Comprehensive analysis on thermal and daylighting performance of glazing and shading designs on office building envelope in cooling-dominant climates. The findings shown that, in the case of low-e glass, window heat input may be reduced by as much as 50%, but applying shade can often result in a decrease of about 35–40%. Manzan [75] work about optimization of external fixed shading devices. The optimal solutions are reduction of primary energy consumption of up to 19% and 30% with respect the unshaded window. According to a research by De Luca and Sepúlveda [68], the shadings gave enough sunshine and a view outside while reducing visual discomfort by as much as 89.8% and primary energy usage by as much as 29.1%. Eltaweel and Su [69] study the Advanced parametric louver systems with bi-axis and two-layer designs for an extensive daylighting coverage in a deep-plan office room. The result showed that, during working hours, the suggested design exhibits promising qualities as it may cover over 90% of the floor surface with a generally consistent and distributed daylighting within the specified acceptable range of 300–500 lx. Nazari, Mirza, and Mohammadi [76] study results showed that the optimal solutions maximized the improvement in the UDI reaching between 12.1% to 59.60%. This improvement coincided with the EUI experiencing reductions ranging from 7.9% to 31.9%, while the PPD increased by 56.7%.
Although the results are innovative and the aforementioned contributions are noteworthy, it is important to recognize that there are a number of restrictions. For example, the design suggestions are limited to tropical temperature locations that have severe glare difficulties from direct sunlight and simply require cooling. Despite these drawbacks, the technique may be widely modified for use in diverse contexts, therefore the ideal answers can change greatly. To attain improved daylighting performance, future work is required to investigate the viability of this system through testing several IGUs into DSF with different slat configurations and shapes of shading system. Additionally, further study is required to fully examine the quality of view produced by the suggested setup of the DSF-IGUs/DL-SS system.
Acknowledgement
The authors gratefully acknowledge the support from the Universiti Sains Malaysia (USM) post-doctoral research fellowship scheme under the Financing Fund No. PKDK (VOT 29000).
Contributions
Ali Ahmed Bahdad: Conceptualization, Methodology, Simulation, Writing the initial draft, Writing- Original draft preparation, investigation and data analysis, Visualization, Writing-review & editing. Nooriati Taib: Supervision and Reviewing. Fahad Saud Allahaim and Ali Mohammed Ajlan: Editing.
Declaration of competing interest
The authors declare no conflict of interest.
References
- D.M. Le, D.Y. Park, J. Baek, P. Karunyasopon, and S. Chang, Multi-criteria decision making for adaptive façade optimal design in varied climates: Energy, daylight, occupants' comfort, and outdoor view analysis, Building and Environment, 223 (2022) 109479. https://doi.org/10.1016/j.buildenv.2022.109479
- A.A. Bahdad, and S.S. Fadzil. Light-shelves technique (LST) for daylight enhancement using physical scaled model and simulation approaches. in Proceeding-7th Putrajaya Int. Built Env., Tech. and Eng. Conf.(PIBEC7). 2019.
- J. Zhao, and Y. Du, Multi-objective optimization design for windows and shading configuration considering energy consumption and thermal comfort: A case study for office building in different climatic regions of China, Solar Energy, 206 (2020) 997-1017. https://doi.org/10.1016/j.solener.2020.05.090
- S. Jalaly, and M. Shahabadi, Micro-patterned glass for energy-efficient windows, Results in Engineering, 21 (2024) 101762. https://doi.org/10.1016/j.rineng.2024.101762
- A.A. Bahdad, S. Syed Fadzil, and N. Taib, Evaluating kinetic light-shelves and their impacts on daylighting performance, Indonesian J Electr Eng Comp Sci, 19 (2020) 482-490. https://doi.org/10.11591/ijeecs.v19.i1.pp476-484
- A.A.S. Bahdad, and S.F.S. Fadzil, Design Optimization for Light-Shelves with Regard to Daylighting Performance Improvements in The Tropics, Journal of Advanced Research in Fluid Mechanics and Thermal Sciences, 100 (2022) 35-50. https://doi.org/10.37934/arfmts.100.3.3550
- X. Wang, L. Zhang, X. Su, and H. Yang, Daylighting and energy performance of the window with transparent insulation slats in the humid subtropical climate zone, Energy and Buildings, 300 (2023) 113685. https://doi.org/10.1016/j.enbuild.2023.113685
- M. Dabbagh, and M. Krarti, Energy performance of switchable window insulated shades for US residential buildings, Journal of Building Engineering, 43 (2021) 102584. https://doi.org/10.1016/j.jobe.2021.102584
- K. Lai, W. Wang, and H. Giles, Solar shading performance of window with constant and dynamic shading function in different climate zones, Solar Energy, 147 (2017) 113-125. https://doi.org/10.1016/j.solener.2016.10.015
- A. Tabadkani, A. Roetzel, H.X. Li, and A. Tsangrassoulis, Design approaches and typologies of adaptive facades: A review, Automation in Construction, 121 (2021) 103450. https://doi.org/10.1016/j.autcon.2020.103450
- T. Berger, C. Amann, H. Formayer, A. Korjenic, B. Pospichal, C. Neururer, and R. Smutny, Impacts of external insulation and reduced internal heat loads upon energy demand of offices in the context of climate change in Vienna, Austria, Journal of Building Engineering, 5 (2016) 86-95. https://doi.org/10.1016/j.jobe.2015.11.005
- N.A. Azmi, and S.H. Ibrahim, A comprehensive review on thermal performance and envelope thermal design of mosque buildings, Building and Environment, 185 (2020) 107305. https://doi.org/10.1016/j.buildenv.2020.107305
- A. Eltaweel, and Y. Su, Evaluation of suitability of a parametrically controlled louvers for various orientations throughout a year comparing to an existing case, Buildings, 7 (2017) 109. https://doi.org/10.3390/buildings7040109
- M. Alkhater, M. Alsukkar, A. Eltaweel, and Y. Su, Parametric control of multiple blinds to enhance daylighting performance in the dome building: Case study of a mosque building in Saudi Arabia, Solar Energy, 266 (2023) 112180. https://doi.org/10.1016/j.solener.2023.112180
- F. De Luca, H. Voll, and M. Thalfeldt, Comparison of static and dynamic shading systems for office building energy consumption and cooling load assessment, Management of Environmental Quality: An International Journal, 29 (2018) 978-998. https://doi.org/10.1108/MEQ-01-2018-0008
- C.-S. Park, G. Augenbroe, N. Sadegh, M. Thitisawat, and T. Messadi, Real-time optimization of a double-skin façade based on lumped modeling and occupant preference, Building and Environment, 39 (2004) 939-948. https://doi.org/10.1016/j.buildenv.2004.01.018
- E. Gratia, and A. De Herde, Are energy consumptions decreased with the addition of a double-skin?, Energy and Buildings, 39 (2007) 605-619. https://doi.org/10.1016/j.enbuild.2006.10.002
- S. Firląg, M. Yazdanian, C. Curcija, C. Kohler, S. Vidanovic, R. Hart, and S. Czarnecki, Control algorithms for dynamic windows for residential buildings, Energy and Buildings, 109 (2015) 157-173. https://doi.org/10.1016/j.enbuild.2015.09.069
- W. Lu, Dynamic Shading and Glazing Technologies: Improve Energy, Visual, and Thermal Performance, Energy and Built Environment, 5 (2024) 211-229. https://doi.org/10.1016/j.enbenv.2022.09.004
- R. Singh, I.J. Lazarus, and V.V.N. Kishore, Effect of internal woven roller shade and glazing on the energy and daylighting performances of an office building in the cold climate of Shillong, Applied Energy, 159 (2015) 317-333. https://doi.org/10.1016/j.apenergy.2015.09.009
- A. Ebrahimi-Moghadam, P. Ildarabadi, K. Aliakbari, and F. Fadaee, Sensitivity analysis and multi-objective optimization of energy consumption and thermal comfort by using interior light shelves in residential buildings, Renewable Energy, 159 (2020) 736-755. https://doi.org/10.1016/j.renene.2020.05.127
- S.M. Al-Masrani, K.M. Al-Obaidi, N.A. Zalin, and M.I. Aida Isma, Design optimisation of solar shading systems for tropical office buildings: Challenges and future trends, Solar Energy, 170 (2018) 849-872. https://doi.org/10.1016/j.solener.2018.04.047
- T. Kazanasmaz, L.O. Grobe, C. Bauer, M. Krehel, and S. Wittkopf, Three approaches to optimize optical properties and size of a South-facing window for spatial Daylight Autonomy, Building and Environment, 102 (2016) 243-256. https://doi.org/10.1016/j.buildenv.2016.03.018
- Z.S. Zomorodian, and M. Tahsildoost, Assessment of window performance in classrooms by long term spatial comfort metrics, Energy and Buildings, 134 (2017) 80-93. https://doi.org/10.1016/j.enbuild.2016.10.018
- S. Vera, D. Uribe, W. Bustamante, and G. Molina, Optimization of a fixed exterior complex fenestration system considering visual comfort and energy performance criteria, Building and Environment, 113 (2017) 163-174. https://doi.org/10.1016/j.buildenv.2016.07.027
- N.S. Shafavi, Z.S. Zomorodian, M. Tahsildoost, and M. Javadi, Occupants visual comfort assessments: A review of field studies and lab experiments, Solar Energy, 208 (2020) 249-274. https://doi.org/10.1016/j.solener.2020.07.058
- A. Nabil, and J. Mardaljevic, Useful daylight illuminances: A replacement for daylight factors, Energy and Buildings, 38 (2006) 905-913. https://doi.org/10.1016/j.enbuild.2006.03.013
- A. Nabil, and J. Mardaljevic, Useful daylight illuminance: a new paradigm for assessing daylight in buildings, Lighting Research & Technology, 37 (2005) 41-57. https://doi.org/10.1191/1365782805li128oa
- L. Li, M. Qu, and S. Peng, Performance evaluation of building integrated solar thermal shading system: Building energy consumption and daylight provision, Energy and Buildings, 113 (2016) 189-201. https://doi.org/10.1016/j.enbuild.2015.12.040
- H. Shen, and A. Tzempelikos, Daylighting and energy analysis of private offices with automated interior roller shades, Solar Energy, 86 (2012) 681-704. https://doi.org/10.1016/j.solener.2011.11.016
- A. Zani, M. Andaloro, L. Deblasio, P. Ruttico, and A.G. Mainini, Computational Design and Parametric Optimization Approach with Genetic Algorithms of an Innovative Concrete Shading Device System, Procedia Engineering, 180 (2017) 1473-1483. https://doi.org/10.1016/j.proeng.2017.04.310
- R. Liang, Y. Sun, M. Aburas, R. Wilson, and Y. Wu, An exploration of the combined effects of NIR and VIS spectrally selective thermochromic materials on building performance, Energy and Buildings, 201 (2019) 149-162. https://doi.org/10.1016/j.enbuild.2019.05.061
- S. Carlucci, F. Causone, F. De Rosa, and L. Pagliano, A review of indices for assessing visual comfort with a view to their use in optimization processes to support building integrated design, Renewable and Sustainable Energy Reviews, 47 (2015) 1016-1033. https://doi.org/10.1016/j.rser.2015.03.062
- L. Santos, A. Leitão, and L. Caldas, A comparison of two light-redirecting fenestration systems using a modified modeling technique for Radiance 3-phase method simulations, Solar Energy, 161 (2018) 47-63. https://doi.org/10.1016/j.solener.2017.12.020
- Y. Bian, and T. Luo, Investigation of visual comfort metrics from subjective responses in China: A study in offices with daylight, Building and Environment, 123 (2017) 661-671. https://doi.org/10.1016/j.buildenv.2017.07.035
- R. Singh, I.J. Lazarus, and V.V.N. Kishore, Uncertainty and sensitivity analyses of energy and visual performances of office building with external venetian blind shading in hot-dry climate, Applied Energy, 184 (2016) 155-170. https://doi.org/10.1016/j.apenergy.2016.10.007
- H. Sarmadi, and M. Mahdavinejad, A designerly approach to Algae-based large open office curtain wall Façades to integrated visual comfort and daylight efficiency, Solar Energy, 251 (2023) 350-365. https://doi.org/10.1016/j.solener.2023.01.021
- B. Liu, Y. Liu, Q. Deng, and K. Hu, A study on daylighting metrics related to the subjective evaluation of daylight and visual comfort of students in China, Energy and Buildings, 287 (2023) 113001. https://doi.org/10.1016/j.enbuild.2023.113001
- R. Dangol, M.S. Islam, M. Hyvärinen, P. Bhushal, M. Puolakka, and L. Halonen, User acceptance studies for LED office lighting: Preference, naturalness and colourfulness, Lighting Research & Technology, 47 (2015) 36-53. https://doi.org/10.1177/1477153513514424
- N. Delgarm, B. Sajadi, and S. Delgarm, Multi-objective optimization of building energy performance and indoor thermal comfort: A new method using artificial bee colony (ABC), Energy and Buildings, 131 (2016) 42-53. https://doi.org/10.1016/j.enbuild.2016.09.003
- L.A. López-Pérez, J.J. Flores-Prieto, and C. Ríos-Rojas, Adaptive thermal comfort model for educational buildings in a hot-humid climate, Building and Environment, 150 (2019) 181-194. https://doi.org/10.1016/j.buildenv.2018.12.011
- A. Khani, M. Khakzand, and M. Faizi, Multi-objective optimization for energy consumption, visual and thermal comfort performance of educational building (case study: Qeshm Island, Iran), Sustainable Energy Technologies and Assessments, 54 (2022) 102872. https://doi.org/10.1016/j.seta.2022.102872
- Y. Fang, and S. Cho, Design optimization of building geometry and fenestration for daylighting and energy performance, Solar Energy, 191 (2019) 7-18. https://doi.org/10.1016/j.solener.2019.08.039
- V. Machairas, A. Tsangrassoulis, and K. Axarli, Algorithms for optimization of building design: A review, Renewable and Sustainable Energy Reviews, 31 (2014) 101-112. https://doi.org/10.1016/j.rser.2013.11.036
- Y. Wang, and C. Wei, Design optimization of office building envelope based on quantum genetic algorithm for energy conservation, Journal of Building Engineering, 35 (2021) 102048. https://doi.org/10.1016/j.jobe.2020.102048
- Y. Xu, G. Zhang, C. Yan, G. Wang, Y. Jiang, and K. Zhao, A two-stage multi-objective optimization method for envelope and energy generation systems of primary and secondary school teaching buildings in China, Building and Environment, 204 (2021) 108142. https://doi.org/10.1016/j.buildenv.2021.108142
- P. Bakmohammadi, and E. Noorzai, Optimization of the design of the primary school classrooms in terms of energy and daylight performance considering occupants' thermal and visual comfort, Energy Reports, 6 (2020) 1590-1607. https://doi.org/10.1016/j.egyr.2020.06.008
- A.A. Salem Bahdad, S.F. Syed Fadzil, H.O. Onubi, and S.A. BenLasod, Balancing daylight in office spaces with respect to the indoor thermal environment through optimization of light shelves design parameters in the tropics, Indoor and Built Environment, 31 (2022) 1963-1985. https://doi.org/10.1177/1420326X221086537
- Y.K. Yi, Building facade multi-objective optimization for daylight and aesthetical perception, Building and Environment, 156 (2019) 178-190. https://doi.org/10.1016/j.buildenv.2019.04.002
- H. Shen, and A. Tzempelikos, Sensitivity analysis on daylighting and energy performance of perimeter offices with automated shading, Building and Environment, 59 (2013) 303-314. https://doi.org/10.1016/j.buildenv.2012.08.028
- N. Delgarm, B. Sajadi, S. Delgarm, and F. Kowsary, A novel approach for the simulation-based optimization of the buildings energy consumption using NSGA-II: Case study in Iran, Energy and Buildings, 127 (2016) 552-560. https://doi.org/10.1016/j.enbuild.2016.05.052
- H. Djamila, C.C. Ming, and S. Kumaresan, Estimation of exterior vertical daylight for the humid tropic of Kota Kinabalu city in East Malaysia, Renewable Energy, 36 (2011) 9-15. https://doi.org/10.1016/j.renene.2010.06.040
- A.M. Qahtan, Thermal performance of a double-skin façade exposed to direct solar radiation in the tropical climate of Malaysia: A case study, Case Studies in Thermal Engineering, 14 (2019) 100419. https://doi.org/10.1016/j.csite.2019.100419
- A. Ghaffarianhoseini, U. Berardi, A. Ghaffarianhoseini, and K. Al-Obaidi, Analyzing the thermal comfort conditions of outdoor spaces in a university campus in Kuala Lumpur, Malaysia, Science of The Total Environment, 666 (2019) 1327-1345. https://doi.org/10.1016/j.scitotenv.2019.01.284
- A.A. Bahdad, S.S. Fadzil, and N. Taib, Evaluating the effects of light-shelves to daylight distribution at south facing window using physical scaled-model method, International Journal of Sustainable Building Technology and Urban Development, 11 (2020) 2-15.
- A.A.S. Bahdad, S.F.S. Fadzil, H.O. Onubi, and S.A. BenLasod, Sensitivity analysis linked to multi-objective optimization for adjustments of light-shelves design parameters in response to visual comfort and thermal energy performance, Journal of Building Engineering, 44 (2021) 102996. https://doi.org/10.1016/j.jobe.2021.102996
- S.N. Kamaruzzaman, R. Edwards, E.M.A. Zawawi, and A.I. Che-Ani, Achieving energy and cost savings through simple daylighting control in tropical historic buildings, Energy and Buildings, 90 (2015) 85-93. https://doi.org/10.1016/j.enbuild.2014.12.045
- S. Lee, and K.S. Lee, A Study on the improvement of the evaluation scale of discomfort glare in educational facilities, Energies, 12 (2019) 3265. https://doi.org/10.3390/en12173265
- A. Tabadkani, S. Banihashemi, and M.R. Hosseini, Daylighting and visual comfort of oriental sun responsive skins: A parametric analysis, Building Simulation, 11 (2018) 663-676. https://doi.org/10.1007/s12273-018-0433-0
- Y.-W. Lim, and C.Y.S. Heng, Dynamic internal light shelf for tropical daylighting in high-rise office buildings, Building and Environment, 106 (2016) 155-166. https://doi.org/10.1016/j.buildenv.2016.06.030
- N. Nasrollahzadeh, Comprehensive building envelope optimization: Improving energy, daylight, and thermal comfort performance of the dwelling unit, Journal of Building Engineering, 44 (2021) 103418. https://doi.org/10.1016/j.jobe.2021.103418
- M. Palme, R. Privitera, and D. La Rosa, The shading effects of Green Infrastructure in private residential areas: Building Performance Simulation to support urban planning, Energy and Buildings, 229 (2020) 110531. https://doi.org/10.1016/j.enbuild.2020.110531
- L.L.H. Peng, Z. Jiang, X. Yang, Q. Wang, Y. He, and S.S. Chen, Energy savings of block-scale facade greening for different urban forms, Applied Energy, 279 (2020) 115844. https://doi.org/10.1016/j.apenergy.2020.115844
- A. Lipczynska, S. Schiavon, and L.T. Graham, Thermal comfort and self-reported productivity in an office with ceiling fans in the tropics, Building and Environment, 135 (2018) 202-212. https://doi.org/10.1016/j.buildenv.2018.03.013
- R. Talami, and J.A. Jakubiec, Early-design sensitivity of radiant cooled office buildings in the tropics for building performance, Energy and Buildings, 223 (2020) 110177. https://doi.org/10.1016/j.enbuild.2020.110177
- W.I.W. Nazi, Y.D. Wang, and T. Roskilly, Methodologies to Reduce Cooling Load using Heat Balance Analysis: A Case Study in an Office Building in a Tropical Country, Energy Procedia, 75 (2015) 1269-1274. https://doi.org/10.1016/j.egypro.2015.07.185
- M. Alsukkar, M. Hu, A. Eltaweel, and Y. Su, Daylighting performance improvements using of split louver with parametrically incremental slat angle control, Energy and Buildings, 274 (2022) 112444. https://doi.org/10.1016/j.enbuild.2022.112444
- F. De Luca, A. Sepúlveda, and T. Varjas, Multi-performance optimization of static shading devices for glare, daylight, view and energy consideration, Building and Environment, 217 (2022) 109110. https://doi.org/10.1016/j.buildenv.2022.109110
- A. Eltaweel, Y. Su, Q. Lv, and H. Lv, Advanced parametric louver systems with bi-axis and two-layer designs for an extensive daylighting coverage in a deep-plan office room, Solar Energy, 206 (2020) 596-613. https://doi.org/10.1016/j.solener.2020.06.035
- A.A. Freewan, L. Shao, and S. Riffat, Interactions between louvers and ceiling geometry for maximum daylighting performance, Renewable Energy, 34 (2009) 223-232. https://doi.org/10.1016/j.renene.2008.03.019
- M.B. Hirning, G.L. Isoardi, and V.R. Garcia-Hansen, Prediction of discomfort glare from windows under tropical skies, Building and Environment, 113 (2017) 107-120. https://doi.org/10.1016/j.buildenv.2016.08.005
- A.A.S. Bahdad, S.F.S. Fadzil, and N. Taib, Optimization of daylight performance based on controllable light-shelf parameters using genetic algorithms in the tropical climate of Malaysia, Journal of Daylighting, 7 (2020) 122-136. https://doi.org/10.15627/jd.2020.10
- A.M. Qahtan, A.A.S. Bahdad, N. Al-Tamimi, and S.F. Syed Fadzil, Optimizing daylighting in lecture halls within hot-arid climates through modification of glazing systems with light-shelves: A parametric design approach, Indoor and Built Environment, (2024) 1420326X241226651. https://doi.org/10.1177/1420326X241226651
- Y. Huang, J.-l. Niu, and T.-m. Chung, Comprehensive analysis on thermal and daylighting performance of glazing and shading designs on office building envelope in cooling-dominant climates, Applied Energy, 134 (2014) 215-228. https://doi.org/10.1016/j.apenergy.2014.07.100
- M. Manzan, Genetic optimization of external fixed shading devices, Energy and Buildings, 72 (2014) 431-440. https://doi.org/10.1016/j.enbuild.2014.01.007
- S. Nazari, P.K. MirzaMohammadi, B. Sajadi, P. Pilehchi Ha, S. Talatahari, and P. Sareh, Designing energy-efficient and visually-thermally comfortable shading systems for office buildings in a cooling-dominant climate, Energy Reports, 10 (2023) 3863-3881. https://doi.org/10.1016/j.egyr.2023.10.062
Copyright © 2024 The Author(s). Published by solarlits.com.
 HOME
HOME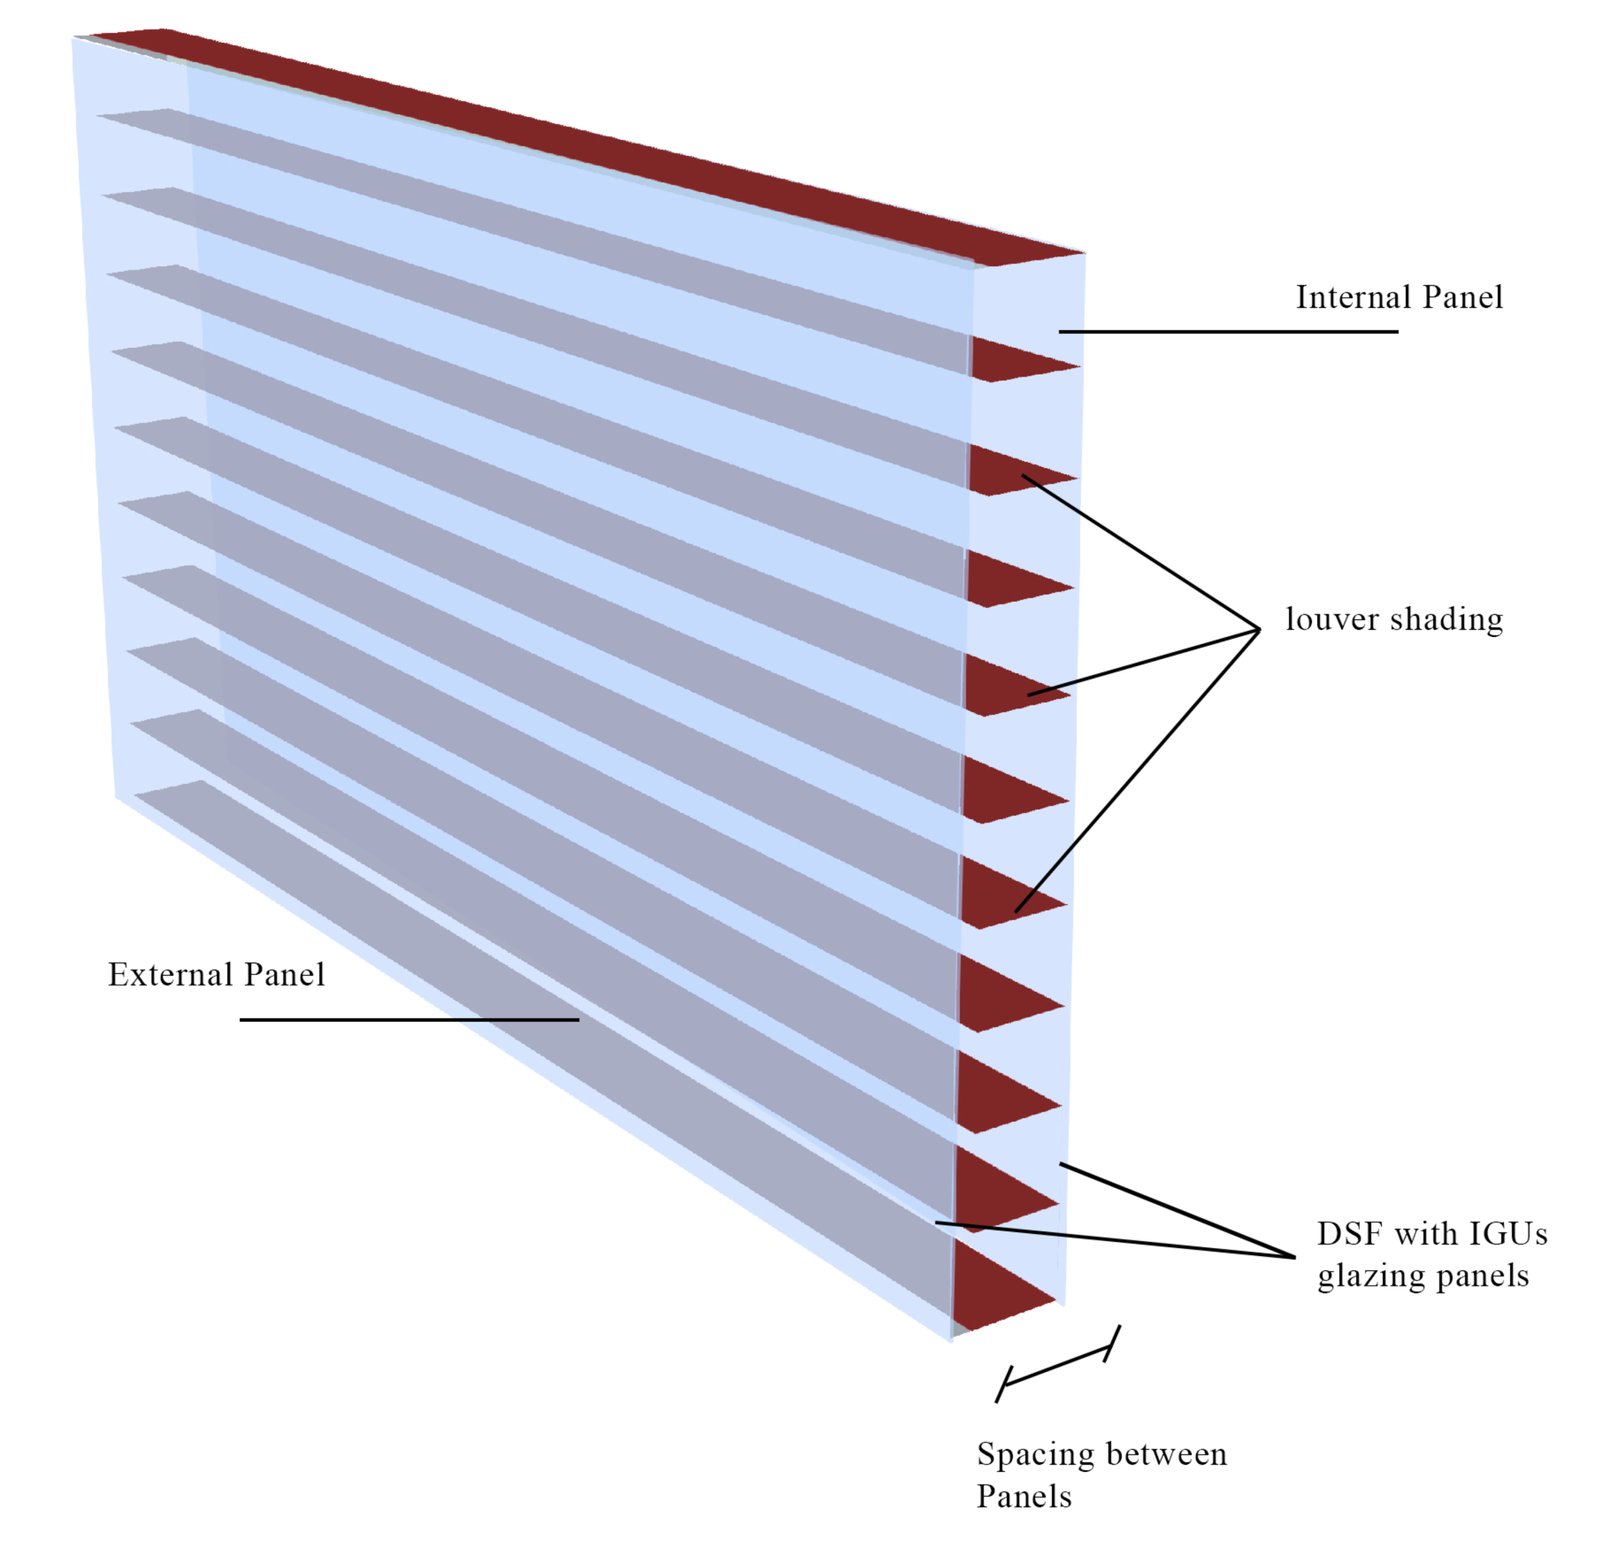 Figure 1
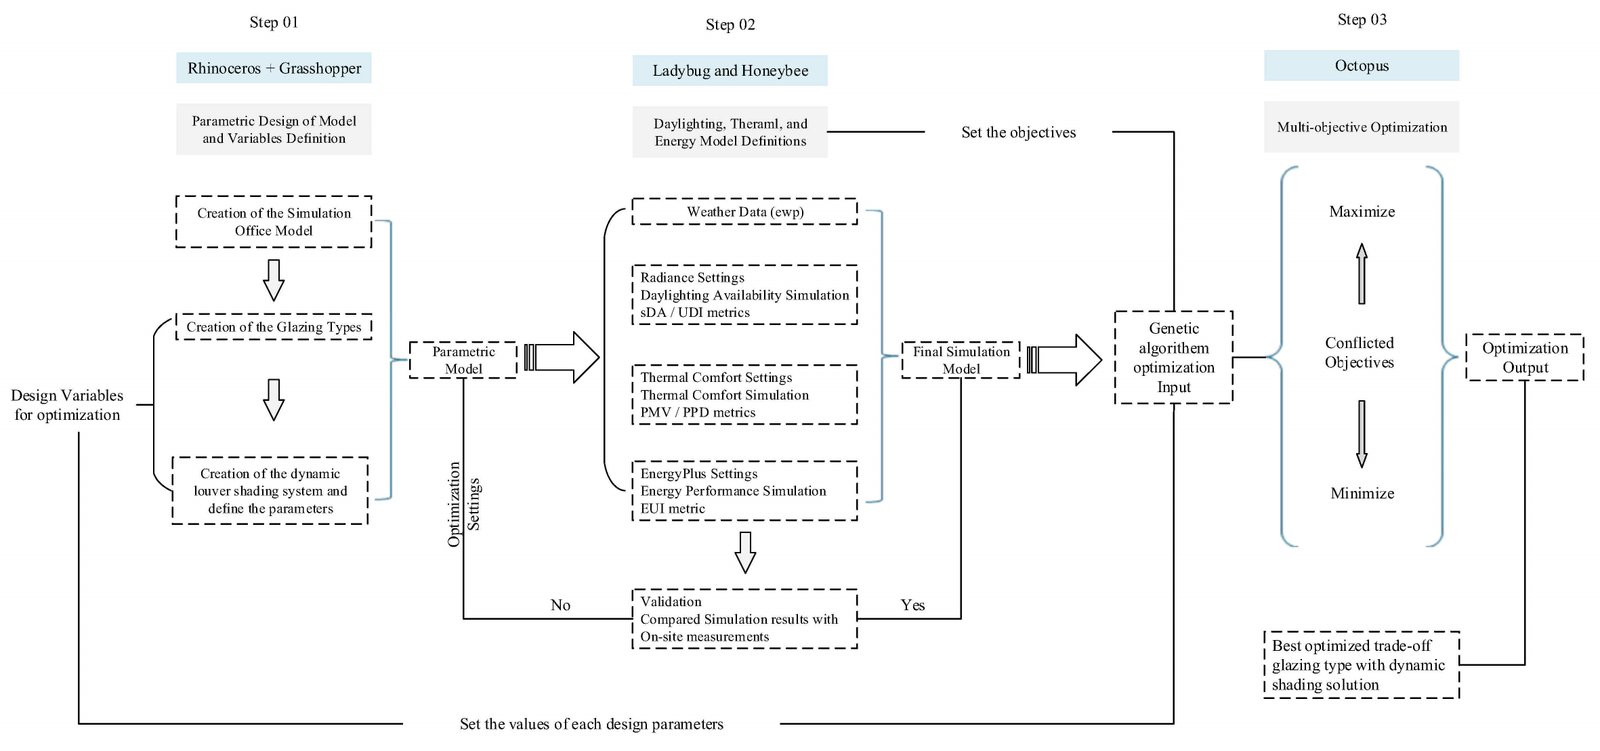 Figure 2
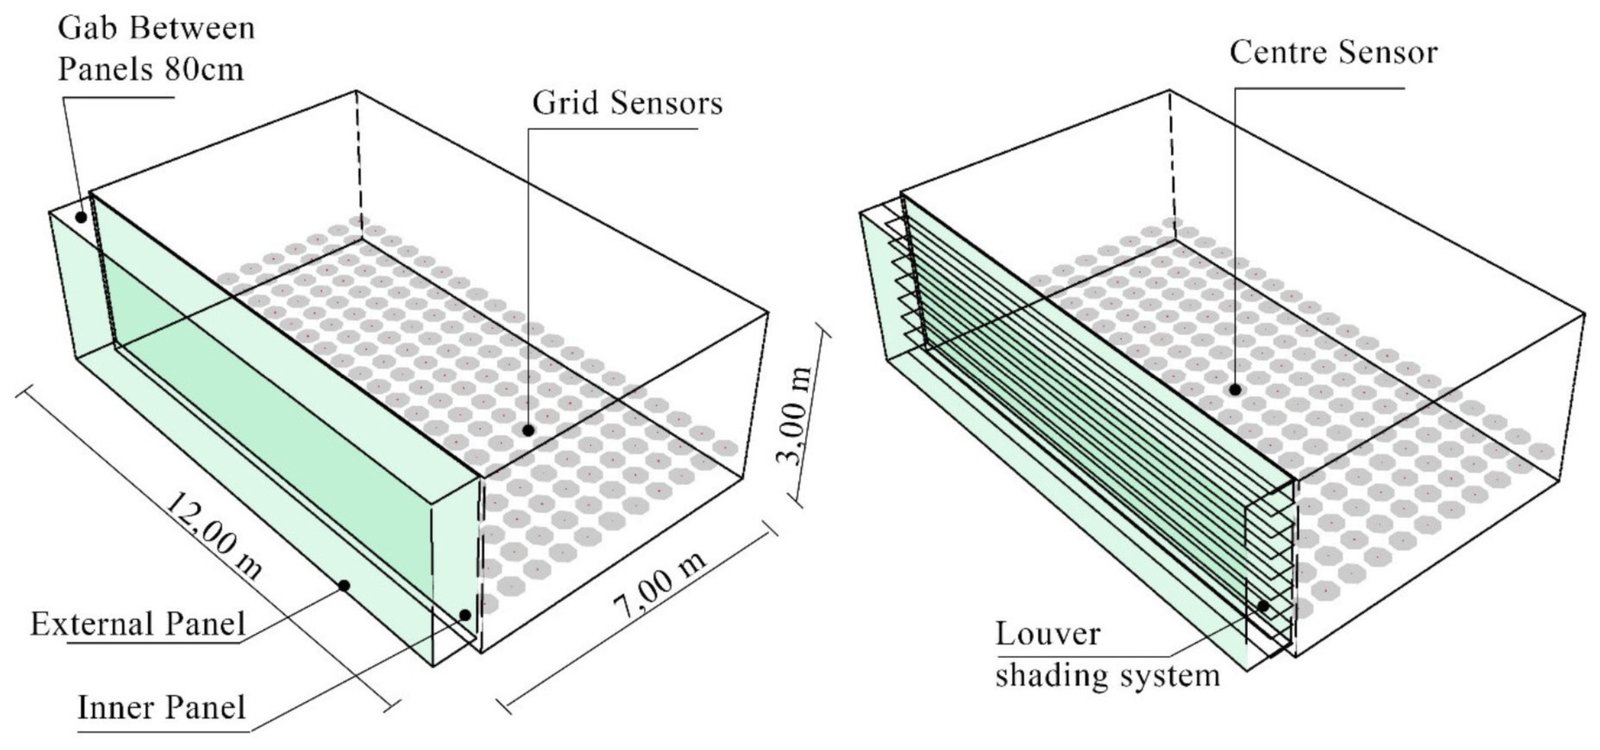 Figure 3
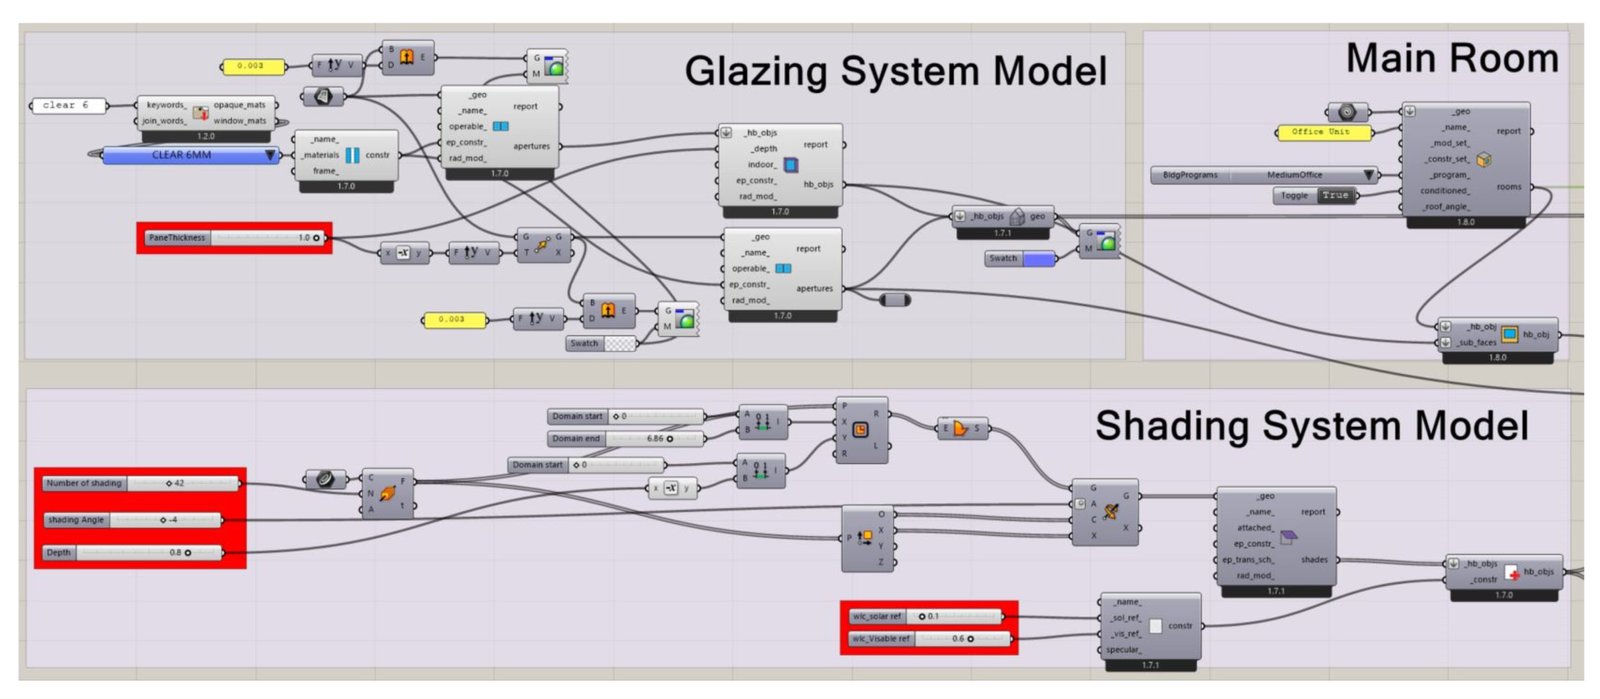 Figure 4
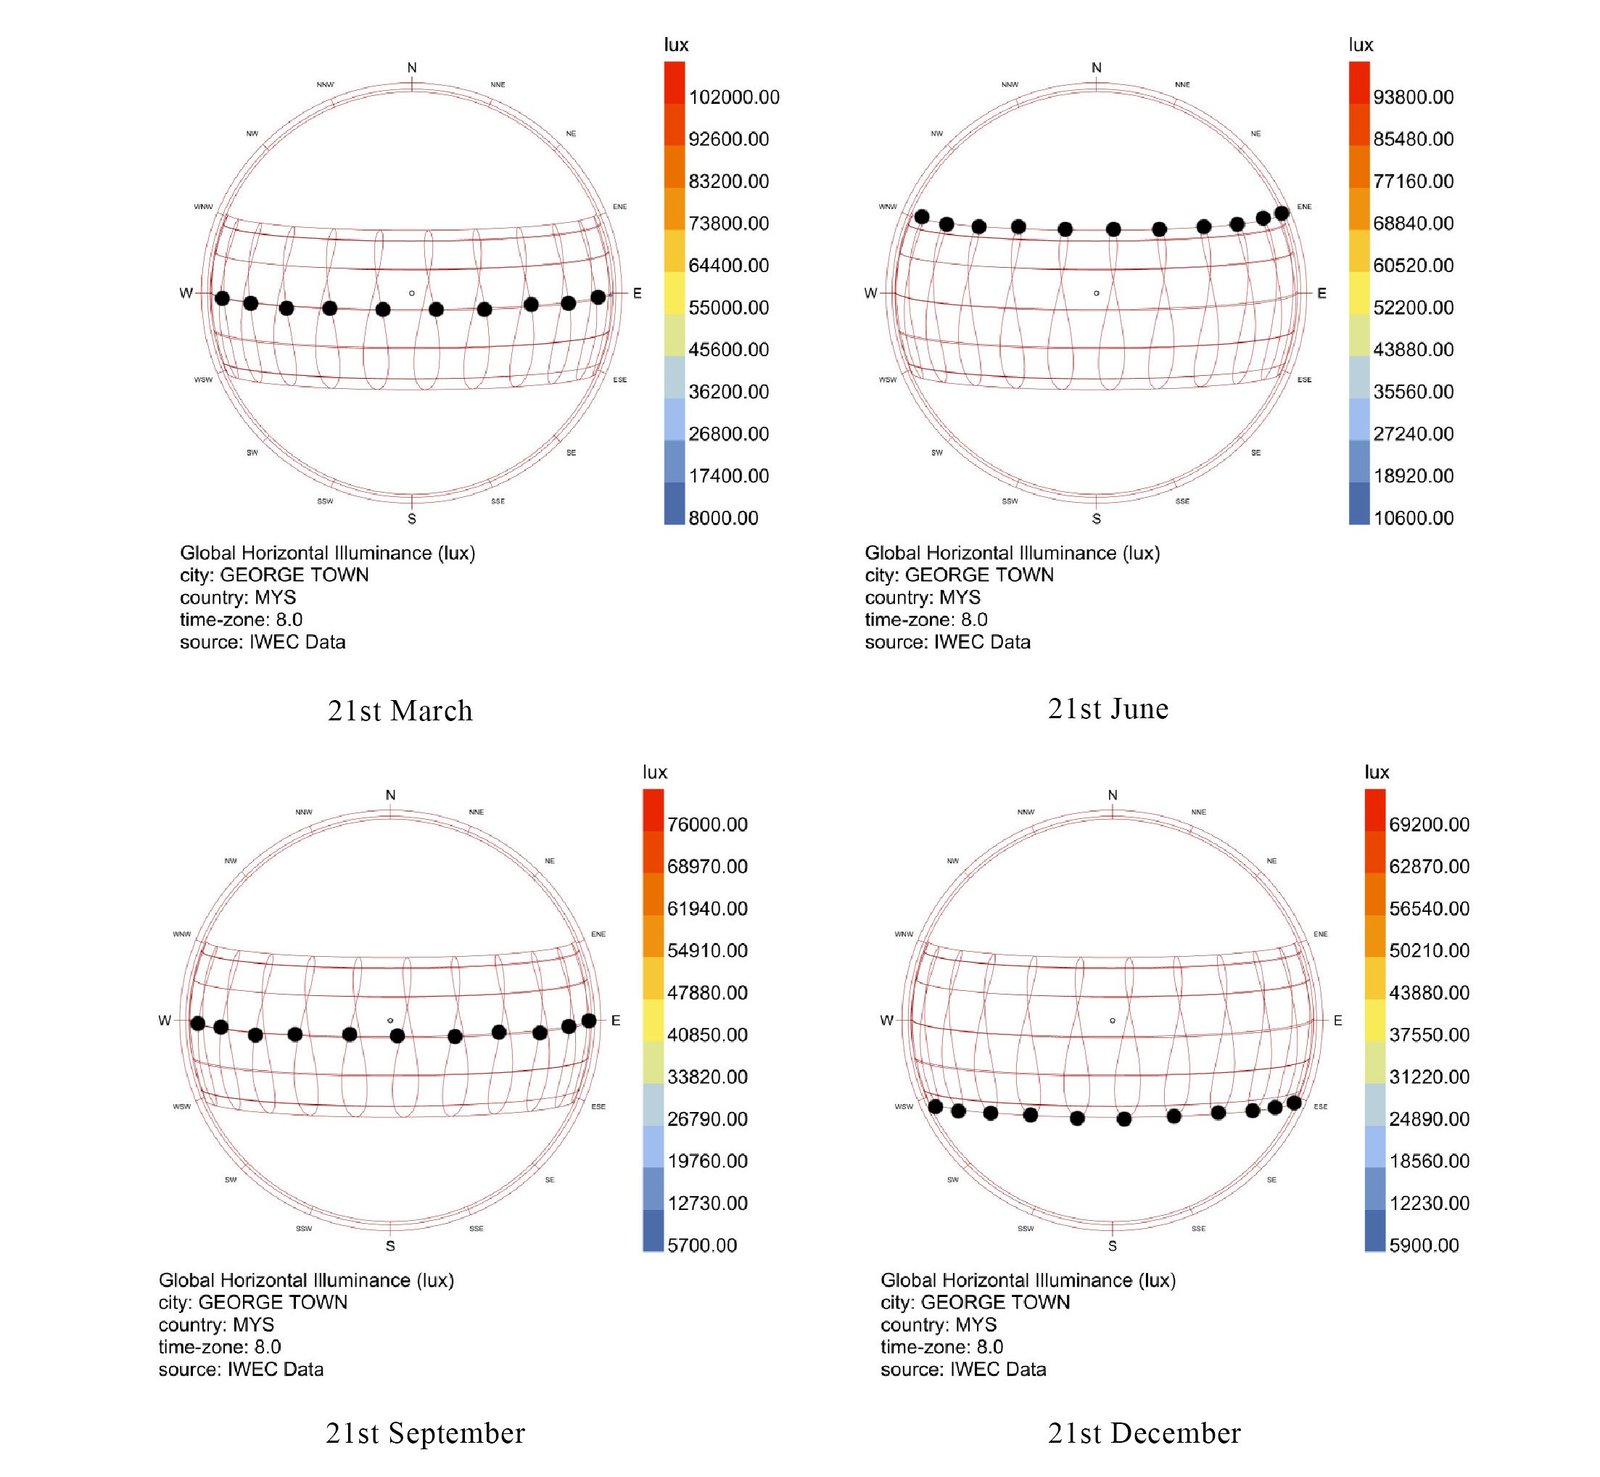 Figure 5
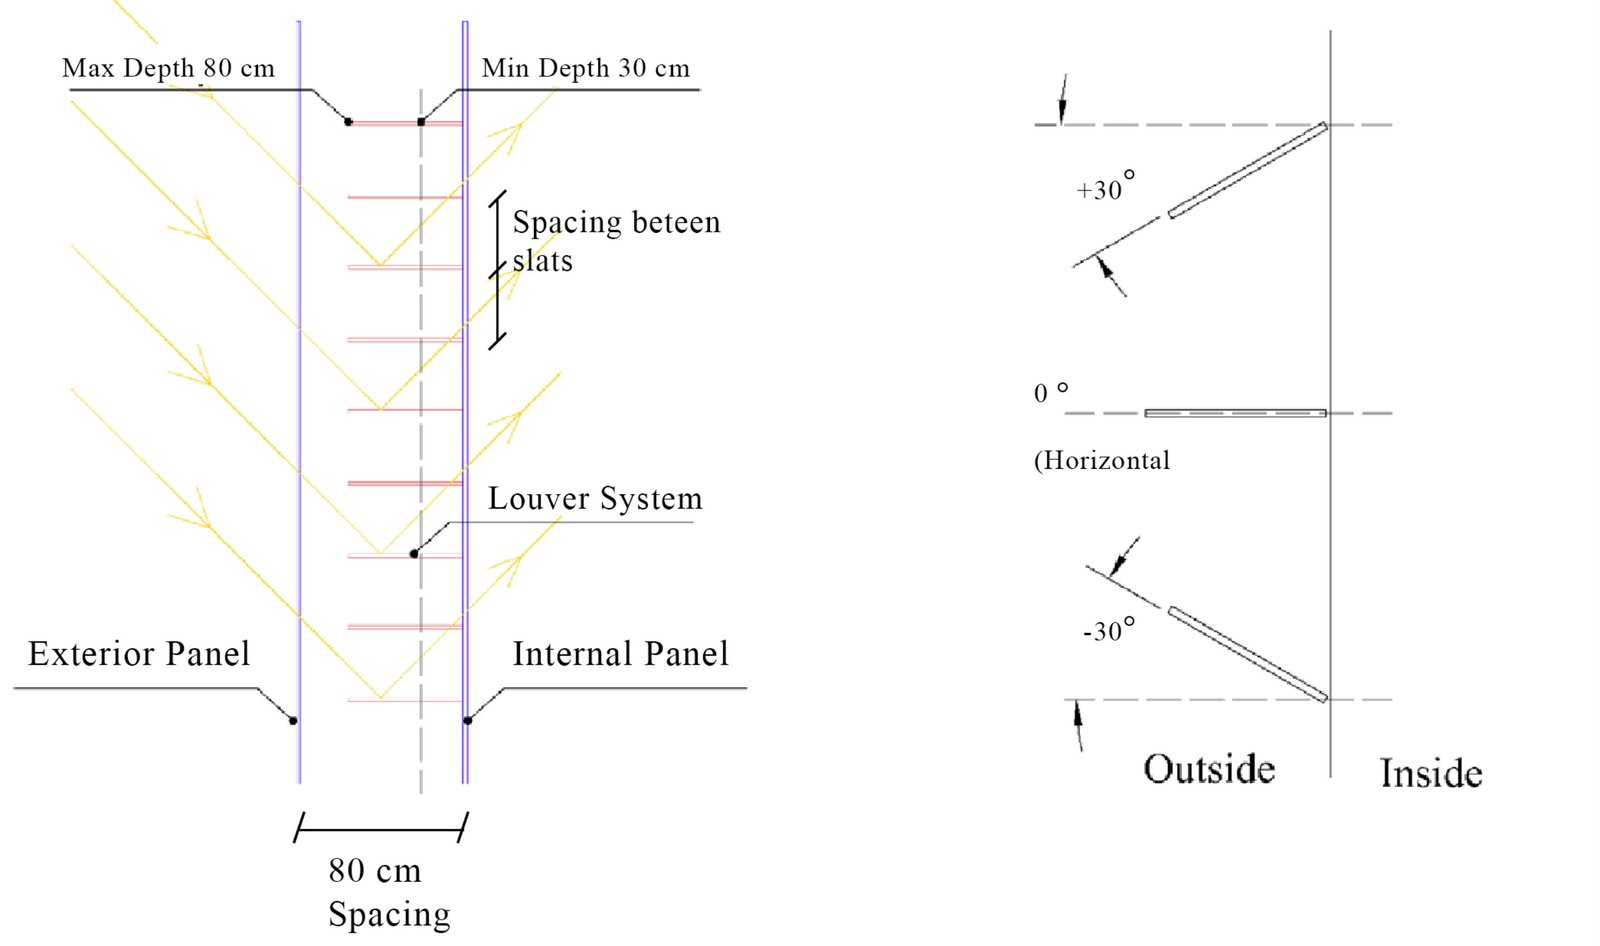 Figure 6
 Figure 7
 Figure 8
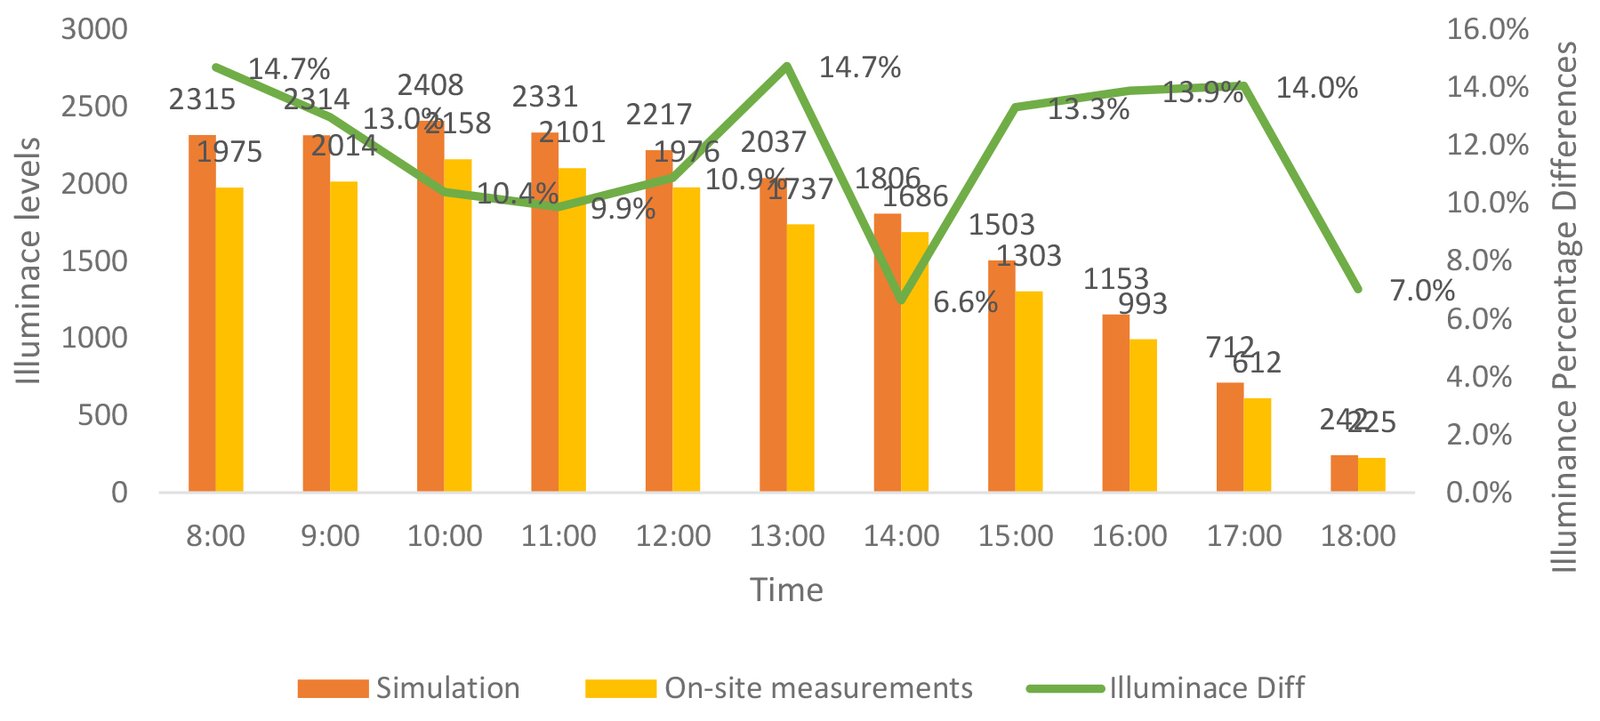 Figure 9
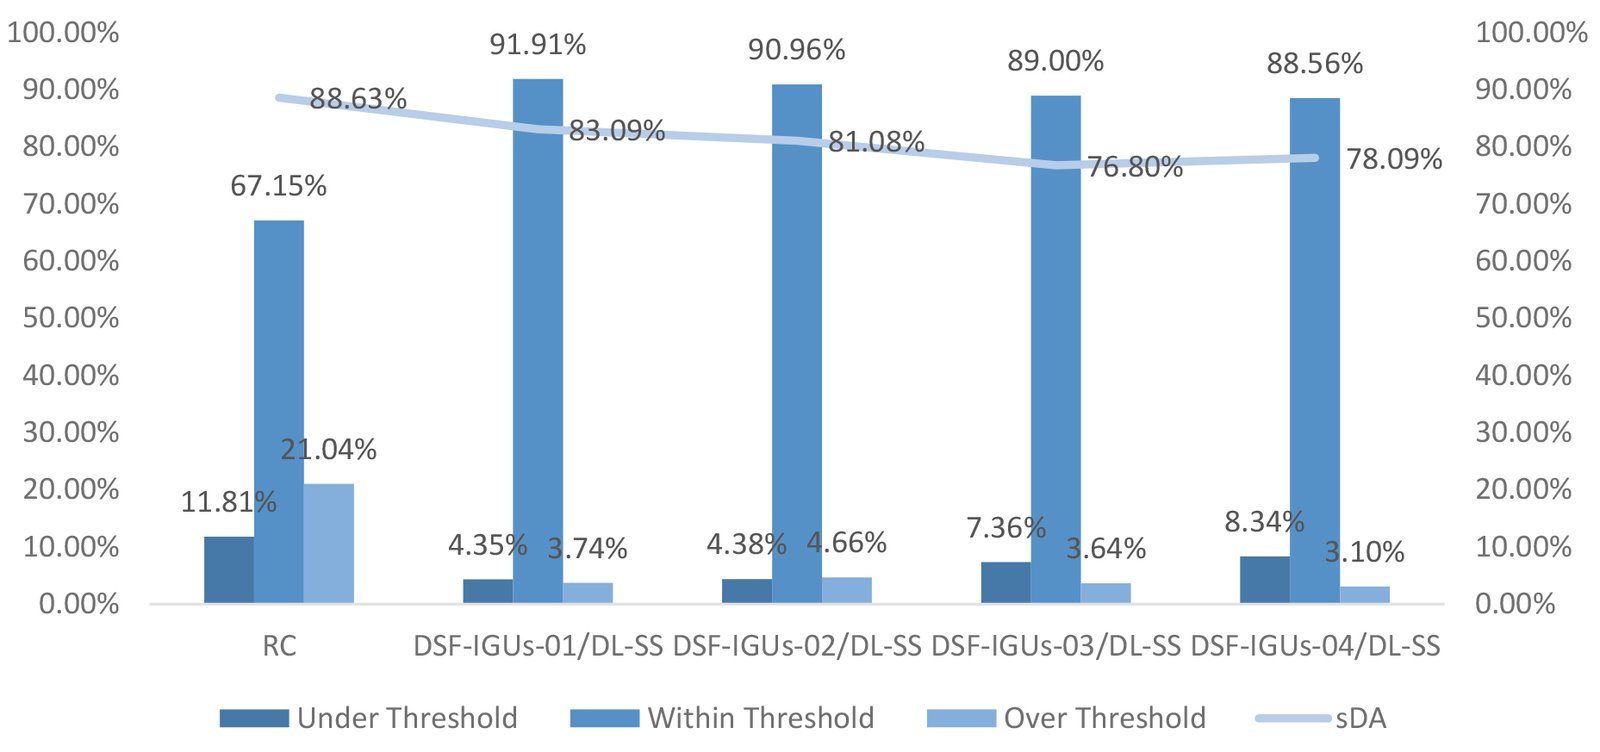 Figure 10
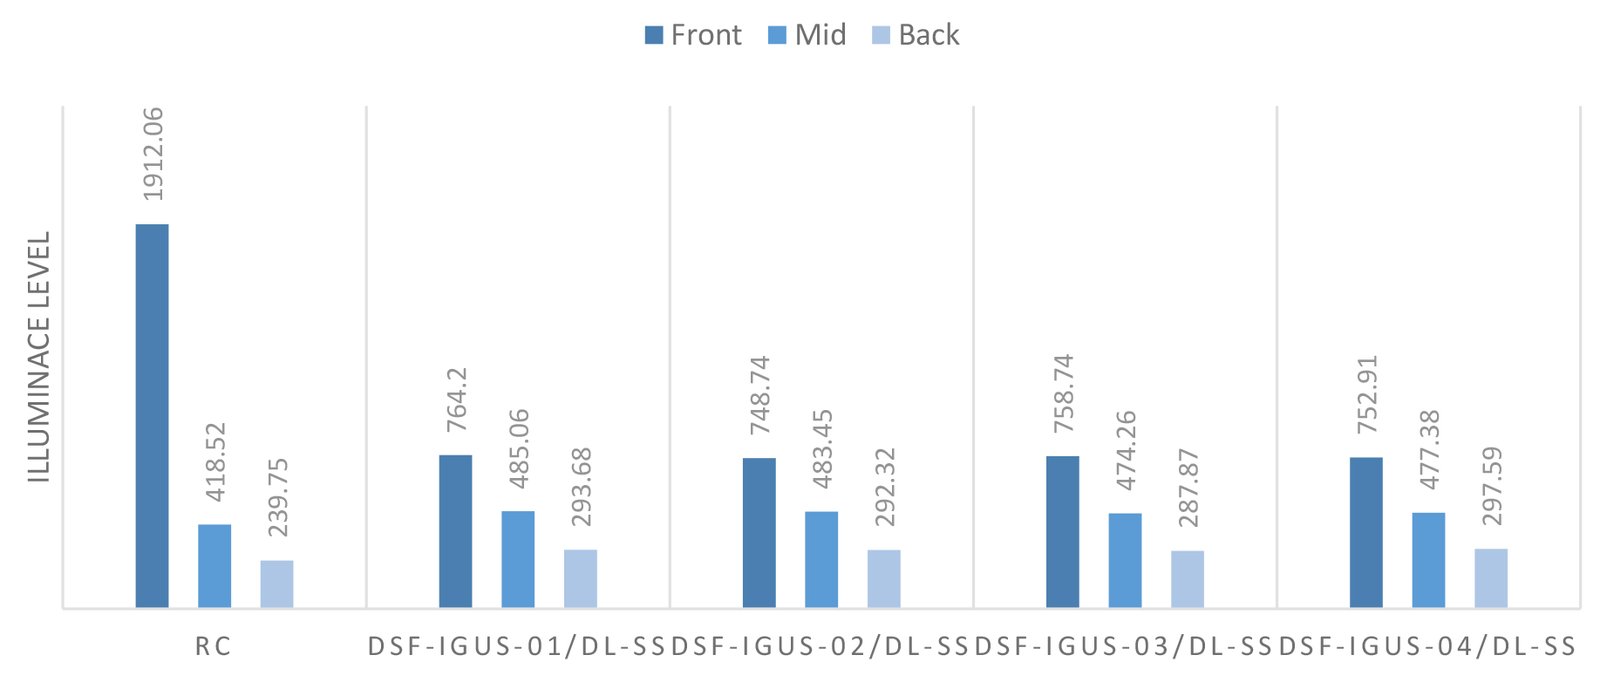 Figure 11
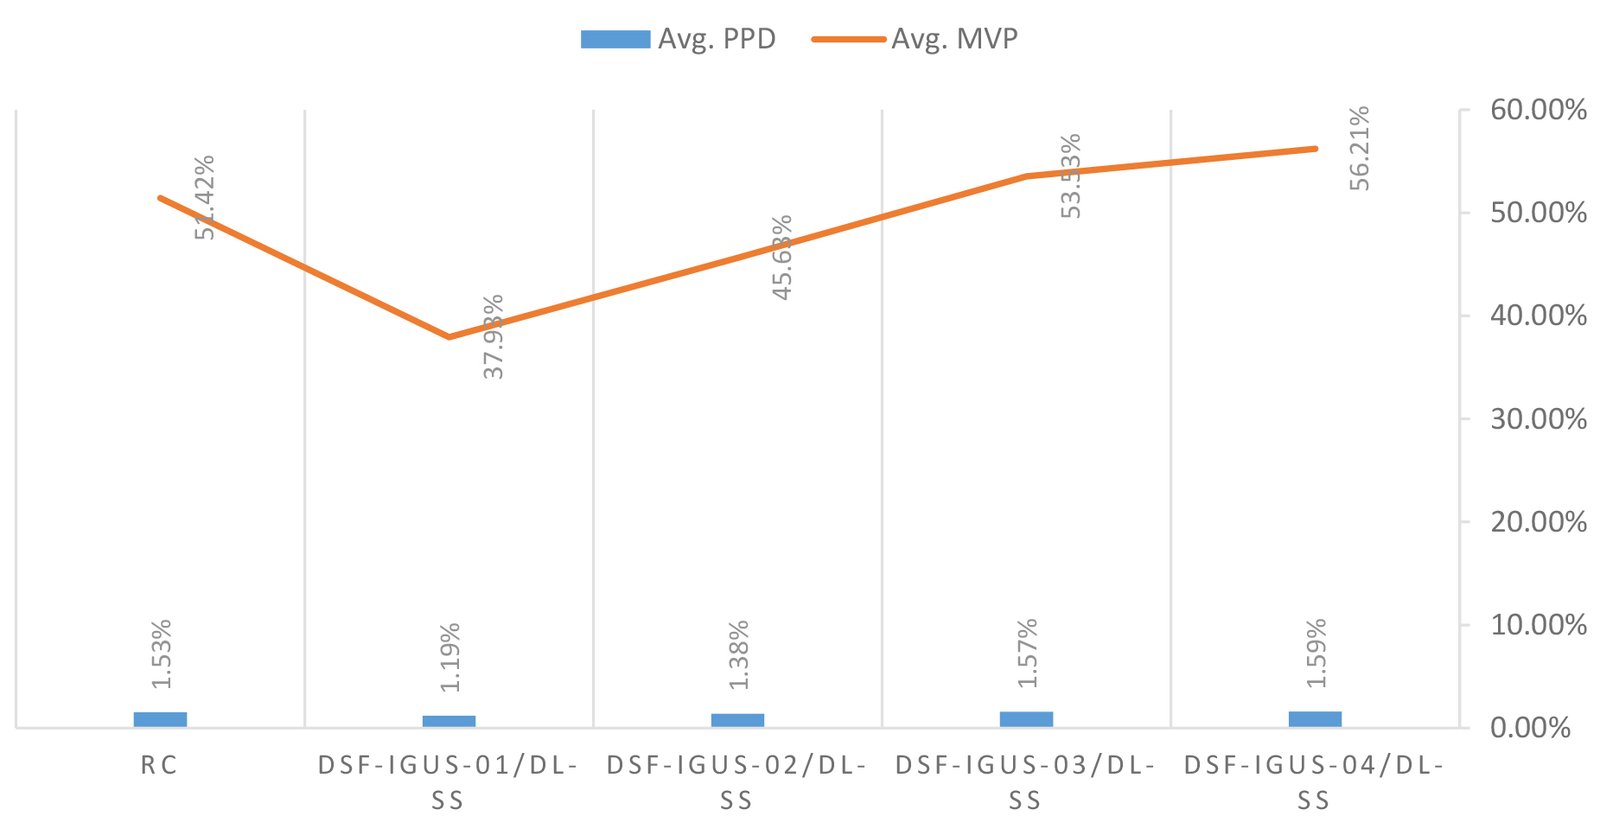 Figure 12
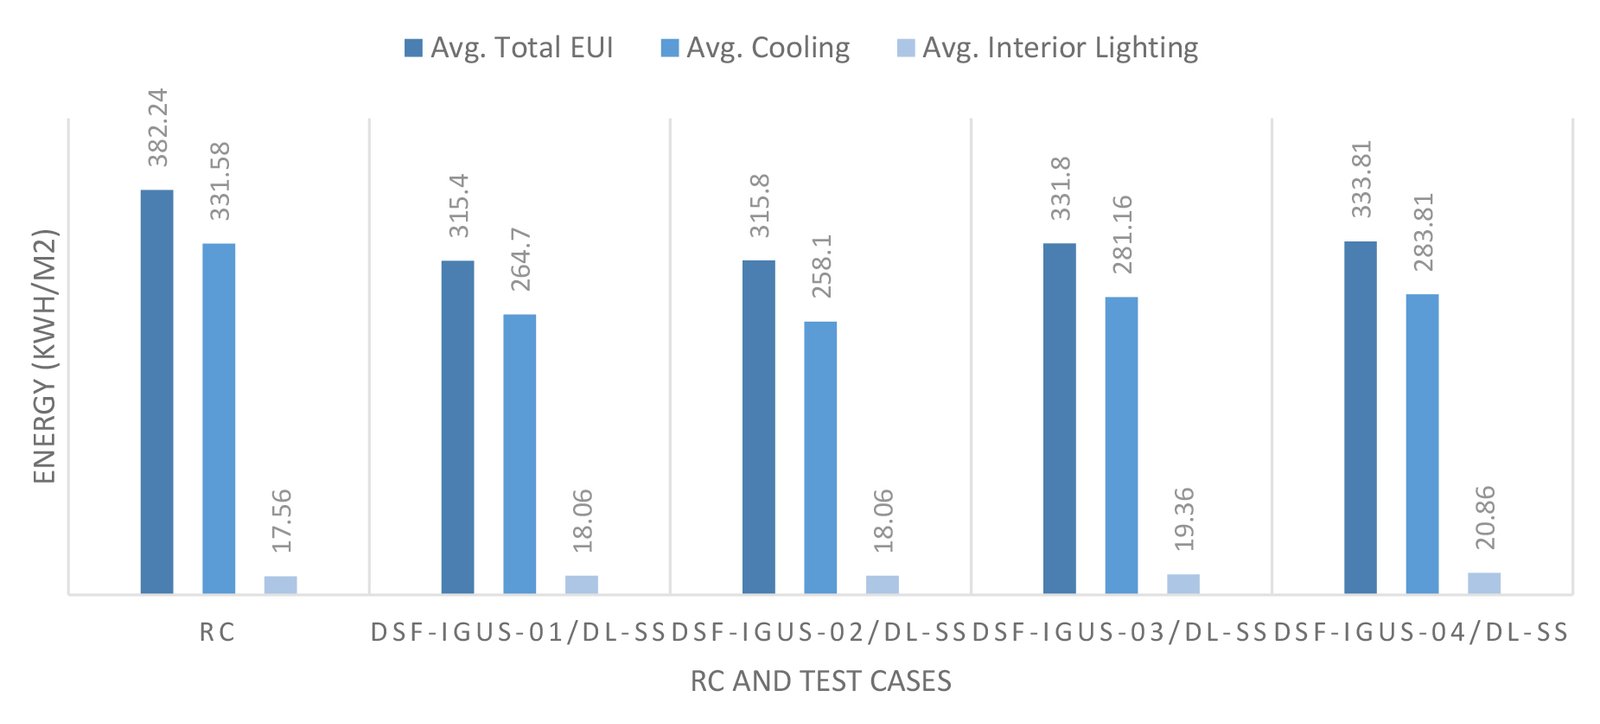 Figure 13
 Figure 14
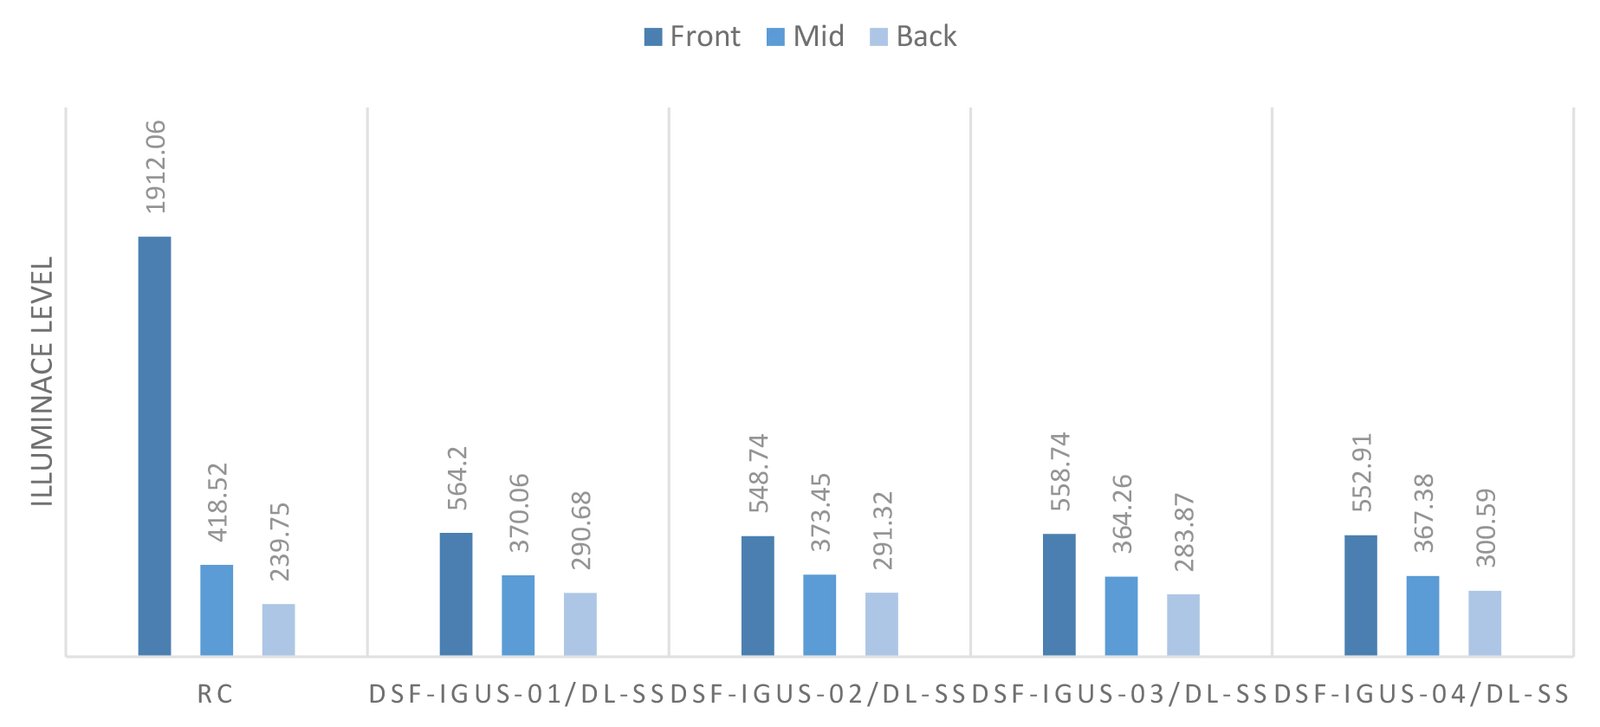 Figure 15
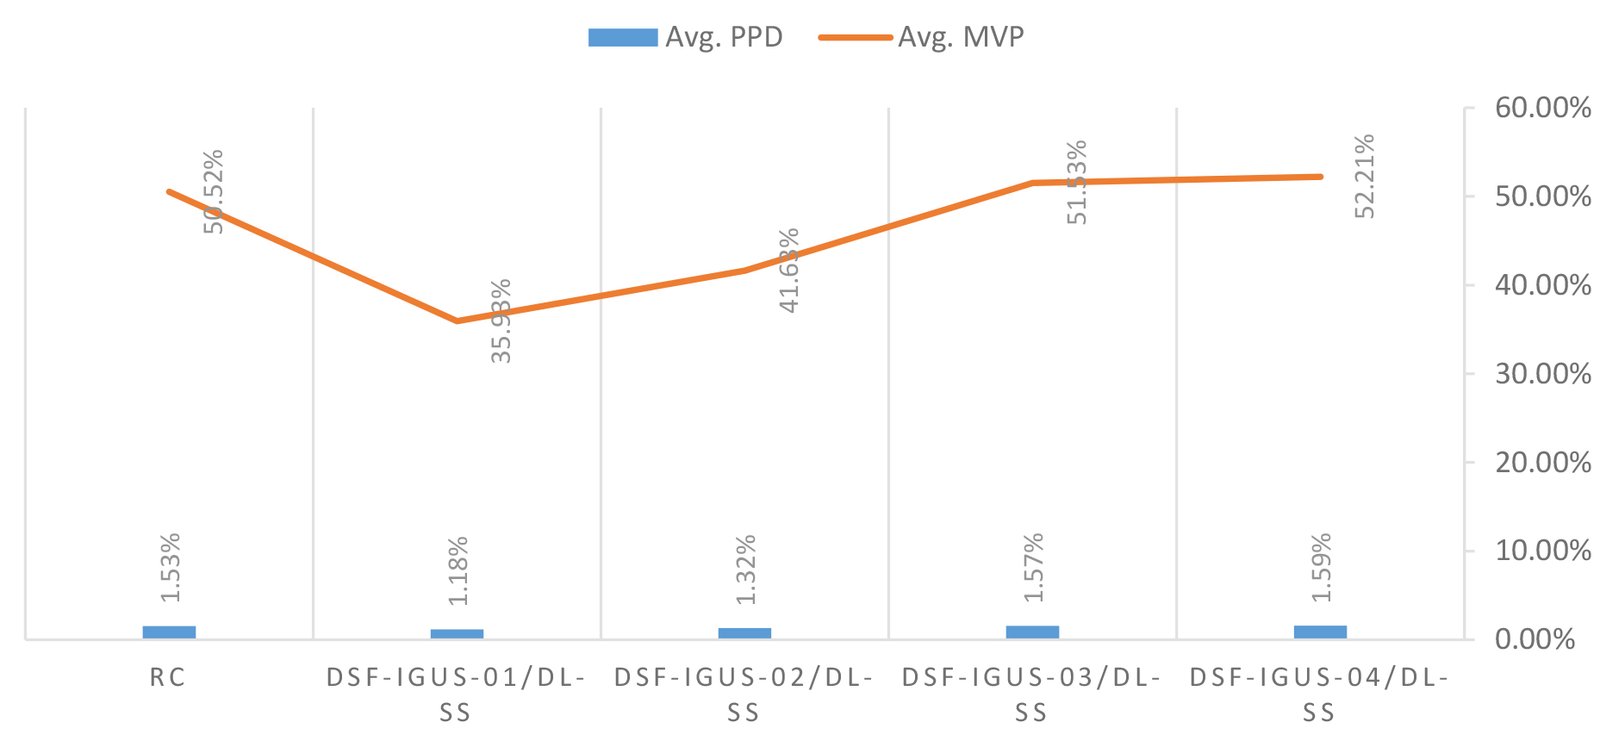 Figure 16
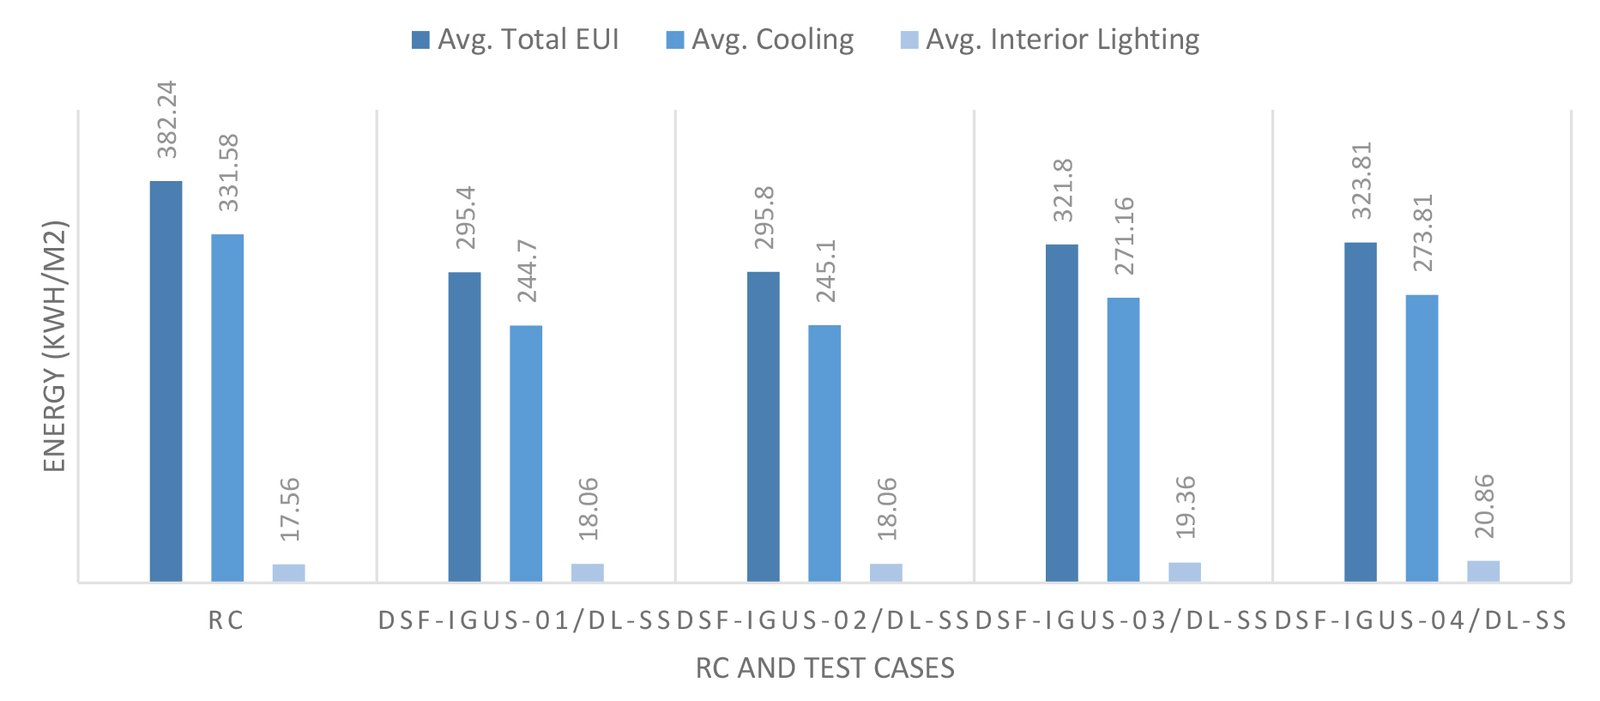 Figure 17
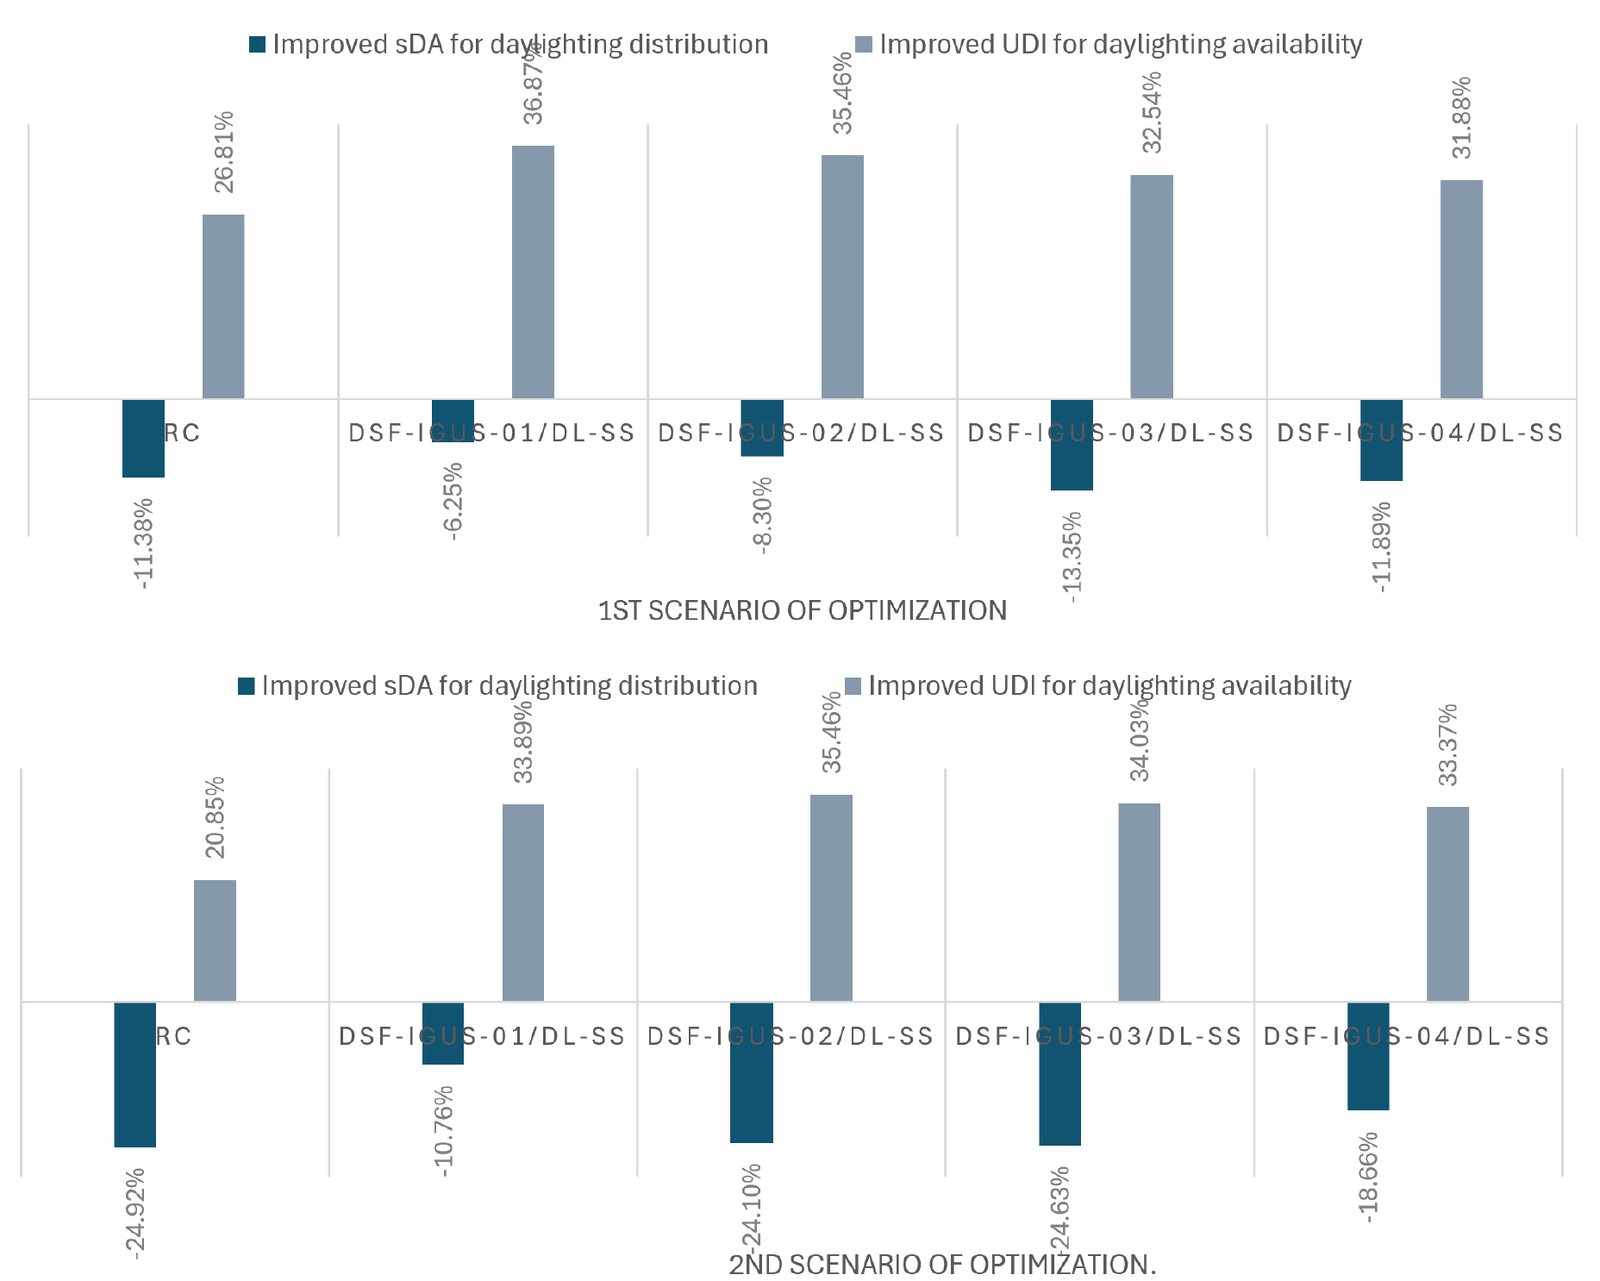 Figure 18
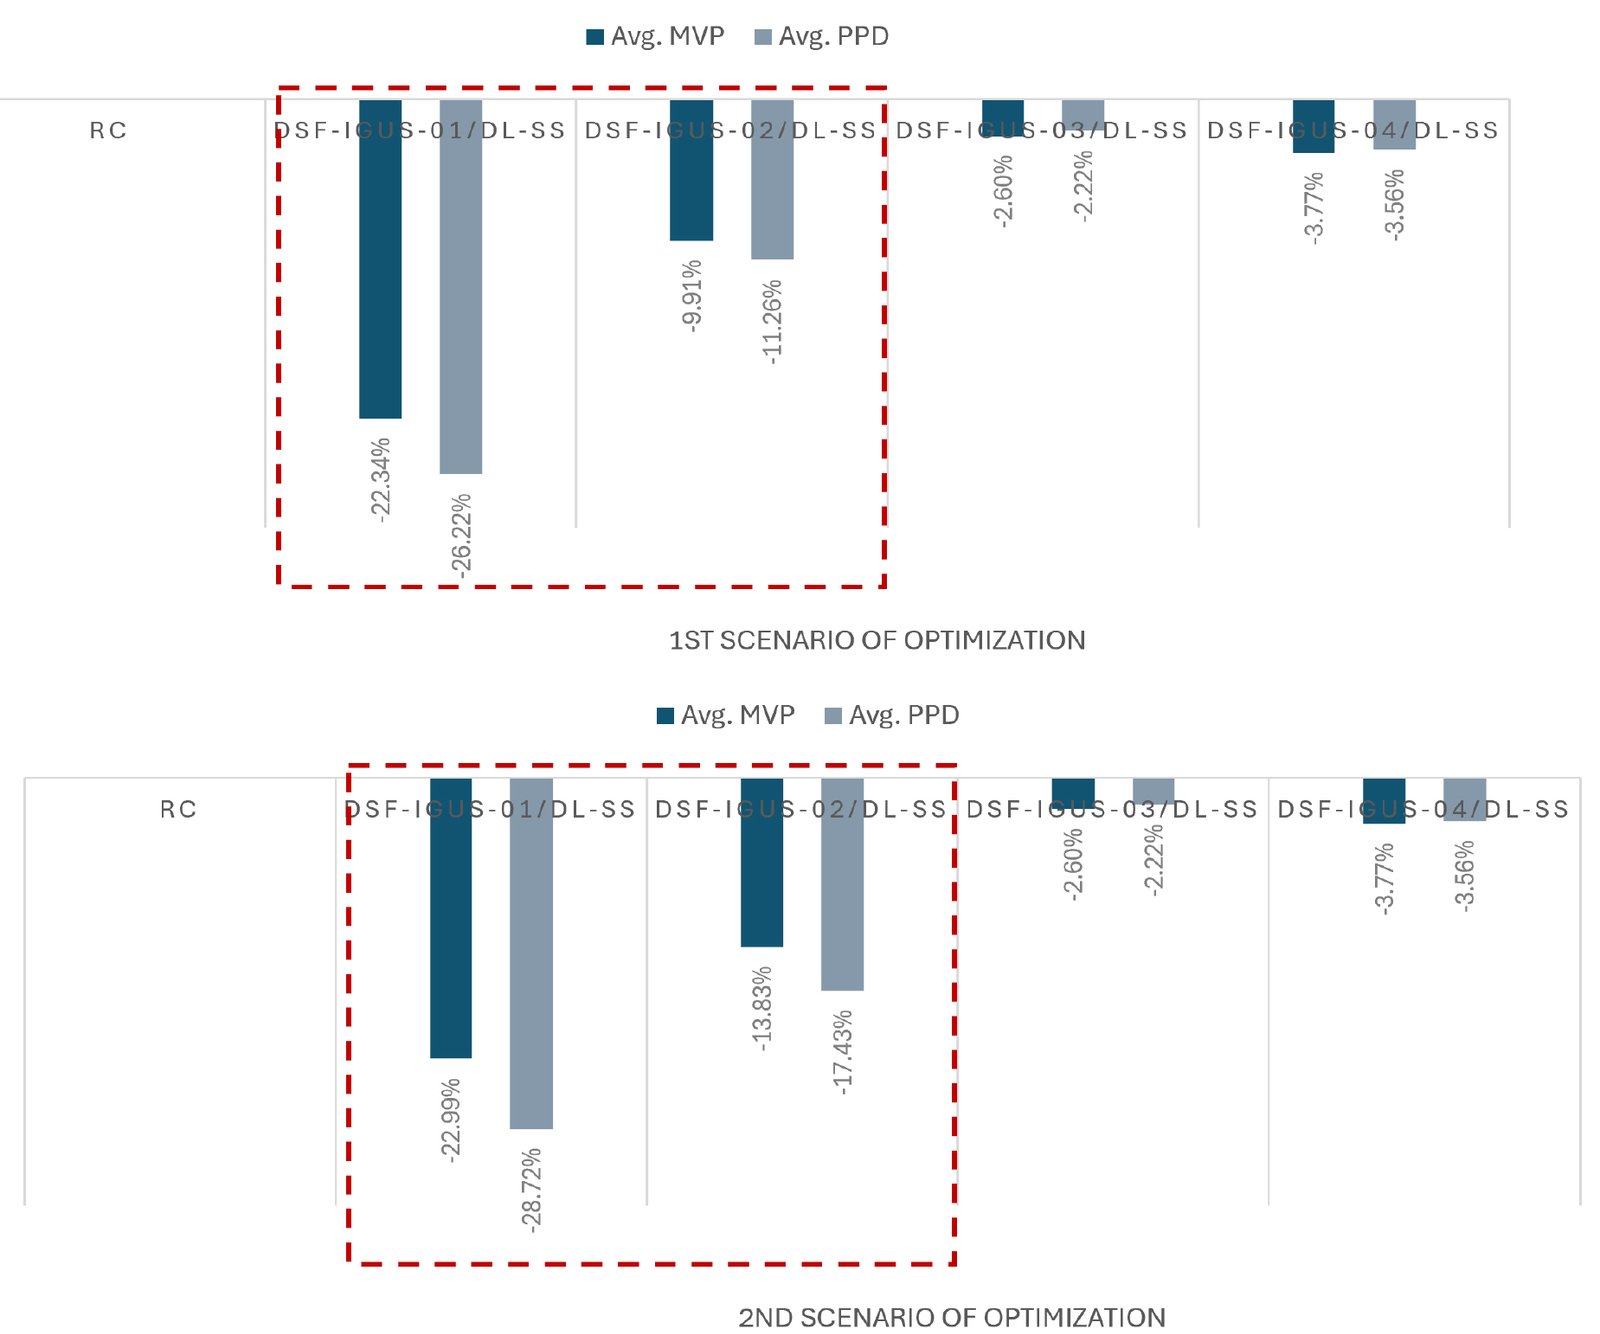 Figure 19
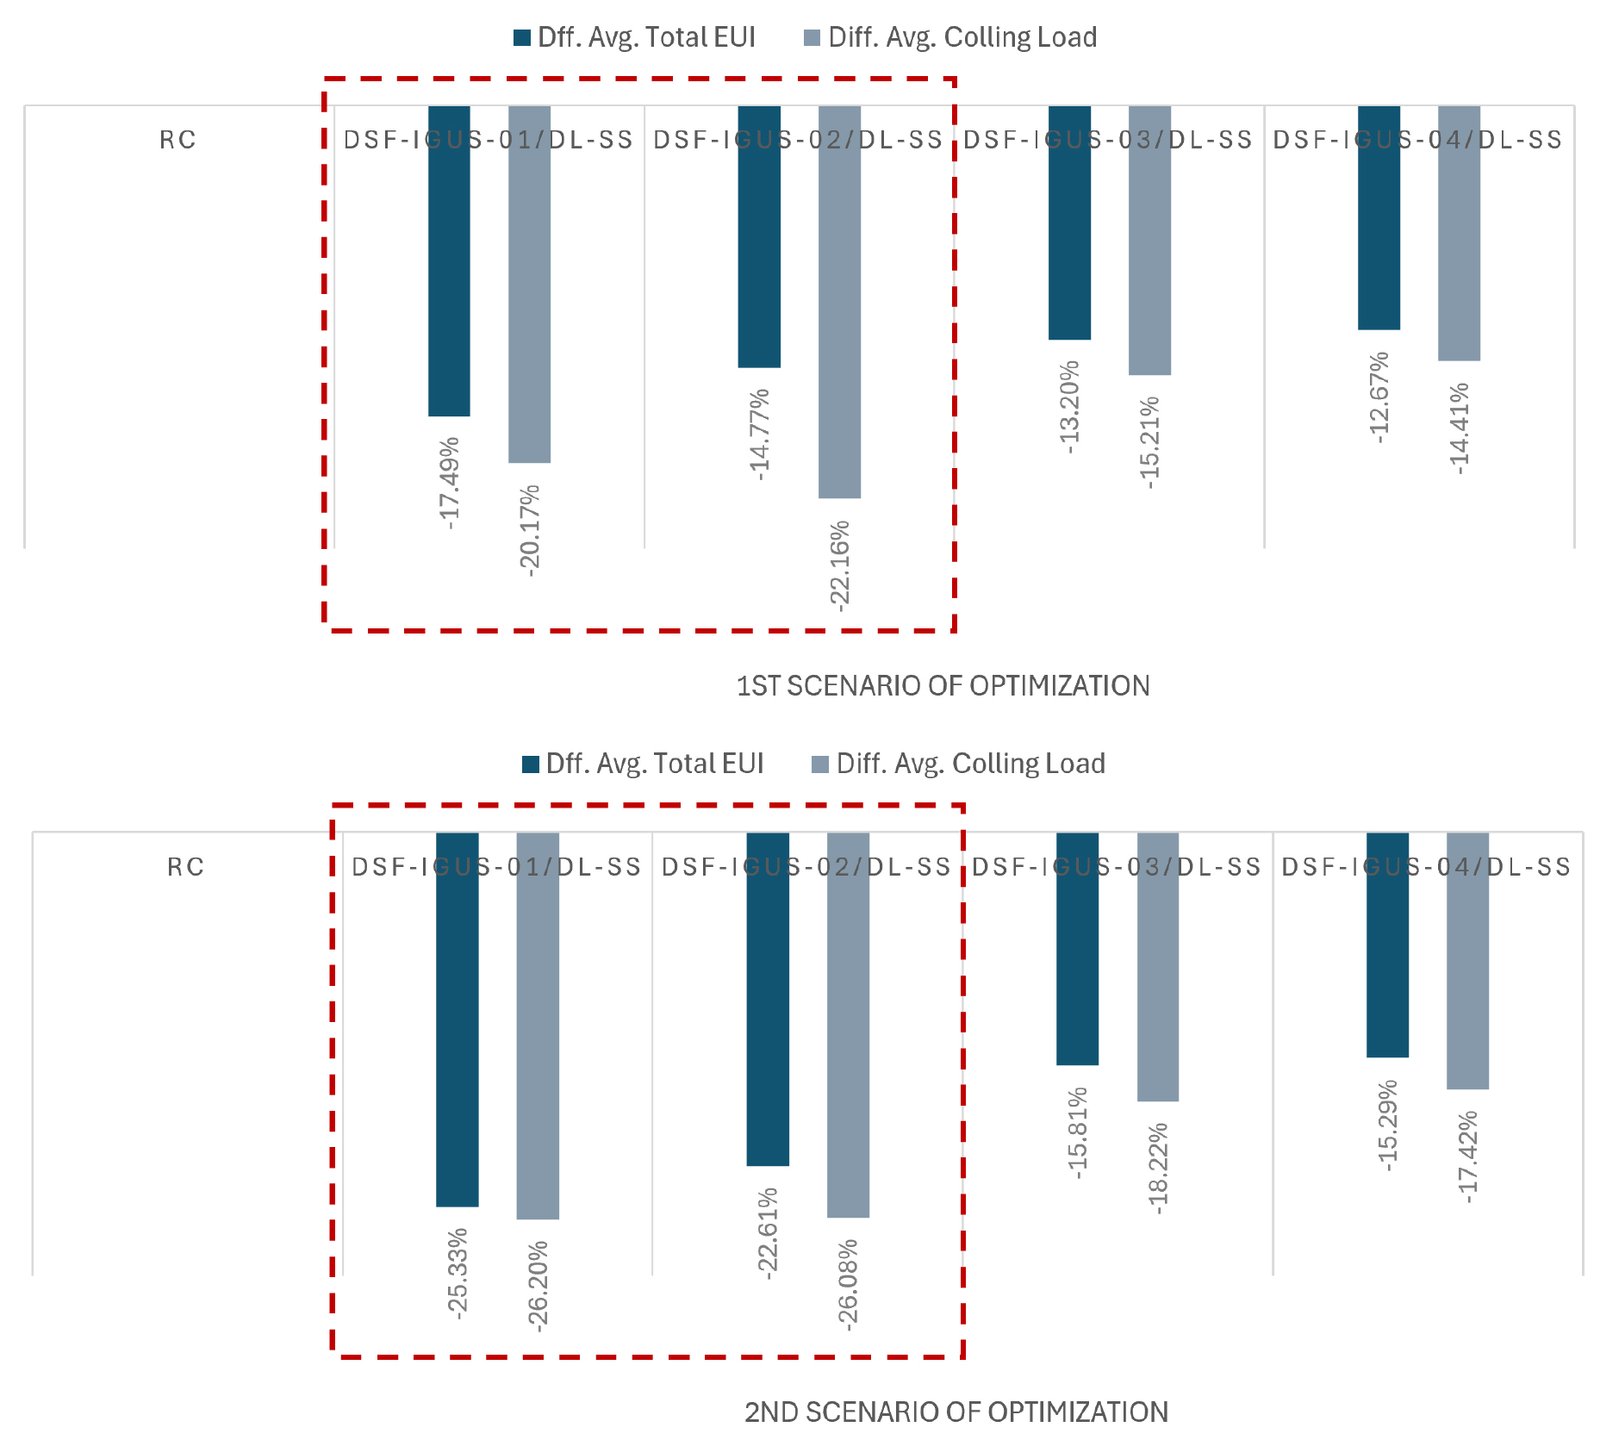 Figure 20
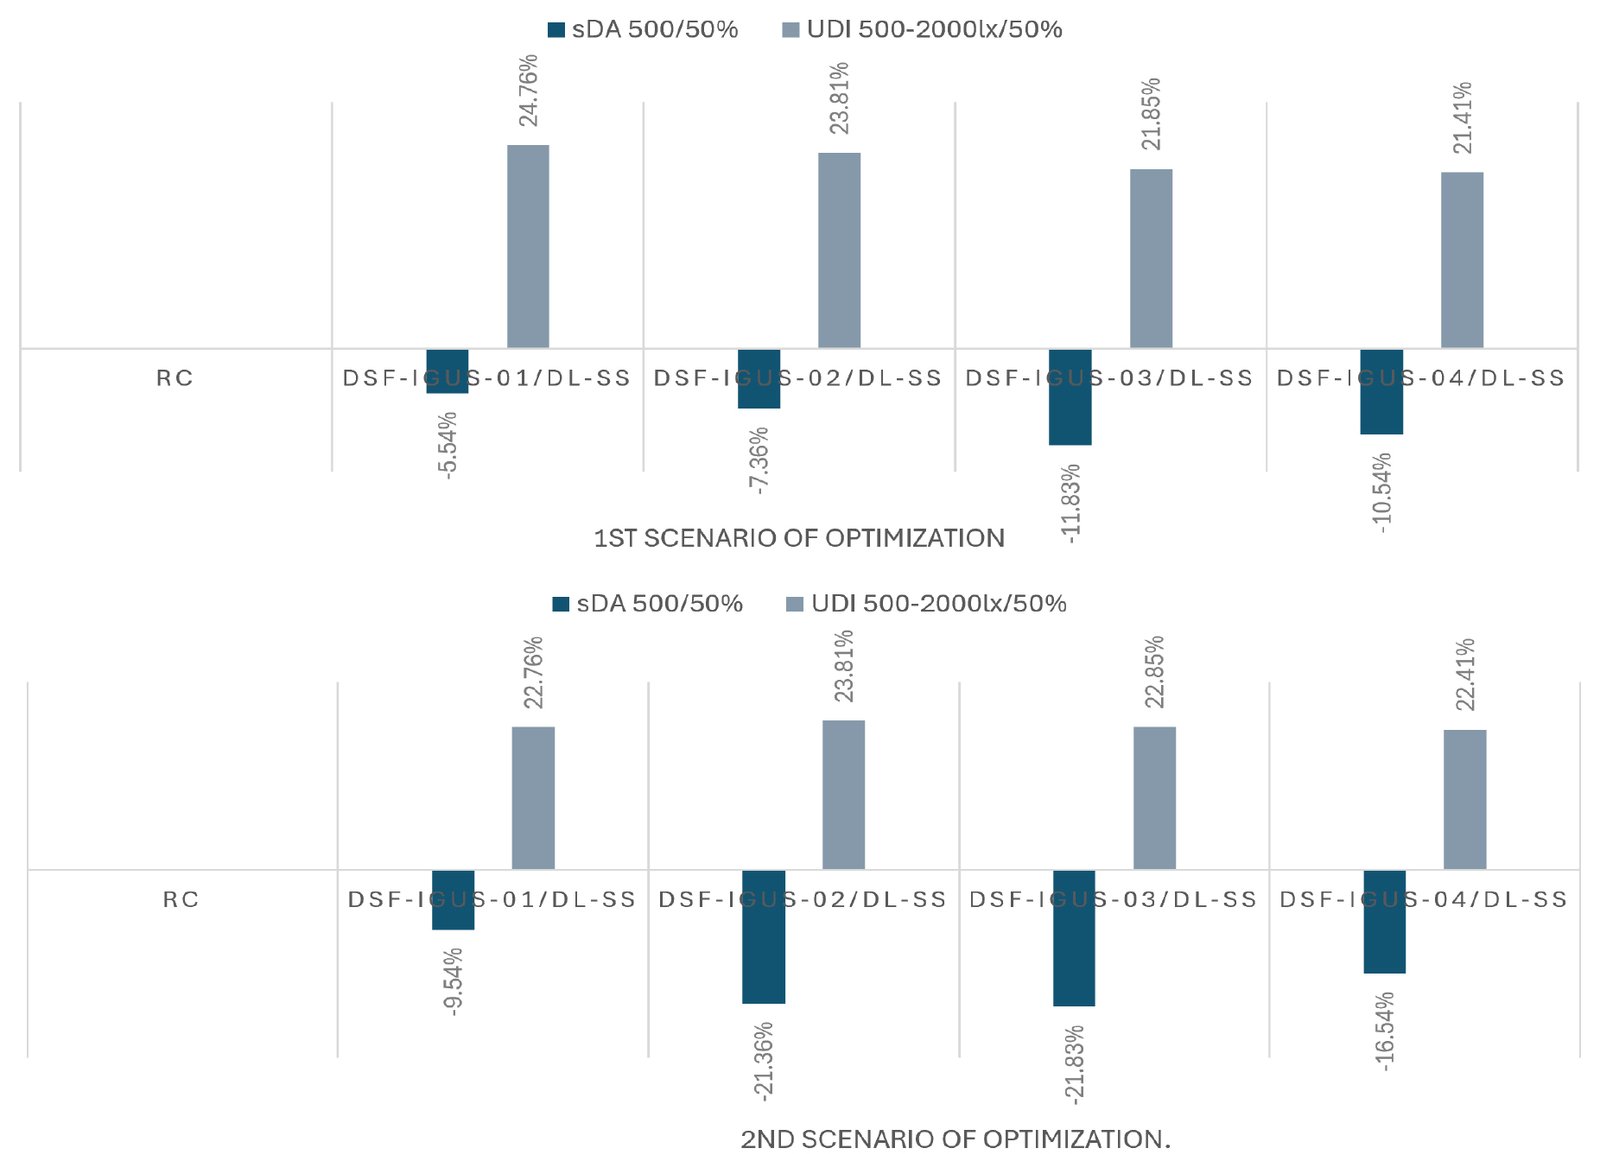 Figure 21
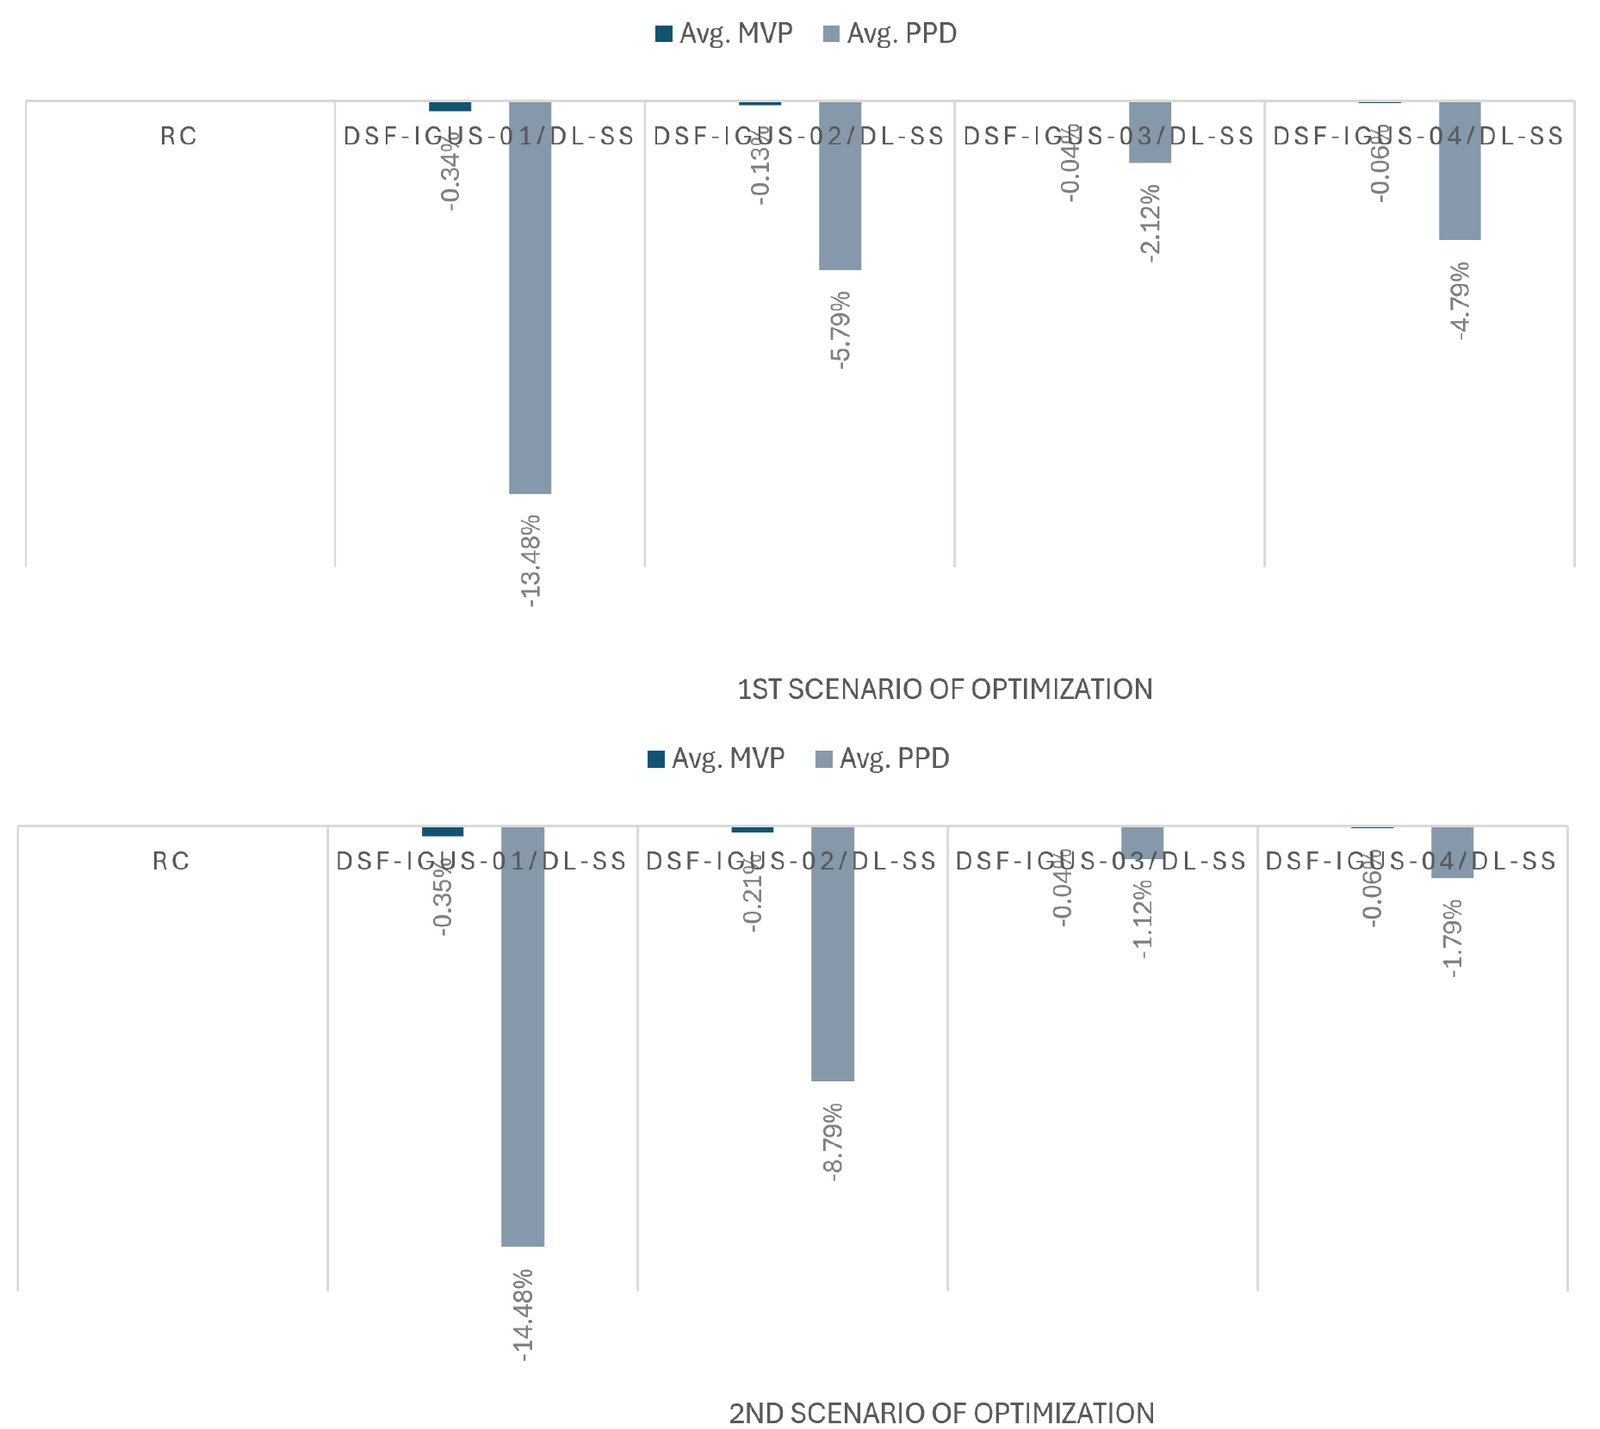 Figure 22
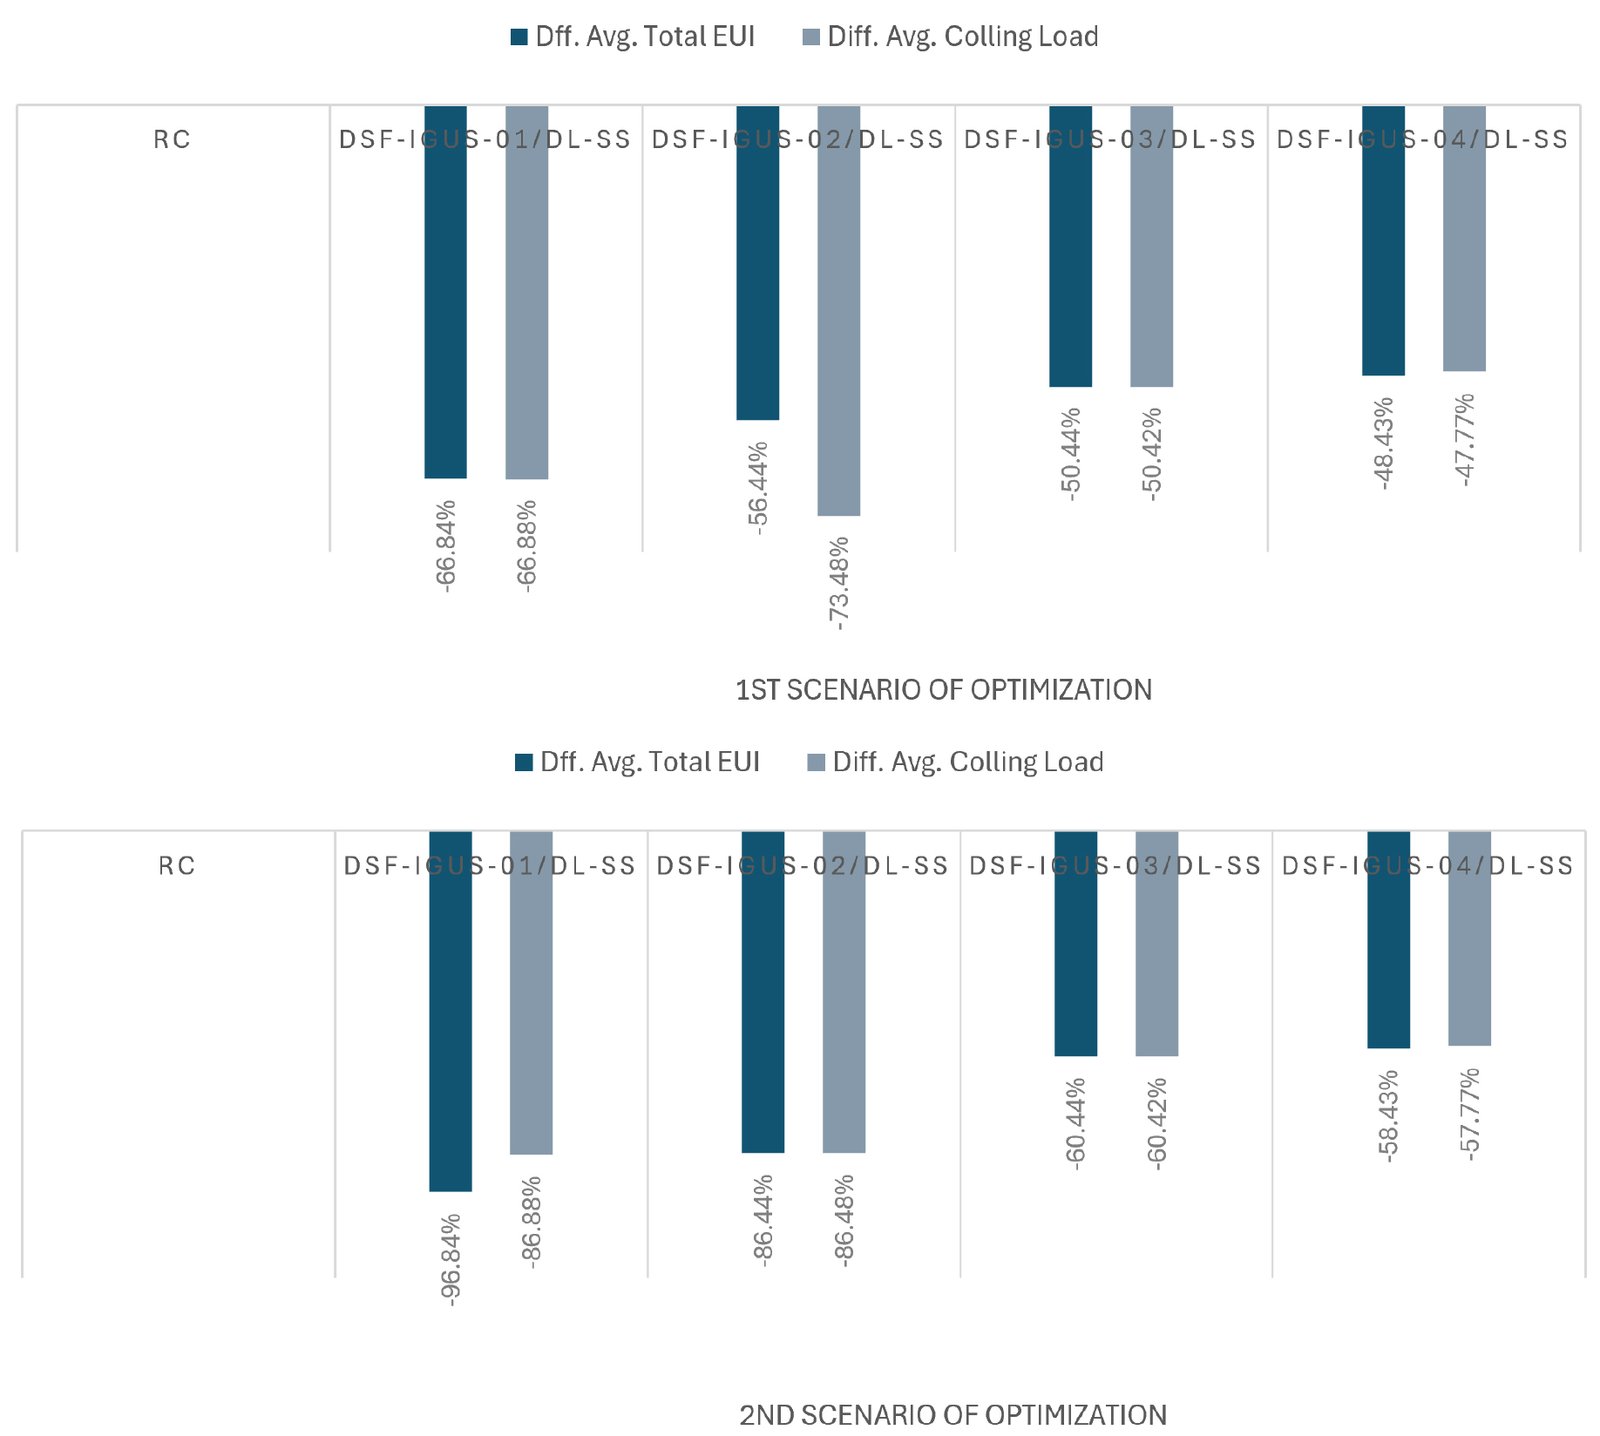 Figure 23
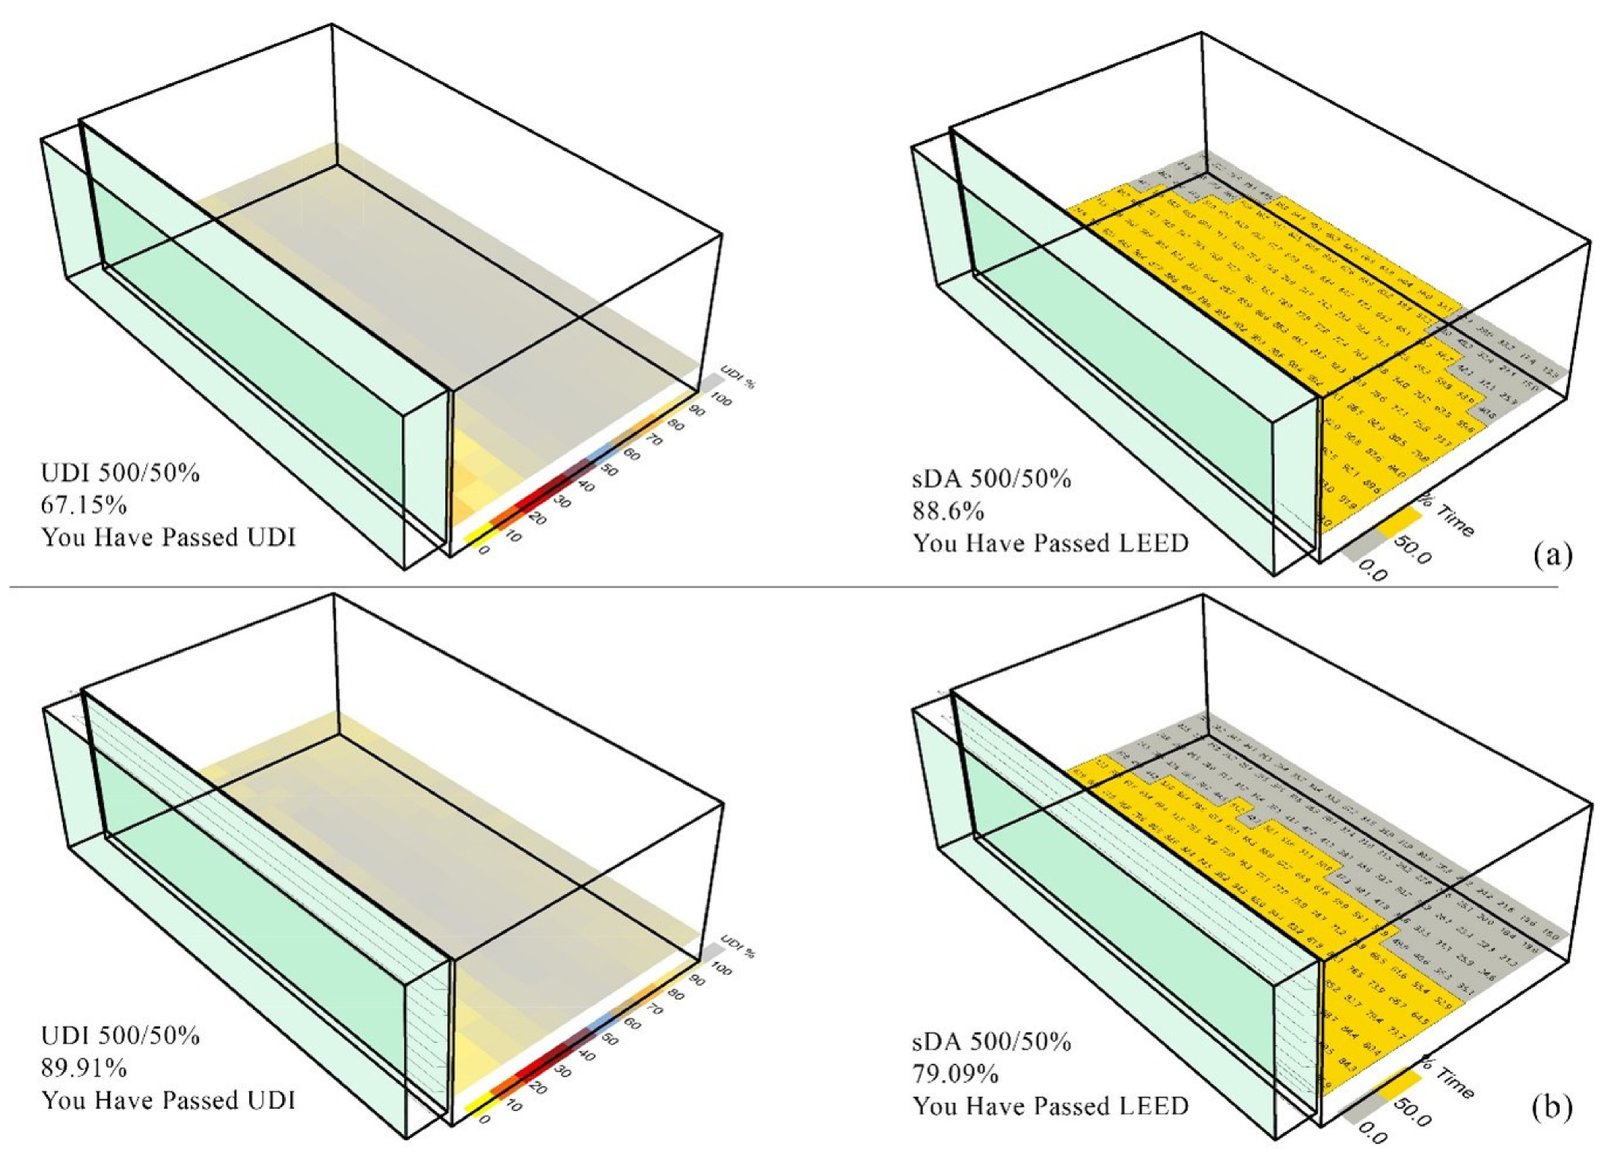 Figure 24
 Table 1
 Table 2
 Table 3
 Table 4
 Table 5
 Table 6
 Table 7
 Table 8


