Volume 12 Issue 2 pp. 306-342 • doi: 10.15627/jd.2025.21
Evaluating Visual and Beyond-Vision Light Effects and Energy Consumption for Luminous and Temporal Light Factors: A Single Office Case
Alyaá Tabbah,* Peter Johansson, Myriam B C Aries
Author affiliations
Department of Construction Engineering and Lighting Science, School of Engineering, Jönköping University, Jönköping, Sweden
*Corresponding author.
alyaa.tabbah@ju.se (A. Tabbah)
peter.johansson@ju.se (P. Johansson)
myriam.aries@ju.se (M. B C Aries)
History: Received 3 February 2025 | Revised 19 March 2025 | Accepted 4 April 2025 | Published online 16 August 2025
2383-8701/© 2025 The Author(s). Published by solarlits.com. This is an open access article distributed under the terms and conditions of the Creative Commons Attribution 4.0 License.
Citation: Alyaá Tabbah, Peter Johansson, Myriam B C Aries, Evaluating Visual and Beyond-Vision Light Effects and Energy Consumption for Luminous and Temporal Light Factors: A Single Office Case, Journal of Daylighting, 12:2 (2025) 306-342. doi: 10.15627/jd.2025.21
Figures and tables
Abstract
Light influences human physiology and psychology through visual and beyond-visual effects, collectively termed ‘integrative lighting.’ Human responses depend on luminous (quantity, spectrum, directionality) and temporal (timing, duration, history) factors, yet no studies examined their combined influence on integrative lighting. Therefore, this study evaluates representative metrics integration by designing, implementing, and testing a comprehensive lighting simulation framework incorporating luminous and temporal factors to address integrative lighting needs while assessing energy consumption. A quantitative approach was employed, integrating multiple criteria through computational simulations using Rhinoceros/Grasshopper, Lark, ClimateStudio, and Ladybug/Honeybee. Simulations are performed in a single office with nine control points, four vertical viewing directions, and one horizontal, each testing eight window sizes and different electric lighting combinations of ceiling panels and wall-washers with varying melanopic-content across four seasonal days. Including beyond-visual effects in multi-criteria optimisation introduces complexity due to the interplay between luminous and temporal aspects. Results show that beyond-visual effects depend on light quantity, spectral composition, and spatial distribution. Increasing window-to-wall ratio or melanopic-content lighting alone does not ensure uniform beyond-visual performance. Instead, directing wall washers at opaque surfaces enhances background luminance, reduces glare, and improves retinal exposure. Beyond-vision criteria are challenging due to temporal dependencies, often requiring window size and lighting energy use trade-offs. These findings highlight the need for lighting designs that optimise light levels, spectrum, and directionality at the right time. Future approaches should use multi-objective optimisation to balance visual and non-visual outcomes, automate adjustments, and enhance well-being while maintaining energy efficiency.
Keywords
visual light effects, beyond-vision light effects, window-to-wall ratio, daylight
1. Introduction
Since humans in the Western world spend most of their time indoors [1], they experience thermal, visual, acoustic, and air quality conditions that, in most cases, are artificially supplied by building services. Additionally, these indoor environmental quality (IEQ) conditions are governed by the building envelope, which increases the chance of creating unnatural indoor conditions that may impact human health, well-being, and overall sustainability. Living in urban environments is associated with decreased exposure to daylight and increased electric light levels, affecting visual and beyond-visual responses to light [2-7]. Although the beyond-visual effects of light are primarily mediated by intrinsically photosensitive retinal ganglion cells (ipRGCs) [8], all five types of photoreceptors in the retina—rods, three types of cones, and the ipRGCs—contribute to visual and beyond-visual responses to light. These five types of photoreceptors are collectively referred to as the α-opic photoreceptors [9-11]. Therefore, it is important to satisfy the requirements regarding all five photoreceptors for the visual or beyond visual light responses, combinedly called integrative lighting [12].
According to many researchers, e.g. [13,14], beyond-vision effects of light include psychophysical and physiological responses, which incorporate acute responses that happen immediately after the light exposure, e.g., alertness [15-17] or melatonin suppression [15,18,19]; circadian responses that happen with a frequency of nearly 24 hours, e.g., mood [17,20,21] or circadian phase shift [22-27]; and long-term responses that happen due to (circadian) disturbances for a prolonged period, e.g., depression [28-30] or seasonal affective disorder (SAD) [31,32]. The visual effects of light include slow and fast eye-brain responses that enable sight, contributing to visual performance, visual experience, and visual comfort (or discomfort, as with glare) [13].
Human responses to light are influenced by luminous and temporal factors [13,33] e.g., luminous factors include the quantity of light, which refers to the light level in radiometric or photometric units [18,21] and light spectrum, which refers to the spectral power distribution (SPD) that governs colour qualities [17,34,35]. The spatial factors include directionality, which refers to the direction of light hitting the retina or gaze-direction and distribution of light in the three-dimensional space [36-38]. The temporal factors relate to the timing and duration of exposure to a light stimulus [20,39], including light history, which refers to the cumulative exposure to light over time [33,40,41].
Luminous and temporal light factors in the built environment could positively and negatively affect visual and beyond-vision effects. For example, an acute response to increased light levels can be used to advance visual performance or to improve alertness and prevent sleepiness, especially during night-shift work or any situation where safety is important [7,15,42-44]. Concerning timing, early evening and nighttime light exposure has been found to result in delaying the circadian clock, i.e. in extending the human biological day, while early to mid-morning light may advance the clock [9,25,45-47]. Poor visual performance or discomfort can cause increased mistakes, while disrupted circadian rhythms can lead to health problems like sleep and metabolic disorders. Consequently, the lit environment can affect mood, cognition, or alertness, impacting productivity, learning, and safety [5,13,15,48]. Chronic exposure to inappropriate lighting conditions, such as insufficient natural light during the day [20,49,50], excessive artificial light at night, or reduced seasonal variation [40,41,51,52], has been associated with an increased risk for non-seasonal depression or seasonal affective disorder (SAD) [31,32,41,51,53].
Near windows, daylight often delivers illuminance levels much higher than minimally required for visual tasks. This enables occupants in well-daylit areas to maintain stronger and more consistent 24-hour light-dark cycles, promoting better circadian entrainment [54] and to experience longer periods of daylight-dominated conditions. Conversely, individuals situated away from windows typically experience lower illuminance at eye level, which can lead to weaker circadian entrainment [2]. Looking toward a bright window produces a more potent light (and glare) stimulus than looking toward a dimly lit interior wall [55,56]. Therefore, providing adequate daylighting is important to accomplish (beyond-) visual performance and comfort. [57].
When evaluating the lighting in the built environment, it is crucial to consider visual and beyond-visual performance in compliance with other building performance aspects like energy efficiency. In Scandinavia, electric lighting accounts for 15-30% of total electricity consumption in office buildings [58]. Large windows can provide sufficient daylight to reduce the need for electric lighting [59], but this is not realistic year-round. In summer, excessive daylight can negatively impact the IEQ and thermal comfort due to increasing solar gains, leading to overheating and increased cooling energy consumption, as well as visual discomfort [60]. In winter, large daylight openings cause larger heat leaks.
To address these complexities, researchers have increasingly applied simulation-based building performance and human well-being evaluation [61-63]. For example, Yu et al. [59] reviewed the thermal-daylighting balance regarding human comfort and building energy with limitations on beyond-vision effects. Faraji et al. [64] included thermal, visual, and acoustic comfort and indoor air quality satisfaction in a multi-criteria decision-making approach, yet beyond-vision effects were not included. A study by Alkhatatbeh et al. [65] minimised energy use and maximised the horizontal (desk-plane) and vertical (corneal or eye-plane) daylighting levels for visual and beyond-visual performance. Additionally, Safranek et al. [66], Abboushi and Safranek [67], and Zeng et al. [68] investigated energy impact on beyond-vision effects optimisation, but factors like thermal comfort and cost were not considered.
Recently, whole-building and coupled-computer simulation tools like ClimateStudio [69] have become accessible for simultaneously evaluating a building design's energy, thermal, and visual aspects. Still, lighting simulations for beyond-vision effects require specialised stand-alone software or plug-ins that can divide the visible spectrum into multiple channels. Spectral simulation tools like Lark v2.0 [70] and ALFA [71] are specialised in modelling effects beyond human vision. A recent review by Gkaintatzi-Masouti et al. [63] regarding spectral lighting simulation tools for beyond-vision effects of light found that nearly half of the reviewed studies focused solely on integrative visual and beyond-vision light effects. However, none of the studies investigated the combined influence of all luminous and temporal light factors on beyond-vision outcomes.
Therefore, the study aims to evaluate representative metrics integration by designing, implementing, and testing a comprehensive lighting simulation framework incorporating luminous (quantity, spectrum, directionality) and temporal (timing, duration, history) factors to meet visual and beyond-visual human lighting demands.
The study builds partially upon earlier work by Ochoa et al. [72], using computational modelling to examine a single occupancy office room with variable window sizes and electrical lighting combination and stressing how the solution space is affected by different evaluation criteria. Introducing beyond-vision effects and their luminous and temporal factors to the model increases the complexity of evaluation. This study does not include factors like life cycle costs, thermal comfort, and energy demand for ventilation, heating, and cooling systems, as they require an even more comprehensive multi-objective optimisation approach. Future studies can expand the current study's findings with broader building performance criteria for a more comprehensive evaluation.
2. Method
This study employed a quantitative evaluation approach, using graphical representations to incorporate multiple criteria and design factors. Computational simulation tools, Rhinoceros/ Grasshopper, Lark v2.0, ClimateStudio, Ladybug, and Honeybee, were utilised to investigate the balance between daylight and electric lighting. The study carefully assessed the performance of different window sizes and electrical lighting combinations for an office environment, aiming to minimise electric lighting energy consumption while enhancing visual and beyond-vision performance and comfort across different seasons and viewing directions.
2.1 Model settings and data collection
2.1.1. Building
An existing single-occupancy office room (2.9 x 3.5 x 3.3 m) on the first floor at Jönköping University, in southern Sweden (57°46′N 14°09′E), served as the model for this study. The single-occupancy office was modelled using architectural drawings to determine space layout and geometries. The office room features a single external wall facing northeast (54° from North) and is largely surrounded by adjacent buildings (Fig. 1(a)-(c)). Nine sensor points, P1 – P9, were evaluated within the room, each with four viewing directions: vertically facing the facade, left wall, rear, right wall, and placed 1.2 m above the floor at eye-sight level and one placed horizontally at 0.75 m. The external wall accommodated a single window opening placed at its centre to provide a view outside. Since this study focused on evaluation criteria, all window sizes had triple-glazing as the original without any shading device or inner frame. The tested openings had only a one-pane frame, and the WWRs varied from 30 % to 100 % in 10% discrete steps (Fig. 2). Extending the window to floor level (below the measurement point) aligns with fully glazed office facades that enhance daylight penetration, visual comfort, and aesthetics. It also improves light distribution, reduces energy use, supports circadian stimulation, and provides more open, connected views to the outside [73-76].
Figure 1
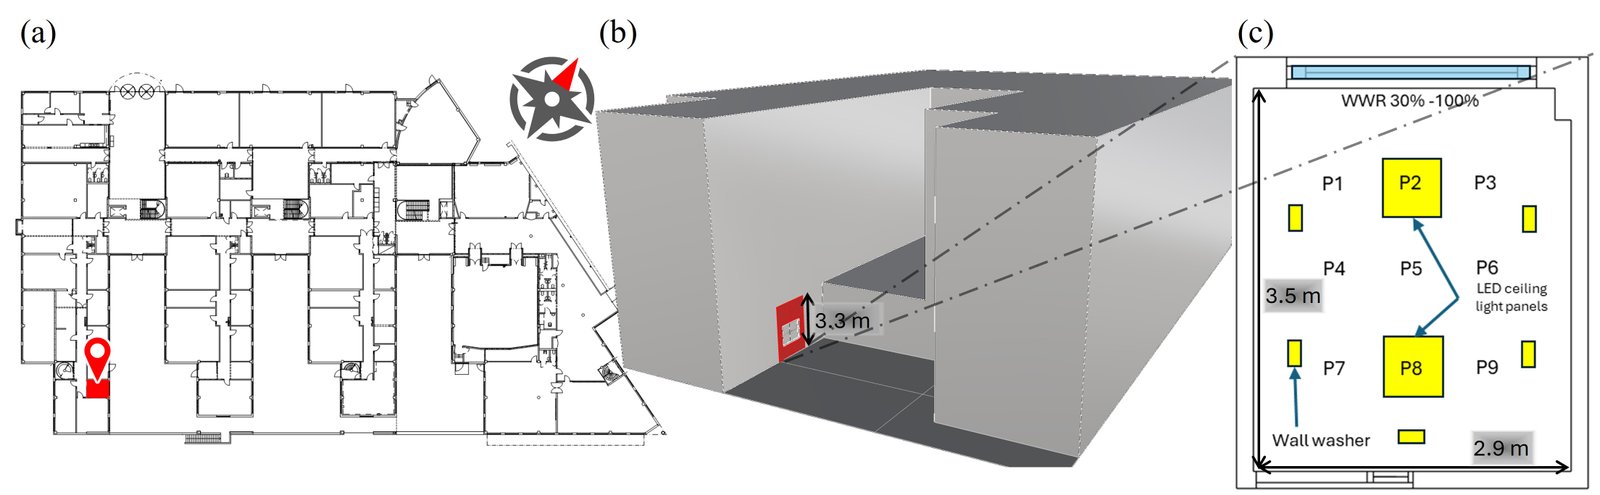
Fig. 1. (a) A map with true north showing (b) the single office room in the context of its surroundings at Jönköping University and (c) a close-up of the room showing the location of sensor points P1- P9 with respect to openings and placement of the electric light sources.
Figure 2
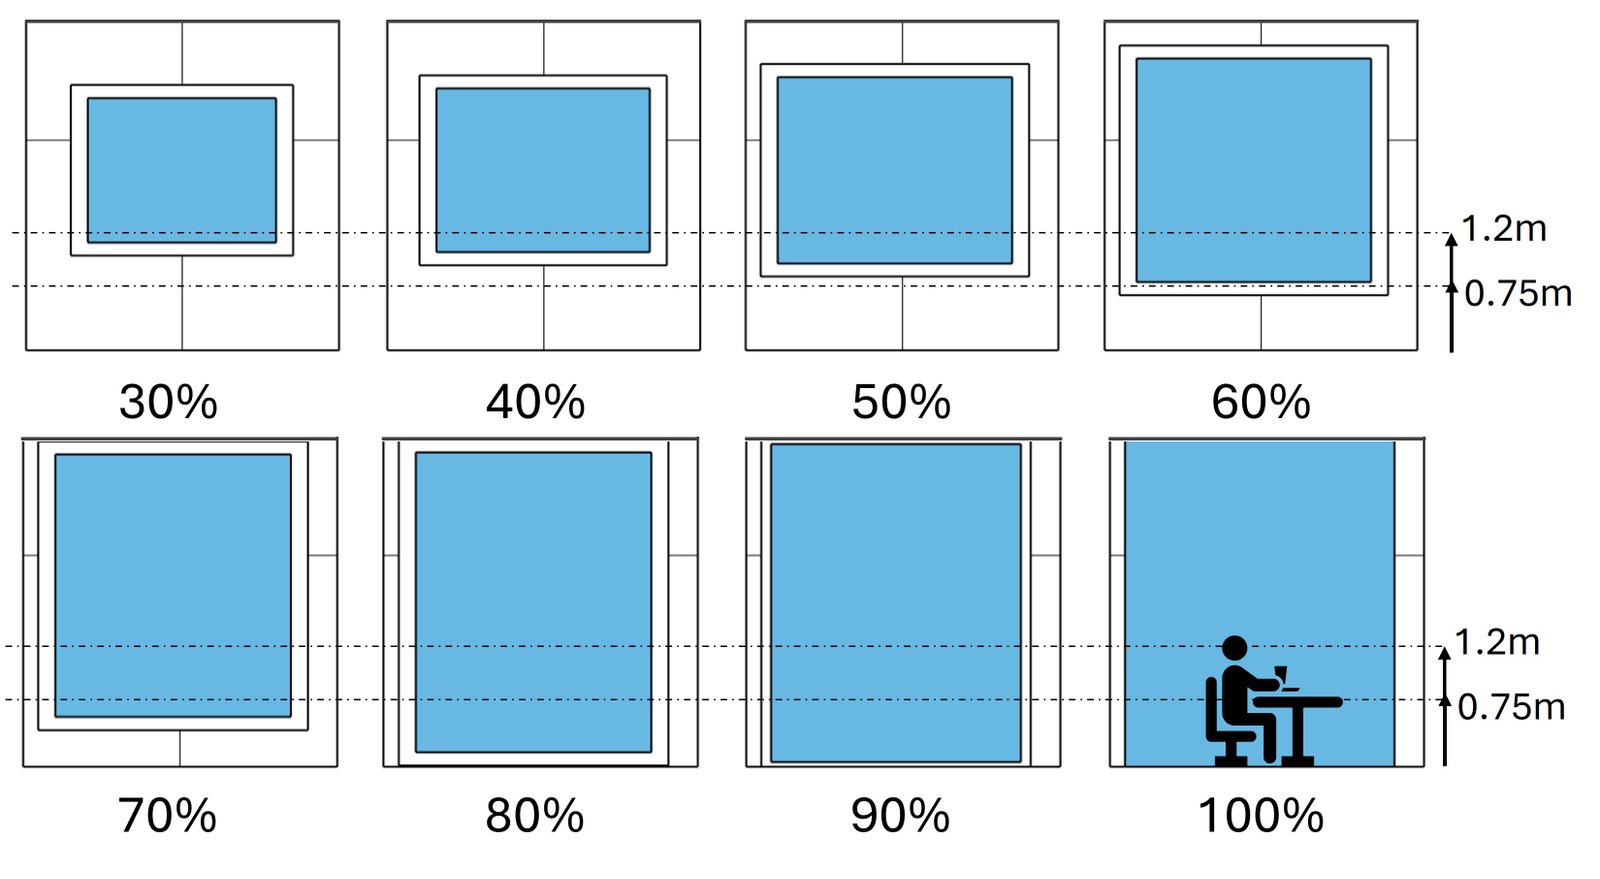
Fig. 2. The eight tested window-to-wall ratios (WWR) and their placement with a horizontal line at eye-sight level (1.2 m) with an outer frame only.
2.1.2. Weather and sky
Simulations were run for the spring equinox (March 21), summer solstice (June 21), autumn equinox (September 21), and winter solstice (December 21) and utilised Jönköping's EnergyPlus Weather (EPW) file for a Dfb climate. The sky type for the four seasonal days - overcast, intermediate, and clear sky - was determined using the ‘Sky Diffuse Model’ developed by Perez et al. [77]. This model provides sky clearness bins as values ranging from 1 (totally overcast sky) to 8 (clear sky). To incorporate spectral power distribution (SPD) into the sky, a correlated colour temperature (CCT) was selected for each sky type (overcast 6500 K and clear sky 25000 K, Fig. 3) to define the colour information as suggested by Inanici et al. [78]. Daylight spectral data were generated from CCT measurements using the Excel Daylight Series Calculator [79], assuming the sun's colour to be neutral white (Appendix A). The resulting sky types were clear sky in summer and overcast in autumn, winter and spring. An intermediate sky type was not applied.
Figure 3
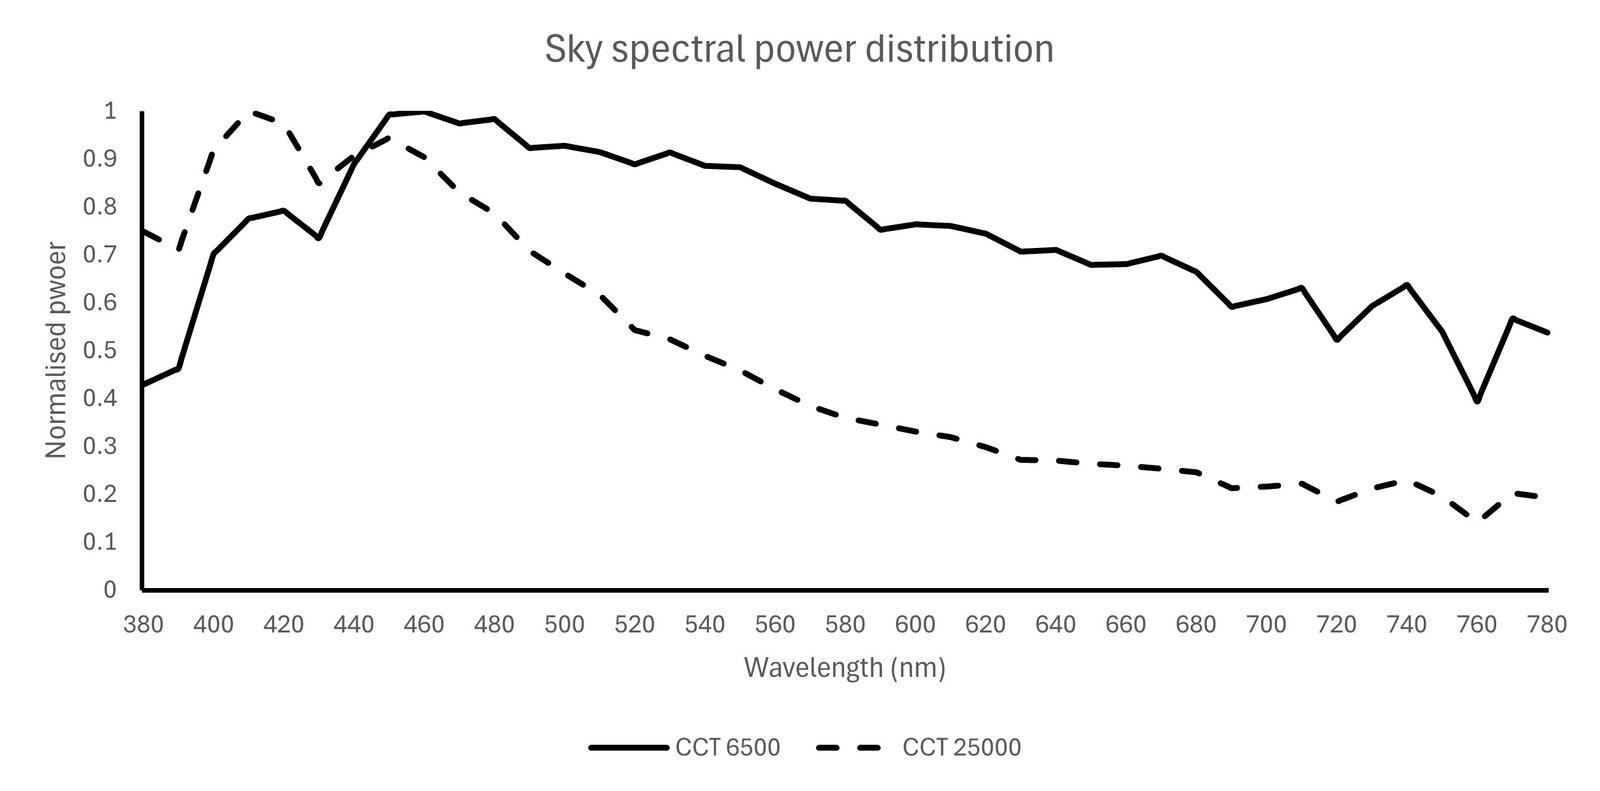
Fig. 3. Sky spectral power distribution for overcast (CCT 6500K) in summer and clear sky (CCT 25000K) in spring, autumn, and winter.
2.1.3. Material
The photopic reflectance (Rvis) of opaque surfaces in the room was measured from 23 sampling points with a luminance/illuminance photometer (Hagner, universal photometer model S3) under electric lighting conditions. The device provides luminance and illuminance measurements with an accuracy better than ± 3% for common light sources and daylight and was last calibrated in February 2022. Surface colours were estimated using the natural colour system (NCS) colour palette and converted to red-green-blue (RGB) colour space under daylight conditions to reflect a full-colour spectrum. Spectral reflectance distribution (SRD), material roughness, and specularity were obtained using the surface colour information and reflectance in a spectral materials database by matching to the closest material [80]. Appendix B shows in detail how the material properties were measured, calculated and matched to the spectral material database.
Due to its age, data from the window system could not be obtained via the manufacturer; hence, the glazing’s photopic transmittance (Tvis) and spectral transmittance distribution (STD) were estimated by measuring the SPD using a spectrometer (UPRtek MK350S_Premium) in a black box. The spectral measurements have a wavelength precision of ± 1 nm and a bandwidth resolution of approximately 9 nm, and the device was last calibrated in March 2023. First, the SPD was measured from a light source without the window, and then the window was placed in between the light source and the spectrometer. Another measurement was done to calculate how much light is transmitted through the glazing at each wavelength by dividing the first SPD measurement by the second. See Table 1 for opaque material properties, Table 2 for glazing, and Fig. 4 for SRD and STD.
Figure 4
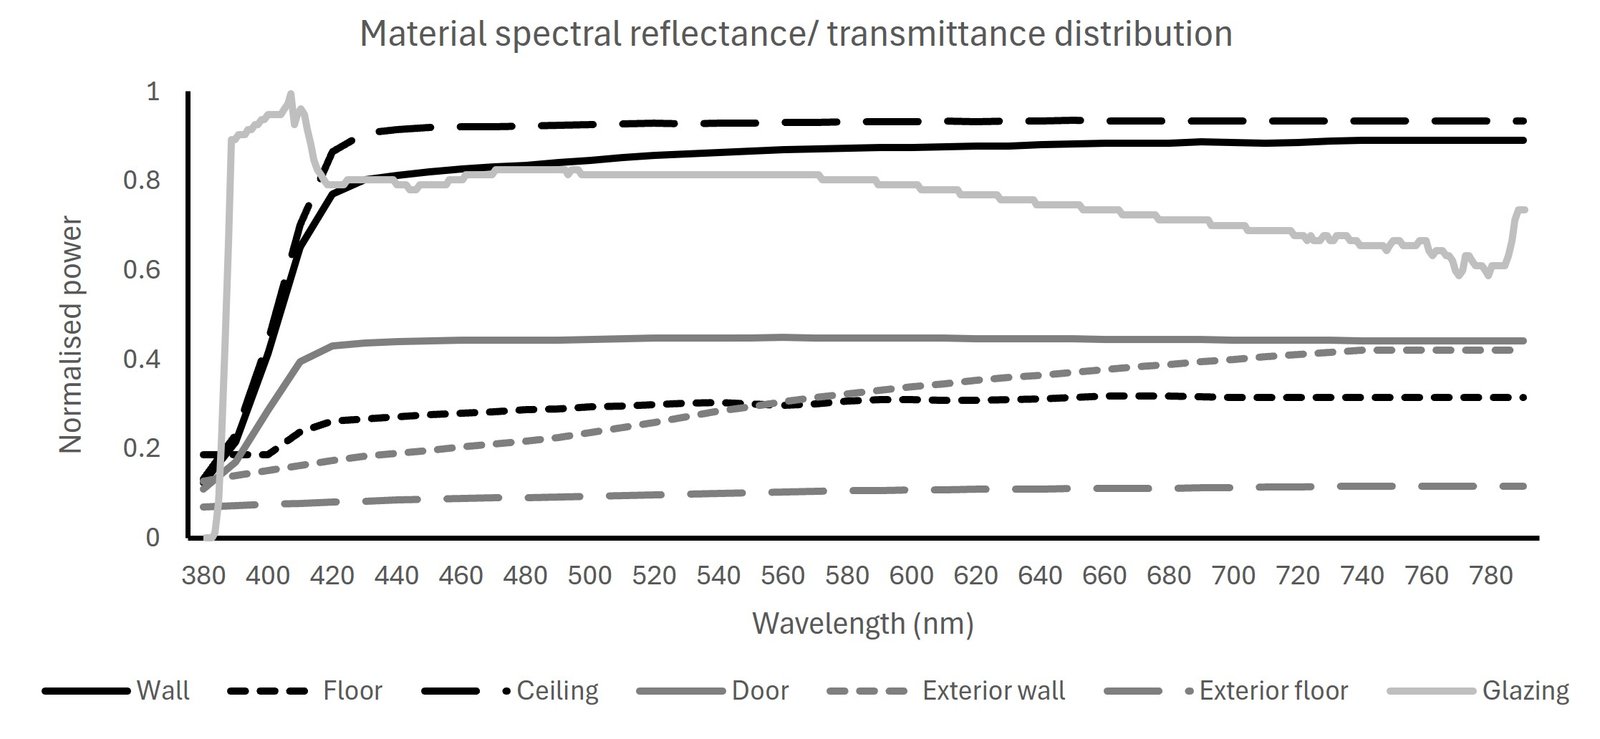
Fig. 4. The opaque materials' spectral reflectance distribution and the glazing material's spectral transmittance distribution.
Table 1
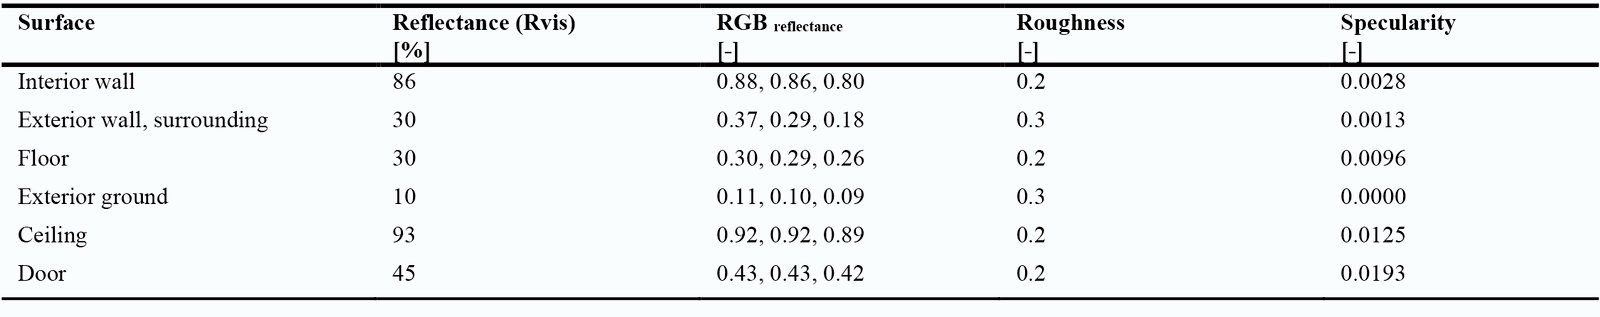
Table 1. Opaque material properties.
Table 2

Table 2. Glazing material properties.
2.1.4. Luminaire
The electric lighting was provided via two 32 W ceiling-mounted tuneable LED panels (Fagerhult type Multilume Flat Delta, mDER 0.45, 3000 K, 4394 lm) for the four seasonal days simulation. The total energy consumption for both light sources is 576 Wh/m2 when turned 100% on during the occupancy time (nine hours/day). The initial lighting parameters like the luminaire’s spectral power distribution curve (Fig. 5), the luminous intensity distribution diagrams (Fig. 6) and the IES files were obtained via the manufacturer. The electric light level was increased from 0% to 100% in 10% discrete steps by multiplying the IES file luminance values by the dimming factor (0.0 - 1.0). The results are then added for each point and viewing direction to the daylight results based on how much electric light is needed to achieve the evaluation criteria. Different light sources were used for further optimisation of the underperforming season, as shown in Table 3. The tested light sources have low and high mDER values (‘blue’ peak) and relatively similar lumen output to enhance the beyond-visual light outcomes.
Figure 5
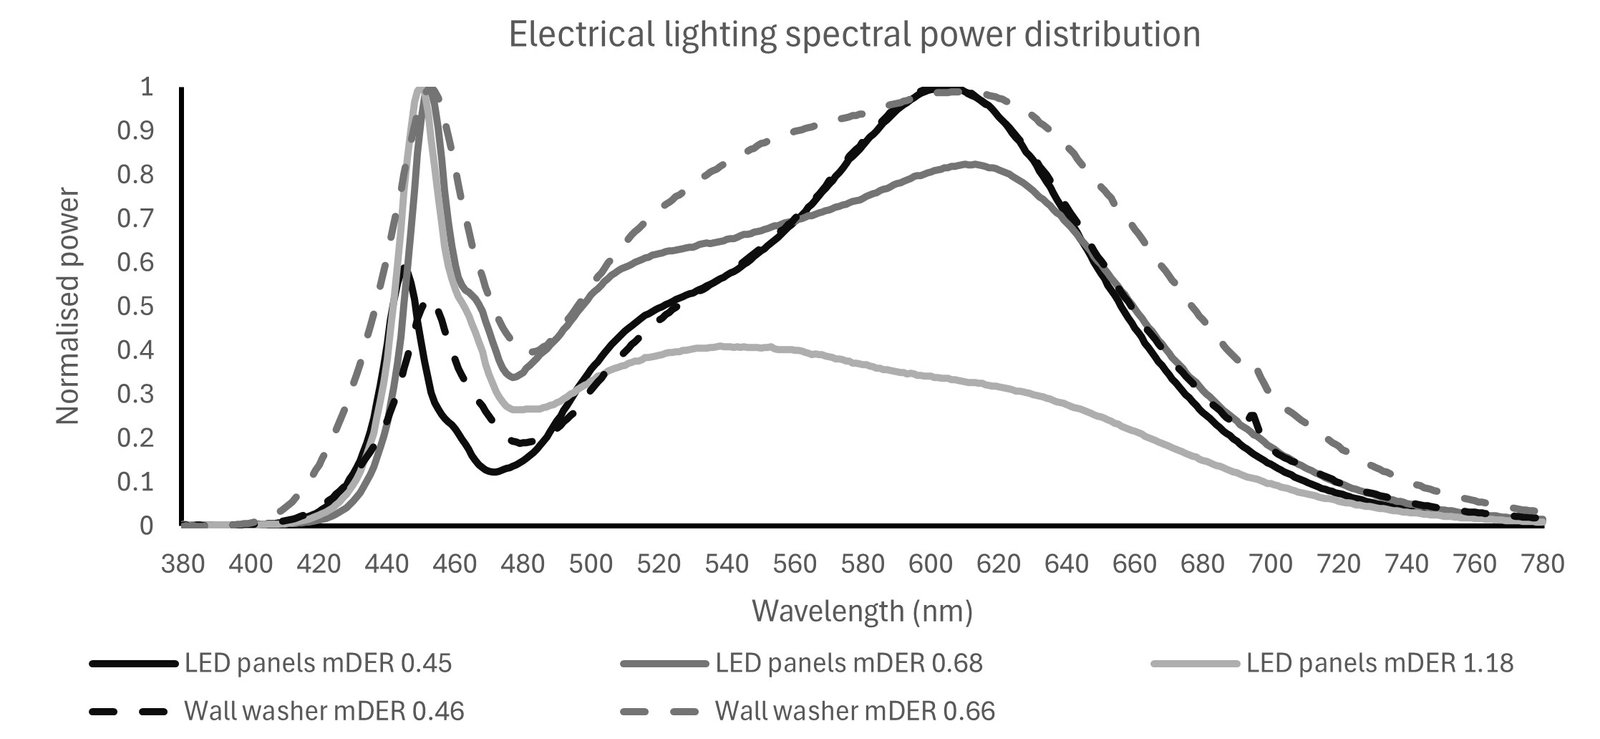
Fig. 5. The spectral power distribution of the electric light sources, continuous line for the LED panels and dashed line for the wall washers.
Figure 6
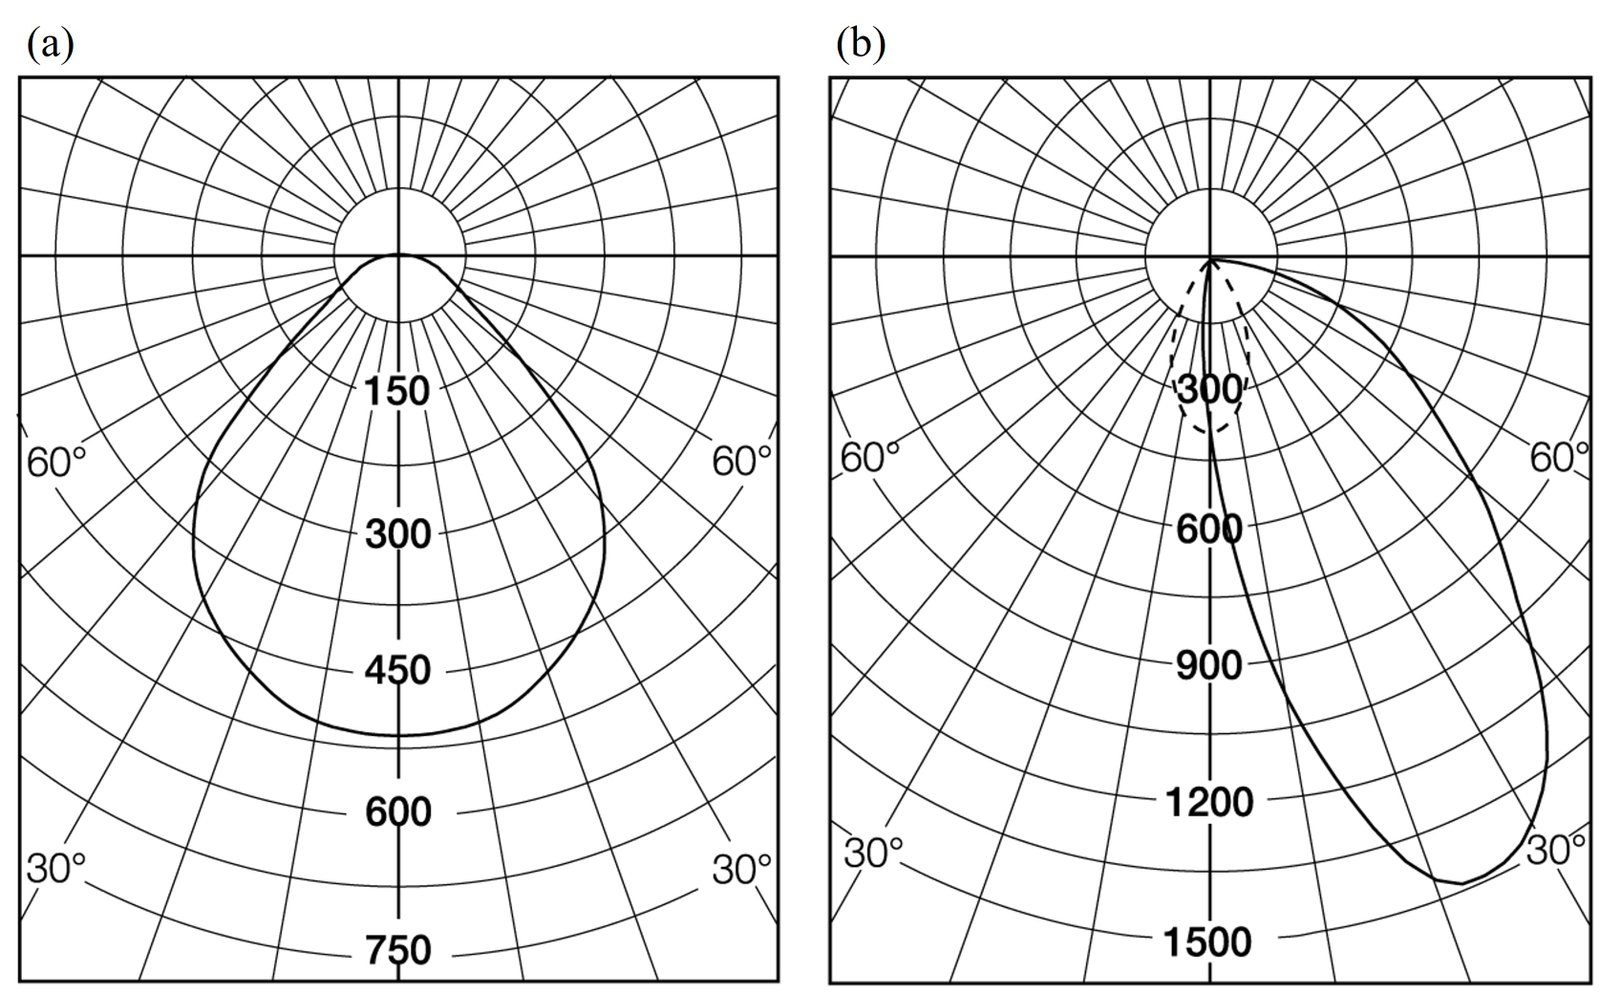
Fig. 6. Luminous intensity distribution diagrams for (a) all ceiling LED panels and (b) all wall washers.
Table 3
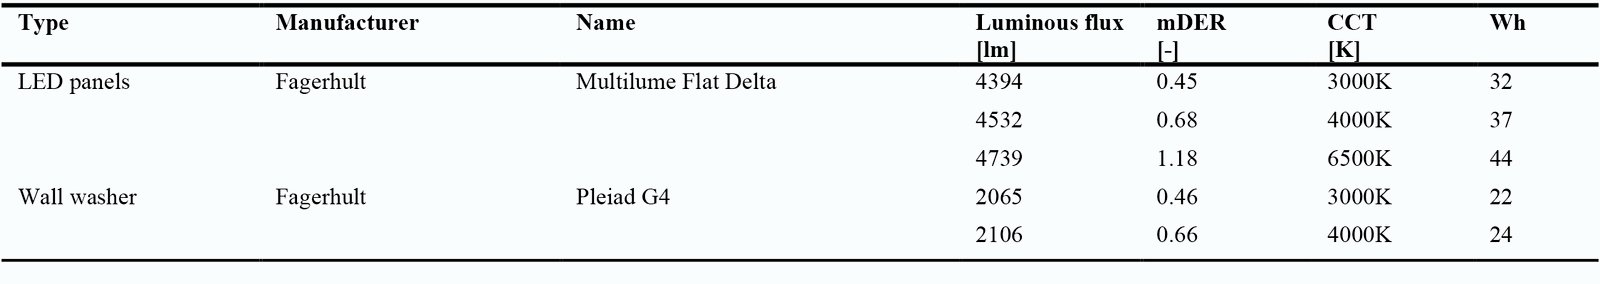
Table 3. Electric light types used in further optimisation with different light directionality and spectrum.
2.2. Calibration and validation
The office room and the surrounding building were initially modelled in Autodesk Revit 2022 and then exported to Rhinoceros 7 (McNeel LLC) as a DWG file. Since Revit is a standard CAD tool for architects and engineers, leveraging an existing model is more practical than rebuilding it in Rhino. However, for simulations, the model often needs to be transferred and refined in Rhino to meet specific requirements, such as layering different building components. While direct modelling in Rhino allows precise geometry control, using a Revit model ensures consistency with the original design and streamlines the workflow [63]. Grasshopper plug-in Lark v2.0 [70] was used for all spectrum-based lighting simulations. The simulation model was calibrated and validated by placing illuminance data loggers at two control points in four viewing directions in the vertical plane and one horizontally and collecting daylight levels for three days (March 1-3, 2024) at one-minute intervals (Appendix C). An additional logger on the rooftop collected sky illuminance and was converted to global horizontal irradiance (GHI).
The model was simulated with initial measured and calculated inputs (Table 4 in Appendix B) for surface material before calibration), followed by adjustments to increase accuracy, as described by He et al. [81]. Surface reflectance, transmittance, and Radiance simulation parameters were adjusted until the simulation data strongly correlated with real-world measurements. The model calibration produced new surface material properties (Table 1, same as Table C1 in Appendix C), as the previously measured properties were approximate. Regression analysis was performed with R² values, mean biased error (MBE), and root mean squared error (RMSE) to characterise the data similarities and differences. The average MBE (-10.5) and RMSE (29.8) for both points show that the error is relatively acceptable compared to other studies' ranges [82,83] (Appendix C).
Table 4
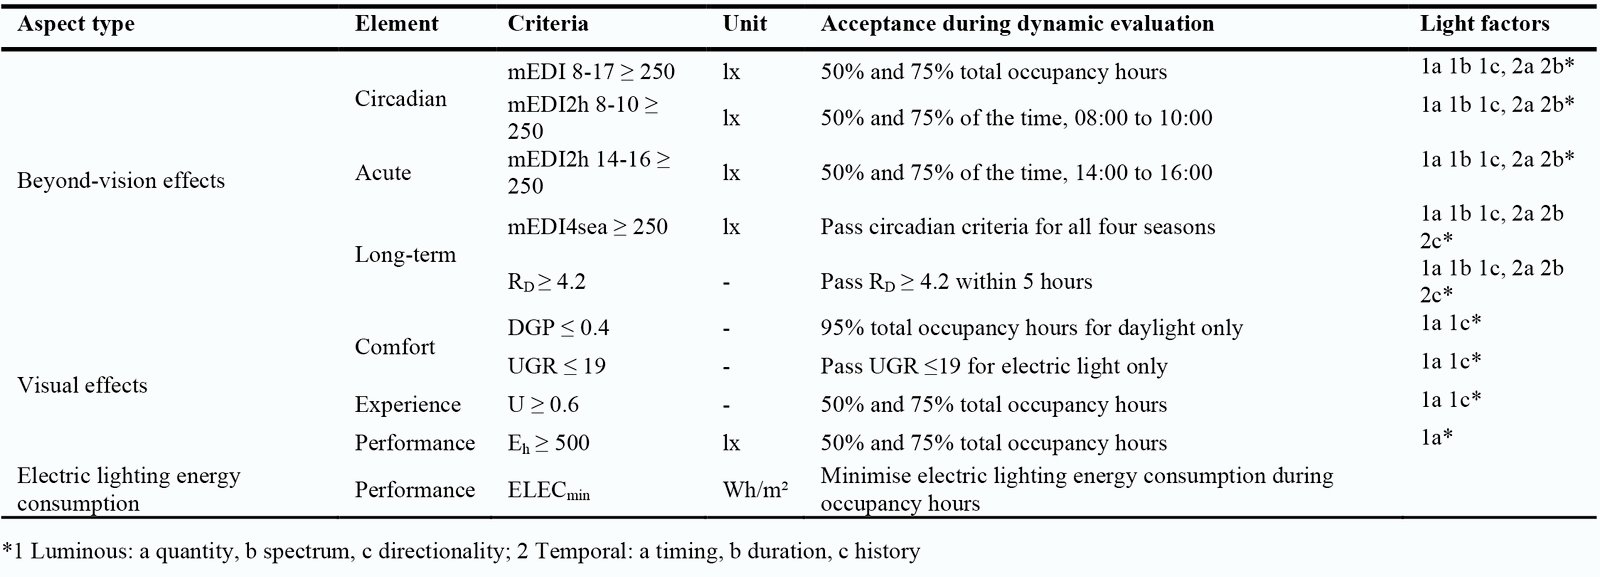
Table 4. A summary of evaluation criteria is included to provide boundaries to the solution space.
2.3. Evaluation criteria
Beyond-visual and visual effects evaluations were made using multiple criteria presented in Table 4 according to Houser and Esposito [13] schematic subdivision of the visual and beyond-vision effects (Fig. 7). In theory, buildings should provide comfort and respond to user needs 100% of occupancy time. Nevertheless, it is common engineering practice to accept that this option will not be possible or feasible to choose. Thus, a simplified approach is taken here. Due to its low sophistication, two satisfaction rates were assumed for visual and beyond-visual performance, 50% and 75% of the occupancy time, as a stricter requirement (Table 4). This assumption is supported by several standards like WELL v2 [84], LEED v4.1 [85] and SS-EN 17037:2018+A1:2021 [86], which provide baseline requirements for daylight provision and visual comfort by achieving appropriate lighting levels over at least 50% of the occupied area for 50% of the occupancy hours. Extending this principle for beyond-vision effects ensures consistency with established daylight provision methodologies. The 50% and 75% satisfaction thresholds balance practicality and the ambition to address occupant comfort, recognising that achieving 100% satisfaction is often unfeasible in real-world conditions.
Figure 7
![An overview of the study evaluation showing the stimulus/response relationship between architecture design, light factors and human responses, with a schematic subdivision of the visual and beyond-vision effects and their metrics (inspired by Houser and Esposito [13],Khademagha et al. [33]).](figures/12-306-7.jpg)
Fig. 7. An overview of the study evaluation showing the stimulus/response relationship between architecture design, light factors and human responses, with a schematic subdivision of the visual and beyond-vision effects and their metrics (inspired by Houser and Esposito [13],Khademagha et al. [33]).
2.3.1. Beyond-Vision effects
Recently, recommendations were made by the CIE, proposing ‘α-opic Equivalent Daylight Illuminance values’ (in lux) as metrics to specify the impact of lighting on either of the five α-opic human photoreceptors [8]. Metrics like ‘melanopic equivalent daylight illuminance’ (mEDI) are based on the spectral sensitivity of the ipRGCs [8,9]. mEDI is a measure that quantifies the effectiveness of a light source in stimulating melanopsin relative to a standard daylight illuminant (D65). mEDI is calculated as the product of photopic illuminance (Ev) and the Melanopic Daylight Efficacy Ratio (mDER). The mDER is a unitless ratio that compares the melanopic efficacy of the test source to that of D65 daylight [13]. Therefore, mEDI was chosen to evaluate the performance regarding beyond-vision effects [9] as well as the non-visual direct-response (nvRD) model by Ámundadóttir et al. [87]. It is a model that takes a time series of eye-level light stimuli as input to predict the accumulative human alerting response over time [87] responding to the previous light history.
2.3.1.1. Circadian responses
Regarding circadian responses, early to mid-morning light advances the clock (shortening our biological day). A phase-response curve (PRC) describes the direction and magnitude of circadian phase resetting effects with respect to the time of light exposure [2,88]. Research has found that bright daytime light enhances circadian rhythm amplitude and robustness in mammals by strengthening suprachiasmatic nuclei (SCN) electrical activity patterns, making them less sensitive to evening light [45,46]. Increased access to natural daylight in the workplace improved sleep and cognitive performance in office workers [48]. Optimised office lighting can advance the melatonin phase and peripheral heat loss before bedtime, improving sleep efficiency [89]. More daytime light exposure is associated with earlier sleep timing, as confirmed by actigraphy and subjective measurements [47].
It is essential to distinguish between morning light exposure and daily average light exposure when investigating circadian effects [90]. Offering light with relatively high melanopic EDI in the early morning has shown to advance and stabilise the circadian phase [2,91], reduce sleep latency [92], improve sleep quality [49,50]. An hour of bright white light in the early morning (08:30– 09:30) improves performance and advances sleep and circadian phase during the Antarctic winter [93]. Another study suggested two metrics with daylight levels and duration of exposure, (1) 400 photopic lux for 5 hours in the daytime, Daylight for Health and Wellbeing (DHW (D, Daily)), and (2) 500 photopic lux for 1 hour in the early morning, 08:00– 09:00; Daylight for Health and Wellbeing (DHW (M, Morning)) [90].
Other studies have explored dynamic lighting schedules that adjust photopic illuminance levels and CCT throughout the day in office environments. Van Bommel [94,95] proposed a schedule starting with 800 lx (6000 K) at 08:00–09:00 to support circadian regulation in winter. Light levels then decrease to 500 lx (3000 K) by lunchtime for relaxation, followed by a boost around 14:00 to counter the post-lunch dip, before gradually returning to 500 lx (3000 K) by 18:00. Ru et al. [92] applied bright, cool white light (6500 K, 1000 lx at the eye; 1650 lx at the table) in the early morning (∼09:00–10:30) and early afternoon (∼14:00–15:30). Between these boosts, the light reverted to standard office settings (4000 K, 345 lx at the eye, 500 lx at the table) in the late morning and mid-afternoon.
Although the exact boundaries of the timing of light exposure have not yet been defined, studies show overlapping timing, duration, and light levels [96], as seen above. A well-established study by Andersen et al. [2] identified three distinct timings for circadian entrainment, a classification that has been supported [16,24,88] and adopted by research [97-102]: early to mid-morning (06:00–10:00), where sufficient daylight illuminance can serve to phase advance the clock in the majority of people; mid-morning to early evening (10:00–18:00), where high levels of daylight illuminance may lead to increased levels of subjective alertness without exerting substantial phase-shifting effects on the clock, and the rest as notional night-time (18:00– 6:00), where daylight exposure that might trigger effects beyond vision is to be avoided so as not to disrupt the natural wake-sleep cycle [2].
According to this division, recommendations made by Brown et al. [9] provided realistic targets that minimise inappropriate responses in the sleep environment (mEDI <1 lx) and reduce these so far as is practically possible pre-sleep (three hours before habitual sleep; mEDI <10 lx) while maximising relevant effects across the intervening daytime hours (mEDI >250 lx). According to WELL standard [84], electrical lighting is used in workstations during the day to achieve a mEDI of 250 lx for at least four hours (beginning by noon at the latest). Therefore, the mEDI 8-17 between 8:00 and 17:00 had to be equal or exceed 250 lx for at least 50% and 75% of total occupancy hours.
It is essential to establish criteria by distinguishing between morning light exposure and daily average light exposure when proposing new daylighting metrics [90]. A combination of these criteria proposes theoretically that a person should get a mEDI of 250 lx for four hours during the daytime, out of which two hours from 08:00 to 10:00 to phase advance the circadian clock, which is relevant for the office room occupancy time. Hence, an additional metric was added to the evaluation criteria: ‘mEDI2h 8-10’. The mEDI2h 8-10 had to be equal to or exceed 250lx for the two hours from 08:00 to 10:00 at least one hour, which means 50% of the time from 08:00 to 10:00.
2.3.1.2. Acute responses
An additional metric has been introduced to account for the acute (non-visual) responses to light. Acute light effects are particularly relevant in work environments as they can enhance alertness, improve cognitive performance, and prevent drowsiness [21,35,48]. These effects are especially beneficial during the afternoon, when persons may experience tiredness, fatigue or a drop in alertness after eating lunch as blood flow is directed to the digestive system, temporarily reducing brain circulation and leading to drowsiness [103,104]. Light exposure can help to counteract the post-lunch dip and prepare individuals for safe commutes after work [7,17,34]. There are indications that a post-lunch dip in alertness and performance is widely experienced during the early afternoon (14:00–16:00) in the workplace [103,104]. Several laboratory studies demonstrated that exposure to a high melanopic EDI in the early afternoon has the potential to counteract the post-lunch dip [105-108]. Yet, it is notable that sustained exposure to high melanopic EDI would not always result in beneficial effects during daytime working hours and is sometimes experienced as less pleasant [109-111].
Therefore, the recommendation by Brown et al. [9] and WELL standard [84] of 250 lx will be used as a minimum light level for the evaluation criteria mEDI2h 14-16. The proposed metric focuses on improving alertness during early afternoon hours, particularly in darker seasons when daylight is limited. This can be achieved by increasing indoor light levels. While the metric mEDI 8-17 partially addresses similar outcomes, its requirement of achieving 250 lx for 50% of the occupancy time between 8:00 and 17:00 does not specifically guarantee sufficient light levels in the early afternoon. For instance, the required light exposure may occur only in the morning.
The mEDI2h 14-16 had to be equal to or exceed 250 lx for at least one hour, which means 50% of the time from 14:00 to 16:00. While the full two-hour period is preferred to maximise alertness, cognitive performance, and well-being and counteract the post-lunch dip, the one-hour minimum serves as a practical threshold to address constraints like energy consumption and limited daylight in darker seasons. Results are categorised into two scales: 50%-75% (1-1.5 hours) and 75%-100% (1.5-2 hours) compliance. This allows for a nuanced evaluation of the metric's effectiveness under both minimal and ideal conditions.
2.3.1.3. Long-Term responses
A comparison was conducted at daily and seasonal levels across four representative seasonal days using the non-visual direct-response (nvRD) model and the metric mEDI4sea to evaluate long-term responses to light. The mEDI4sea metric evaluates whether the lighting meets circadian response criteria. Specifically, mEDI 8-17 must equal or exceed 250 lx for all four seasonal days, and mEDI2h 8-10 must be fulfilled in the morning with the help of electrical lighting.
Seasonal variations significantly influence long-term responses to light in day length and light levels [20]. Less daylight exposure in winter increases melatonin sensitivity to light suppression [52], while higher daylight doses in spring/summer reduce sensitivity [41]. Huiberts et al. [20] highlight that these seasonal light/response interactions are most prominent during morning sessions. Seasonal variations in melanopsin-driven responses to light may pose risks for non-seasonal depression and Seasonal Affective Disorder (SAD) [32]. Low winter light levels, combined with reduced retinal sensitivity [40,51], may result in insufficient circadian input to synchronise the biological clock with the solar day and to modulate mood and alertness [15,44]. Studies suggest that white- and blue-LED light sources can prevent SAD at lower light levels [31], with Glickman et al. [53] reporting significant antidepressant effects after 45 minutes of morning exposure to short-wavelength LED light for 3 weeks.
The nvRD model adapts to the spectral sensitivity of ipRGCs (peak sensitivity at 490 nm) to calculate effective irradiance, which is used to determine relative non-visual responses through an intensity-response function based on the half-maximum response. The model outputs time-sampled relative non-visual and cumulative responses to evaluate light exposure effectiveness.
A threshold derived from Phipps-Nelson et al. [112] is integrated into the model. This study demonstrated that five hours of 1000 lx (polychromatic light, equivalent to 2.7 W/m² effective irradiance) reduced sleepiness and improved performance in sleep-restricted individuals. Simulating this light profile produced a cumulative response (RD) of 4.2, a benchmark for evaluating potential health benefits. Achieving an RD of 4.2 within five hours ensures effective light exposure that supports performance improvements (e.g., faster reaction times in the Psychomotor Vigilance Task, PVT). It reduces subjective sleepiness (measured by KSS). A longer duration to meet the threshold indicates a less effective light source.
In Lark 2, the nvRD model will simulate cumulative responses (RD) for each seasonal day to verify compliance with the RD threshold and mEDI4sea criteria. Both requirements are evaluated on a pass/fail basis, ensuring that the light design effectively supports the cumulative light history for each seasonal day and supports long-term circadian health and performance over varying seasonal conditions.
2.3.2. Visual effects
The visual effects of light include slow and fast eye-brain responses that influence sight and perception in different ways. The visual effects of light included different metrics for visual comfort, visual experience, and visual performance [13]. Visual performance refers to how well a person can see and complete tasks. Visual experience describes the subjective perception of the environment, shaped by brightness, colour, and contrast. Visual comfort relates to the absence of discomfort, ensuring lighting conditions prevent glare, excessive brightness contrasts, or flicker that may cause strain and fatigue [13].
2.3.2.1. Visual comfort
Visual comfort was evaluated by simulating the simplified Daylight Glare Probability (DGP) based on the vertical illuminance at the eye level [113]. DGP predicts the likelihood that an observer at a given view position and orientation will experience discomfort glare. It should be noted that controlling glare closer to the window is easier through adequate devices. Still, without careful design, these could hinder lighting levels from natural sources deeper in the room, requiring electric lighting to compensate (for example, when blinds are totally closed). The time satisfaction of DGP is the percentage of occupancy hours across the regularly occupied floor area that experience imperceptible (DGP ≤ 0.35) or perceptible (0.35 < DGP ≤ 0.40) glare according to SS-EN 17037:2018+A1:2021 [86]. Daylight glare probability at all viewing directions had to be equal to or less than DGP 0.4 for a minimum of 95% total occupancy hours.
Bright light sources can cause glare and impair the vision of objects. With added electric lighting, visual comfort is assessed using the Unified Glare Rating (UGR), an objective measure of glare that lighting designers use to help control the risk that occupants of a building will experience glare from the artificial lighting. According to SS-EN 12464-1:2022 [85], UGR shall not exceed 19 for office writing, typing, reading, and data processing tasks. UGR had to be equal to or less than 19 for electric light only, a pass or fail.
2.3.2.2. Visual experience
Regarding the measures for visual experience, uniformity U was calculated by dividing the minimum horizontal illuminance by the average horizontal illuminance. The SS-EN 12464-1:2021 [114] standard says uniformity shall be U ≥ 0.60 in offices in the immediate surrounding area. Illuminance uniformity (Emin/Eavg) had to be equal to or higher than 0.6 for a minimum of 50% and 75% total occupancy hours.
2.3.2.3. Visual performance
Horizontal illuminance was chosen as an indicator of visual performance. Normal office tasks were assumed to be done with a horizontal illuminance target level of 500 lx, as stated in SS-EN 12464-1:2022 and SS-EN 17037:2018+A1:2021 standards [86,114] and the Swedish Work Environment Agency (Arbetsmiljöverket). Horizontal illuminance was measured at a height of 0.75 m with hourly intervals. Illuminance had to equal or exceed 500 lx for a minimum of 50% and 75% total occupancy hours.
2.3.2.3. Energy consumption
Energy consumption evaluation benchmarks included only electric lighting. As the study scope did not include thermal evaluation, only electric lighting energy consumption (ELEC) was calculated for the occupancy hours. ELEC had to be minimised (ELECmin).
An overview of all evaluation criteria used in the simulations is shown in Table 4 and visualised in Fig. 7. Accomplishing all evaluation criteria for all viewing directions with daylight and added electric lighting while minimising energy consumption was deemed sufficient to accept a WWR into the solution space.
2.4. Simulation procedure
The simulations were performed in three stages, as demonstrated in Fig. 8.
Figure 8
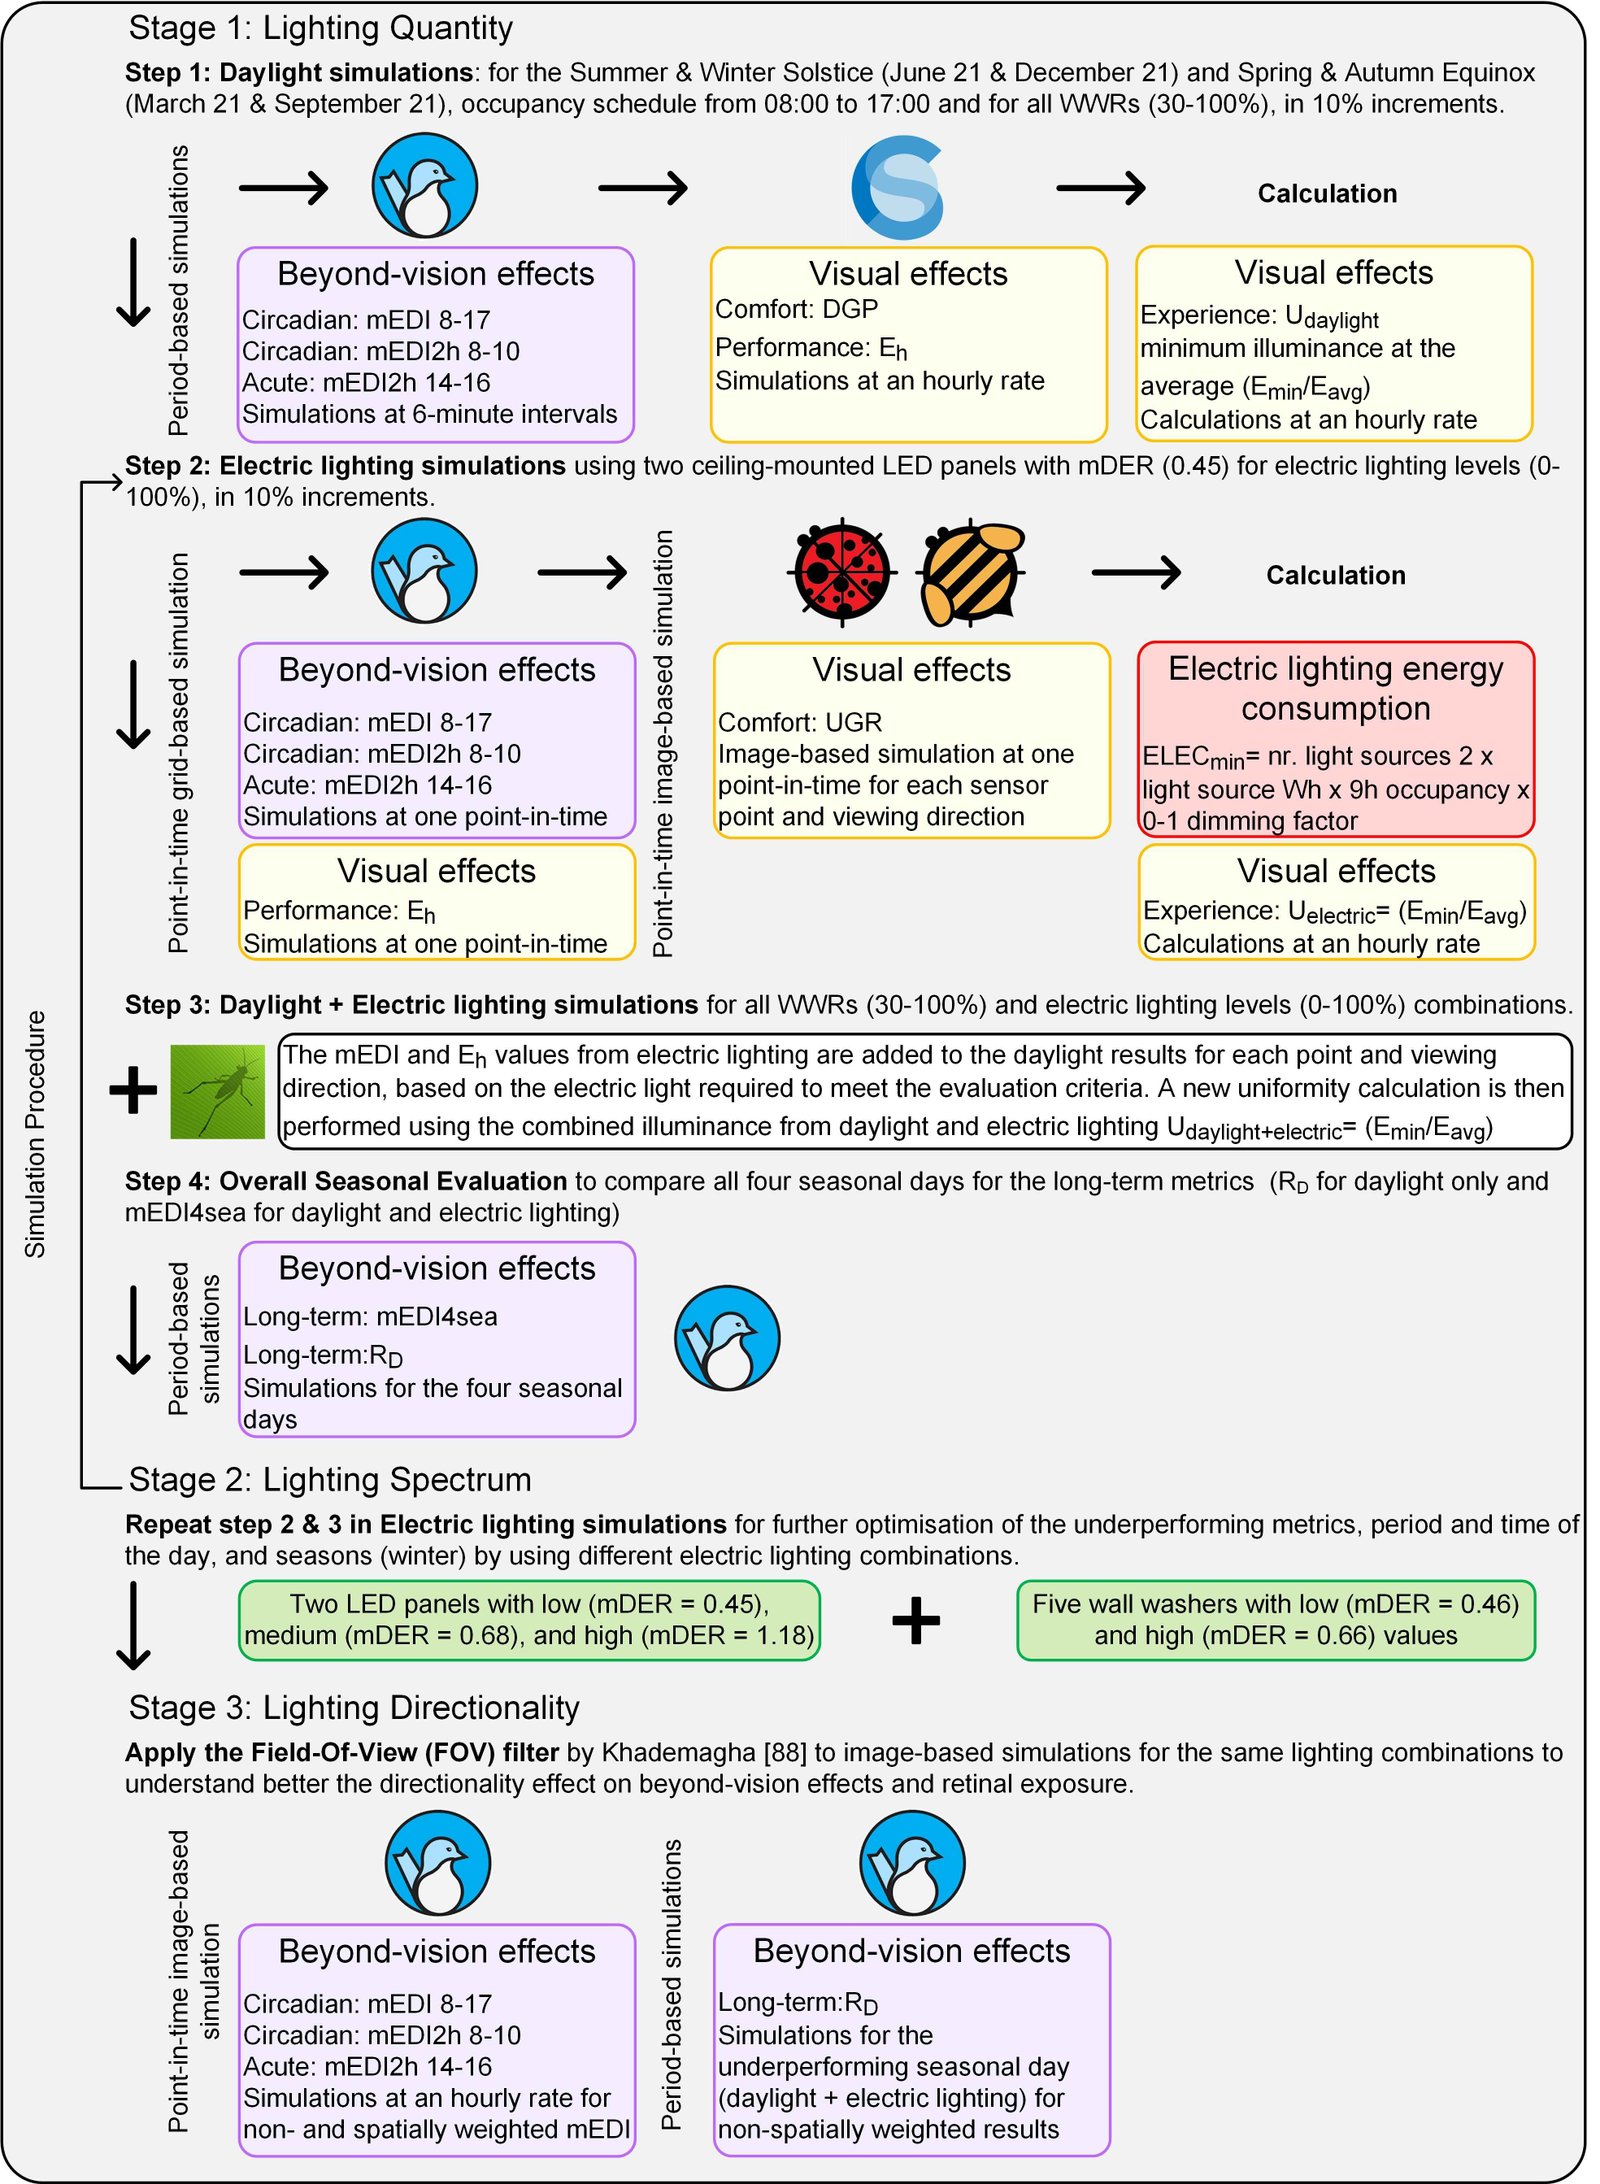
Fig. 8. Workflow of simulation procedure for the three stages: lighting quantity, spectrum and directionality, demonstrating the investigated metrics, and simulation tools for each step.
2.4.1. Stage 1: lighting quantity
First, for lighting quantity, simulations were run for the spring equinox (March 21), summer solstice (June 21), autumn equinox (September 21), and winter solstice (December 21). The assumed occupancy schedule for the room was from 08:00 to 17:00. All metrics were simulated or calculated for all WWRs (30-100%) and electric lighting levels (0-100%) using two ceiling-mounted LED panels with mDER (0.45). Daylight period-based simulations were run for all beyond-vision metrics at 6-minute intervals using Lark v2.0 [70]. ClimateStudio 1.9 [69] was employed for DGP and Eh at an hourly rate and uniformity was calculated by the minimum illuminance at the average (Emin/Eavg). For electric lighting point-in-time grid-based simulations, Lark v2.0 was used to simulate all beyond-vision effects metrics and Eh. Image-based simulations were used for UGR analysis using Ladybug and Honeybee. Electric lighting was dimmed with 10% discrete steps by multiplying the IES file luminance values by the dimming factor (100% - 0%). The results are added for each point and viewing direction to the daylight results based on how much electric light is needed to achieve the evaluation criteria. All metrics presented in the section 2.3 were calculated as the percentage of total occupancy hours that fulfilled the evaluation criteria. This step has helped to identify the underperforming metrics, period and time of the day, and seasons.
2.4.2. Stage 2: lighting spectrum
For further optimisation of the underperforming season and metrics in stage two, different lighting combinations of two LED panels with low mDER (0.45), medium mDER (0.68) and high mDER (1.18) plus five wall washers with low mDER (0.46) and high mDER (0.66) were used to test the effect of the lighting spectrum and directionality on the evaluation metrics.
2.4.3. Stage 3: lighting directionality
In the third stage, the Field-Of-View (FOV) filter by Khademagha [88] was applied to image-based simulations in Lark v2.0 for the same lighting combinations to understand better the directionality effect on beyond-vision effects and how much light the human eye receives. According to Khademagha [88] The weighting factors for different areas of the visual field were derived based on laboratory studies on melatonin suppression. First, data from Glickman et al. [36] showed that exposure to the inferior retina (upper visual field) suppressed melatonin ~6 times more than superior retinal exposure (lower visual field), leading to a 6:1 sample weighting ratio between these regions. Next, Rüger et al. [37] demonstrated that nasal retinal exposure (outer visual field) resulted in twice the melatonin suppression compared to temporal retinal exposure (inner visual field), yielding a 2:1 sample weighting ratio for inner vs. outer visual fields.
Since both eyes contribute to the visual field, there is an overlap between the inner and outer visual fields of each eye. The inner visual field of one eye partially overlaps with the outer visual field of the other eye, meaning both regions share some influence. To reflect this, the weighting factors for the inner and outer fields were adjusted proportionally, assigning higher weight to the inner fields (3) and lower weight to the outer fields (2). Finally, to determine the actual weighting factors, the 6:1 ratio (upper vs. lower visual fields) was multiplied by the 3:2 ratio (inner vs. outer visual fields), resulting in sample values of 12 (upper-outer), 18 (upper-inner), 3 (lower-outer), and 2 (lower-inner). Each sample weighting (e.g., 12/35 for the upper-outer field) was then divided by its expected equal contribution of 1/4, since there are four visual field areas, ensuring that the final weighting factors were proportionally adjusted. This resulted in the final values: 2.06 (upper-inner), 1.37 (upper-outer), 0.34 (lower-inner), and 0.23 (lower-outer).
These weighting factors are applied on HDR images for the upper-inner, upper-outer, lower-inner, and lower-outer masks, resulting in spatially weighted mEDI results presented as a timeline for the selected hours 8:00-10:00, 12:00 and 14:00-15:00 at the central point five for façade- and rear-facing viewing directions. The RD metric was simulated for daylight + the same electric lighting combinations using period-based Lark v2.0 analysis and presented in the timeline for non-spatially weighted results to show the effect of electric lighting on fulfilling the RD ≥ 4.2 criterion within five hours of continuous light exposure.
2.5. Results visualisation
For stages one and two in the simulation procedure, a simple graphical representation, a sombrero plot, illustrates the evaluation criteria for nine control points and viewing directions. Each layer represents a specific metric in the specified order, as shown in Fig. 9, based on previous work by Ochoa et al. [72] and Andersen et al. [2]. The WWR and electric lighting energy consumption are displayed above each sombrero plot. The inner core of the sombrero plot represents beyond-vision light effects (1: mEDI2h 8-10, 2: mEDI2h 14-16, 3: mEDI 8-17) with four viewing directions, while the outer layers represent visual light effects (4: DGP, 5: UGR (only for electric lighting), 6: U, 7: Eh) with four viewing directions for DGP and horizontal illuminance for U and Eh. For the simulation with added electric lighting, After the seasonal results presentation, (8) RD and (9) mEDI4sea are shown as a separate plot.
Figure 9
![Sombrero plot clarifying the graphical and colour-coded representation of the results for (a) daylight simulations and (b) electric lighting simulations with evaluation criteria and architecture design variables (inspired by Andersen et al. [2]).](figures/12-306-9.jpg)
Fig. 9. Sombrero plot clarifying the graphical and colour-coded representation of the results for (a) daylight simulations and (b) electric lighting simulations with evaluation criteria and architecture design variables (inspired by Andersen et al. [2]).
A scale indicates the percentage of occupancy hours that meet the evaluation criteria, with light green and dark green representing passing results for 50% and 75% of occupancy hours, respectively. The objective is to achieve green plots throughout. The scale indicates only pass or fail for visual comfort criteria (4: DGP and 5: UGR) and long-term responses metrics (8: RD (with a time scale) and 9: mEDI4sea) as green and red. The results apply to a room with specified conditions and dimensions, featuring a single opening in the centre of the façade and adjacent building. Two sets of graphs display the results of daylight simulations alone (a) and then with added electric lighting (b), ensuring all criteria are met for at least 50% of the occupancy hours. For stage three, the results are presented as HDR images for (a) non-spatially weighted mEDI and (b) spatially weighted mEDI (Fig. 10). The RD metric is also presented under each relevant HDR image.
Figure 10
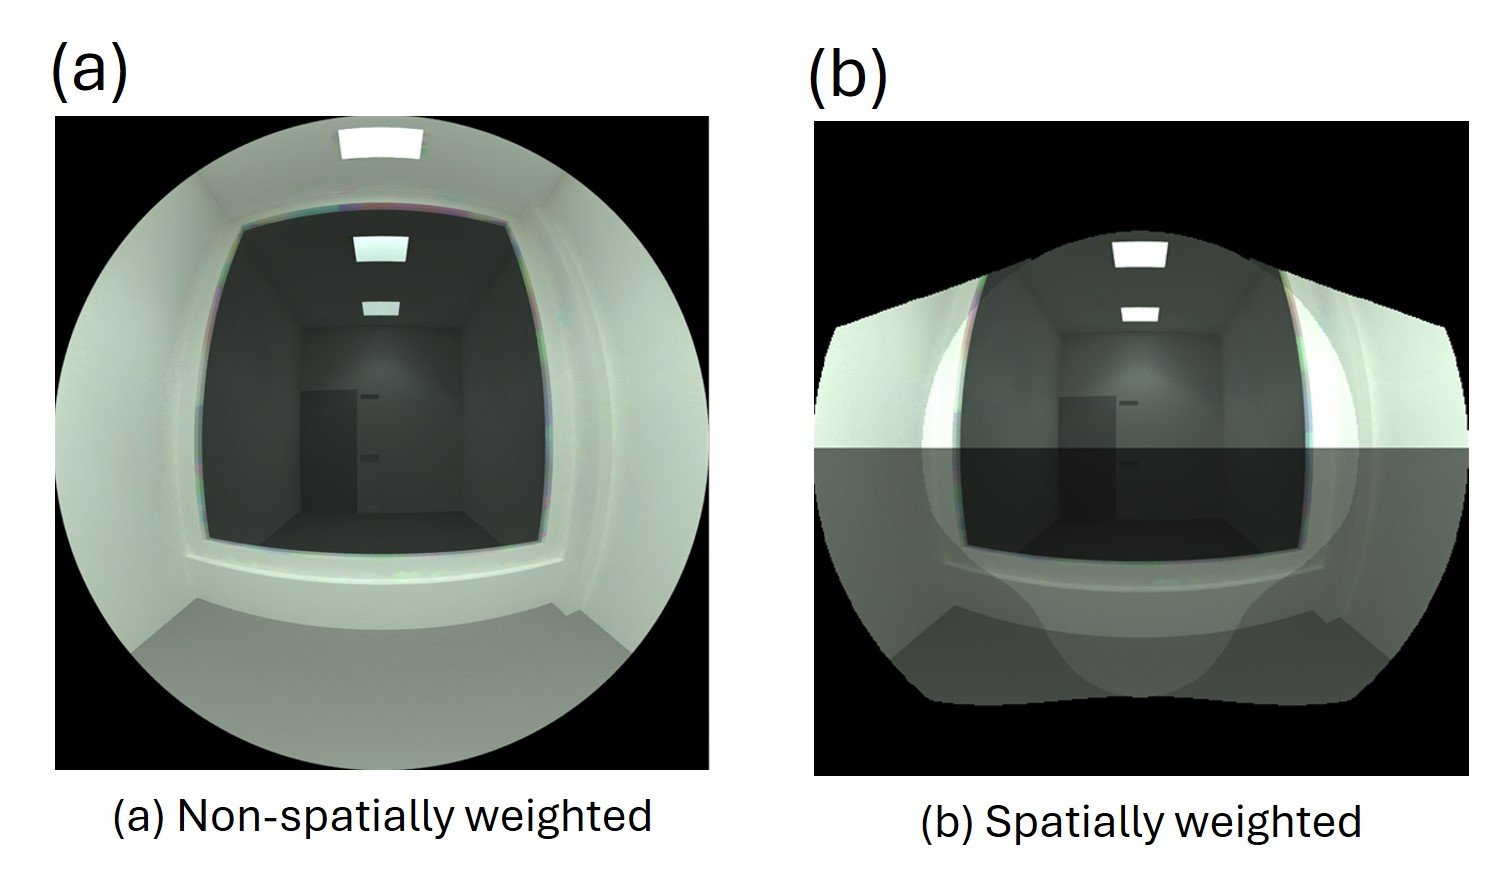
Fig. 6. HDR images for (a) non-spatially weighted mEDI and (b) spatially weighted mEDI.
3. Results
The following sections present results according to the simulation procedure described in paragraph 2.4. In the following sections, the key results are presented, focusing on WWR steps where significant differences in metric performance were observed among the eight WWRs and electric light levels.
3.1. Stage 1: lighting quantity per season
3.1.1. Summer
As expected, the ‘summer’ day performed the best among the seasons. Figure 11 highlights the key results on this day, focusing on WWR steps where significant differences in metric performance were observed among the eight WWRs and electric light levels. The smallest WWR, 30%, achieved all criteria, with daylight only except uniformity. This WWR has not reached U ≥ 0.6 for 50% of the time or more. The other noticeable metric is DGP, shown in red for the façade-facing, left, and right wall viewing directions, especially closer to the window. With added electric lighting of 20% dimming, the uniformity level improved to pass the criterion for more than 50 % of the occupancy time. This addition does not cause luminaire glare, so the UGR is green. Since no shading is added to the simulation, the DGP remains red throughout the different simulations.
Figure 11
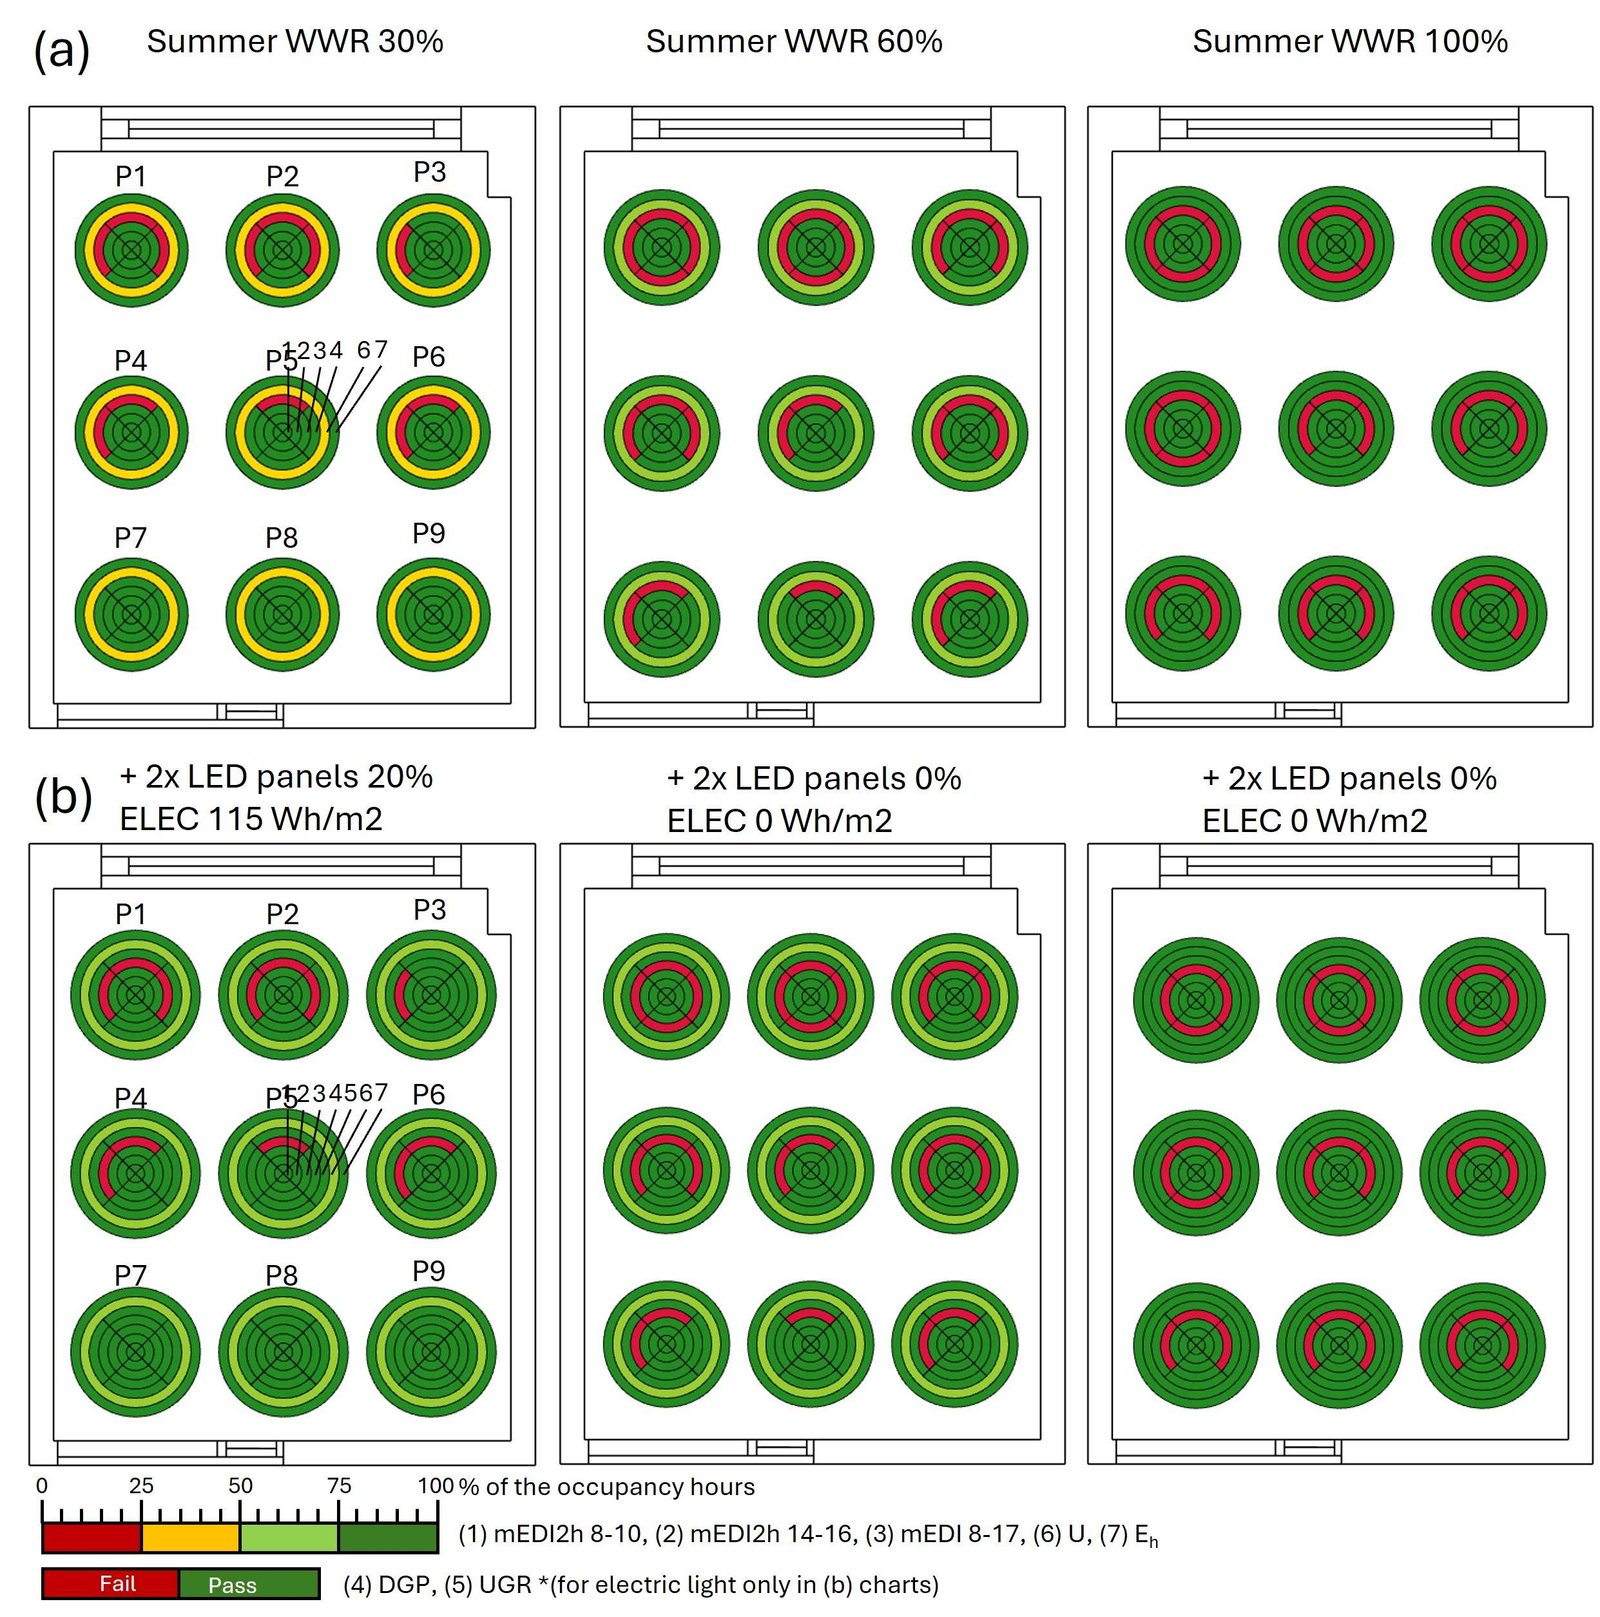
Fig. 11. Simulation results in summer with variable WWR for (a) daylight only and (b) daylight + variable electric light level (2 LED panels).
With a gradual increase, the WWR uniformity improved and achieved the U ≥ 0.6 for 50% of the time or more at WWR 60% with daylight only. At this stage, all metrics except glare are green and pass 50% or 75% of the occupancy time. This means no electric lighting is needed at WWR 60%, and electric lighting energy consumption is at its lowest 0 Wh/m2. With an increased WWR of 100%, all criteria are in dark green, meaning that the criteria are achieved more than 75% of the time, but the glare becomes an issue even deeper in the room. This means that more than 5% of the time, people experience disturbing glares at all points and in different directions. Beyond-vision effects metrics, mEDI2h 8-10, mEDI2h 14-16 and mEDI 8-17 all achieved an mEDI ≥ 250lx for more than 75% of the time for all points and viewing directions regardless of the window size in summer.
3.1.2. Winter
The ‘winter’ day is performing completely the opposite of the summer, as shown in Fig. 12. Uniformity and DGP are the only metrics fulfilling their criteria. WWR 30% shows that the beyond-vision effects metrics (mEDI2h 8-10, mEDI2h 14-16 and mEDI 8-17) and visual performance (Eh) are underperforming with less than 25% of the time for most of the points and viewing directions. With added electric lighting of 100%, Eh ≥ 500lx is achieved but not beyond vision effects, which indicates that a higher light level or blue-enriched light is needed. More specifically, the mEDI2h 8-10 and mEDI2h 14-16 metrics are harder to achieve than mEDI 8-17. With electric light level 100% for the two LED ceiling panels the UGR is still below 19.
Figure 12
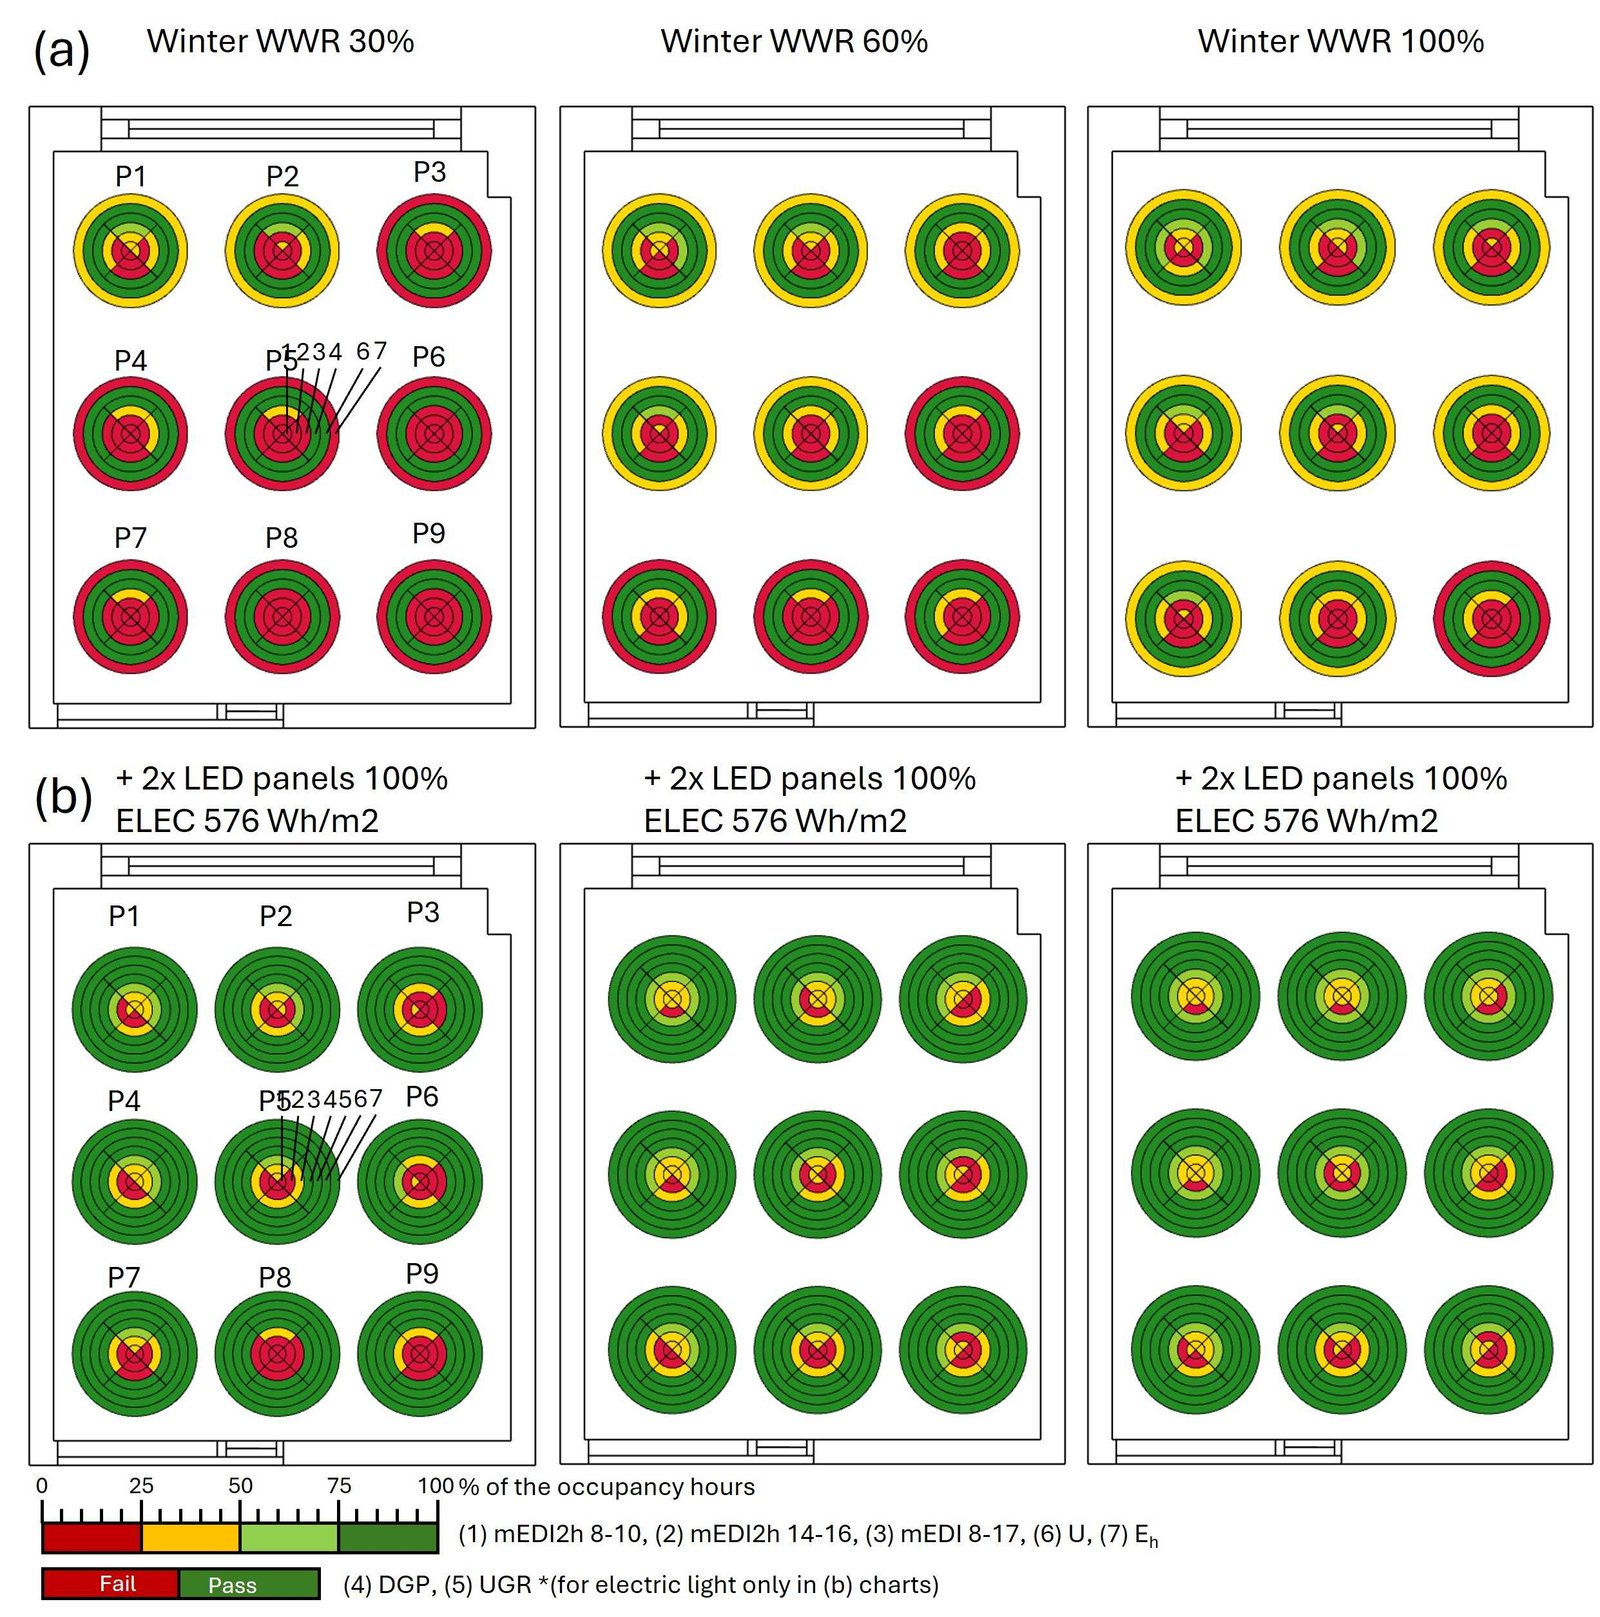
Fig. 12. Simulation results in winter with variable WWR for (a) daylight only and (b) daylight + variable electric light level (2 LED panels).
With an increased WWR of 60%, the same results appear, but this time, the Eh criterion is improving but still underperforming in half of the sensor points, which shows how the light is spreading in the room over time. Generally, the daylight level is equally low at all points, so the uniformity criterion is achieved. In winter, uniformity was better due to the constant dim light levels. With added electric lighting at 100%, beyond-vision effects are still underperforming. Increasing the WWR from 60% to 100% improves Eh deeper in the room but still does not reach Eh ≥ 500lx for 50% of the time or more. Even with the largest WWR and maximum light level of 100%, beyond-vision effects are still underperforming for all points and most viewing directions. Points closer to the window perform slightly better for the façade-facing and left than the right and rear-facing viewing direction because the daylight mainly comes from the Northeast and is reflected on the left wall to the inner points. Electric lighting energy consumption (ELEC) is the highest on the winter seasonal day (2 LED panels * 32 W * 9 h= 576 Wh/m²), where 100% of the electric light level is always needed for all WWRs and still not fulfilling all criteria.
3.1.3. Spring and autumn
Spring and autumn have comparable photoperiods and show similar results, as shown in Figs. 13 and 14. These figures show first (a) the daylight simulation for WWR 30%, 70%, and 100% vertically, then (b1) with added electric lighting to achieve either the visual or beyond-vision light effects and (b2) with added electric lighting to achieve both the visual and beyond-vision light effects criteria. Spring and autumn have varying results in all criteria.
Figure 13
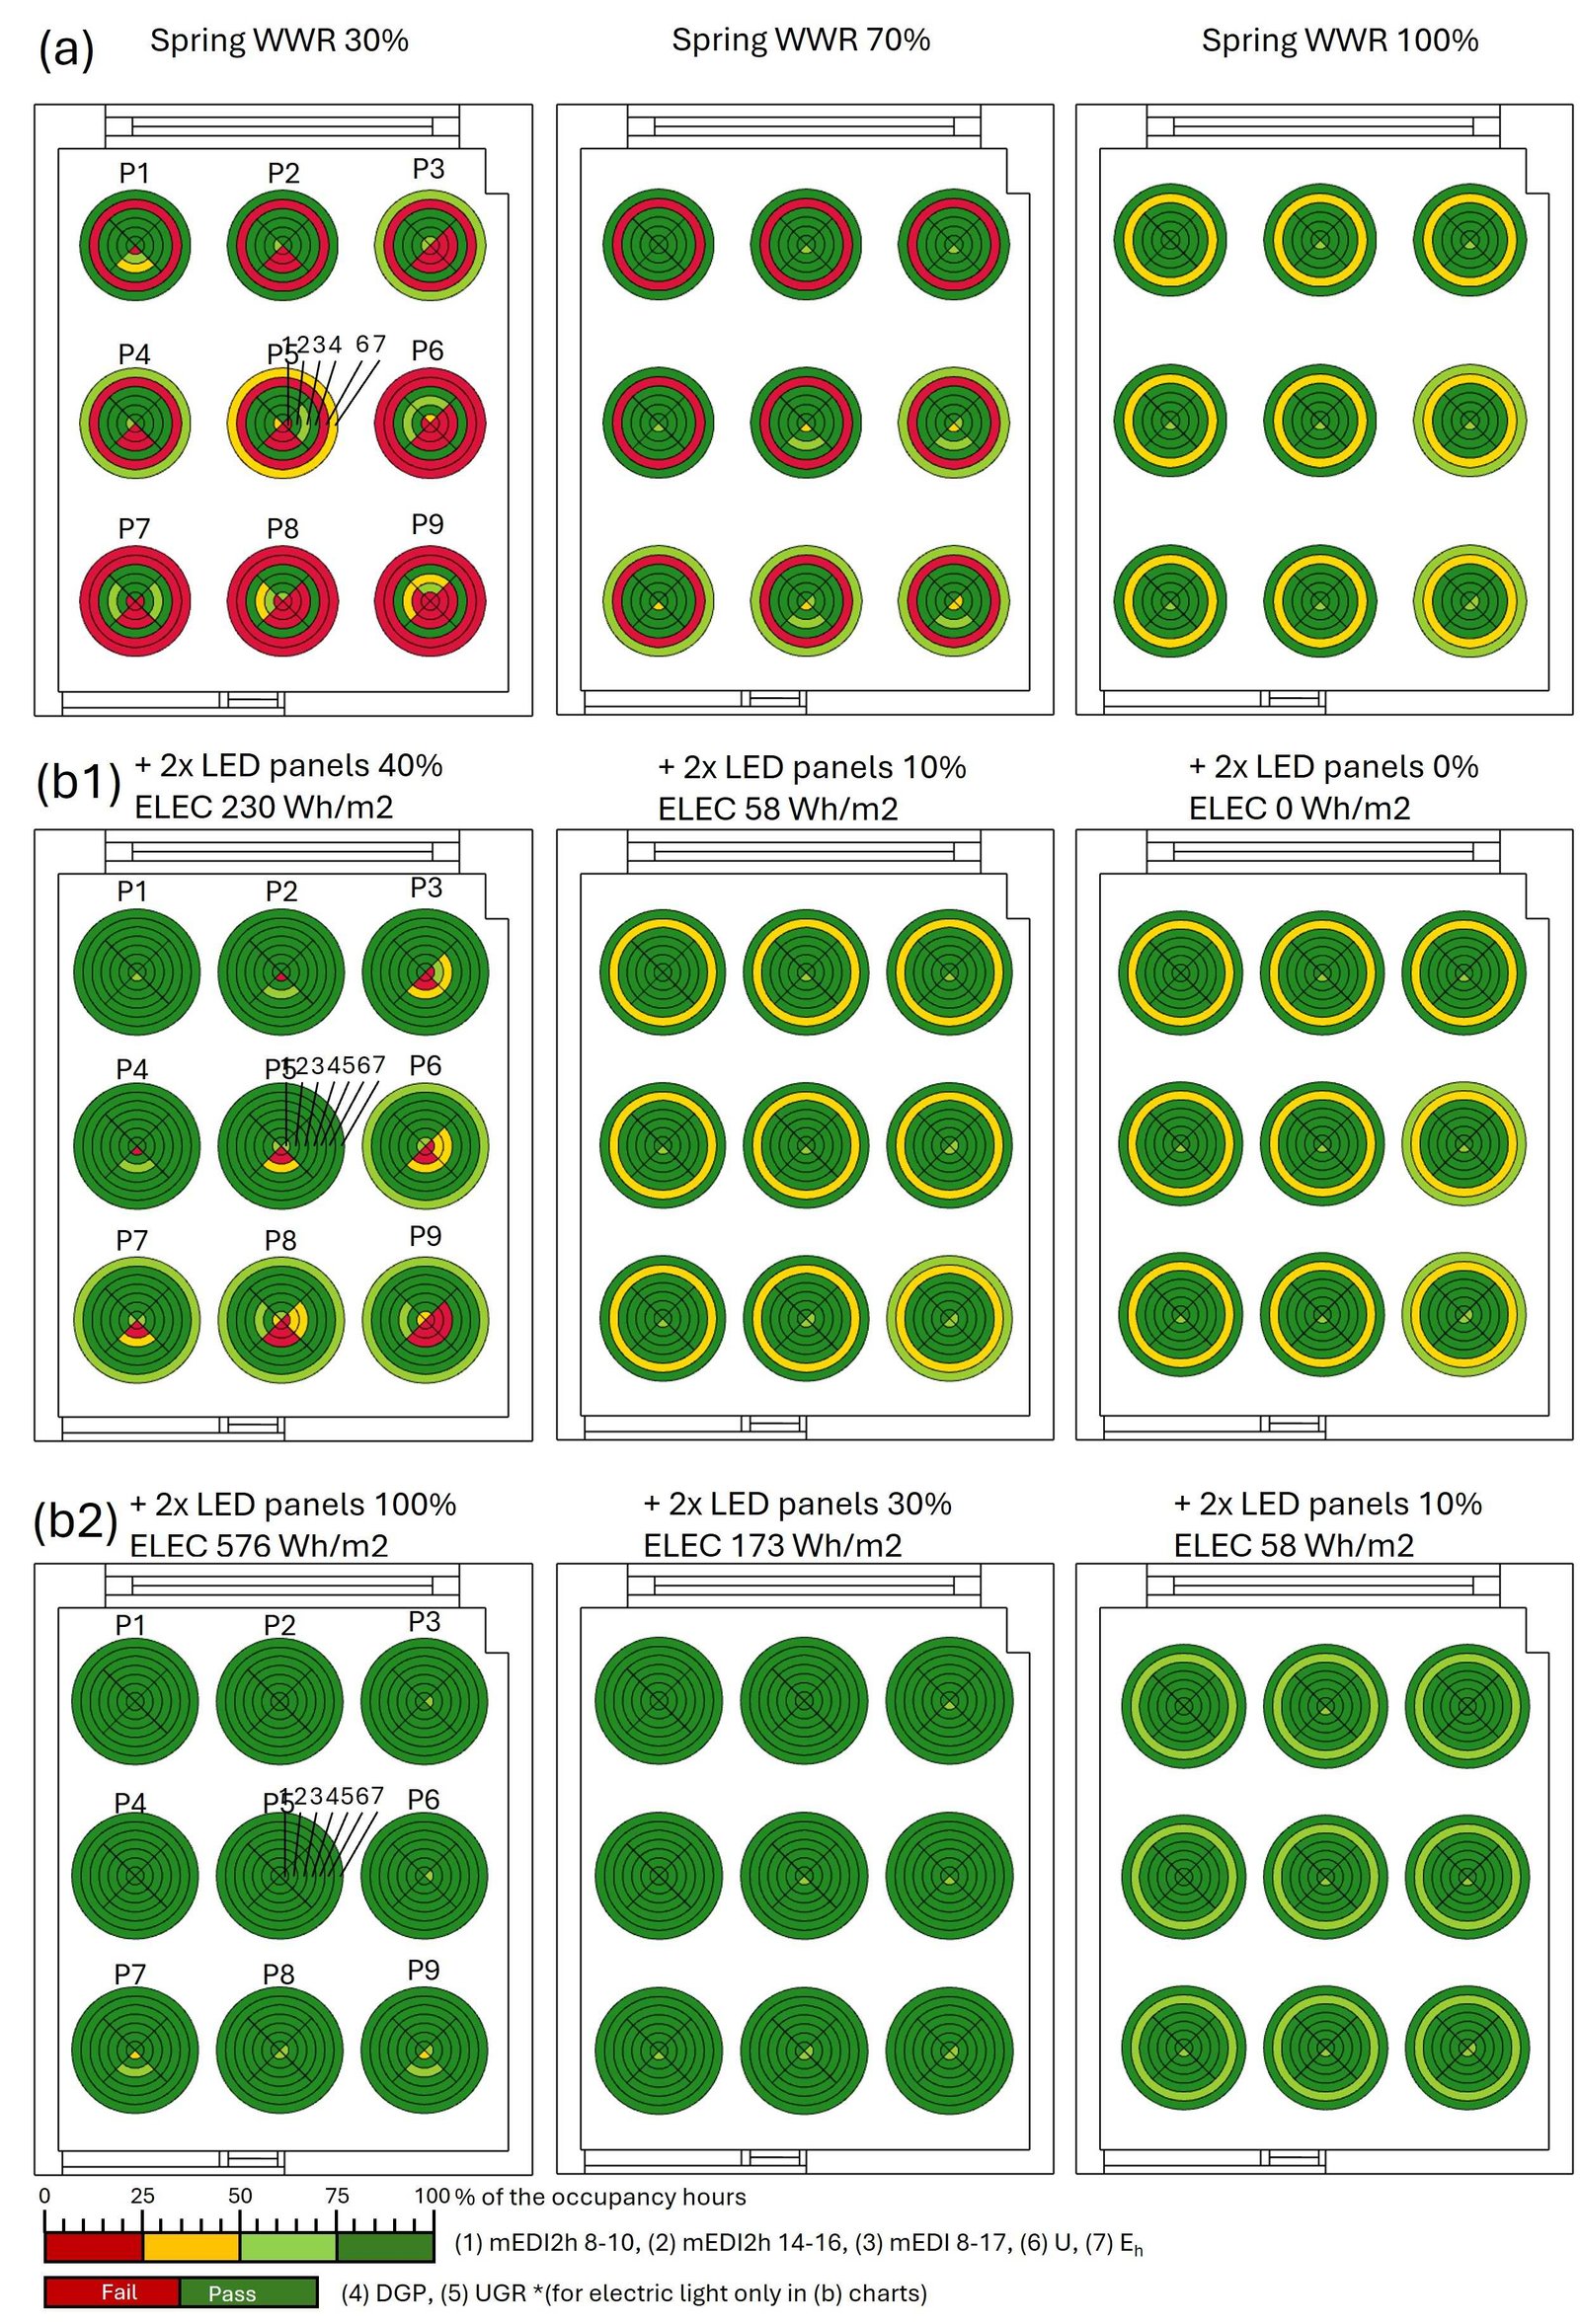
Fig. 13. Simulation results in spring with variable WWR for (a) daylight only, (b1) daylight + variable electric light level so either visual or beyond-vision effects are achieved and (b2) for both being achieved.
Figure 14
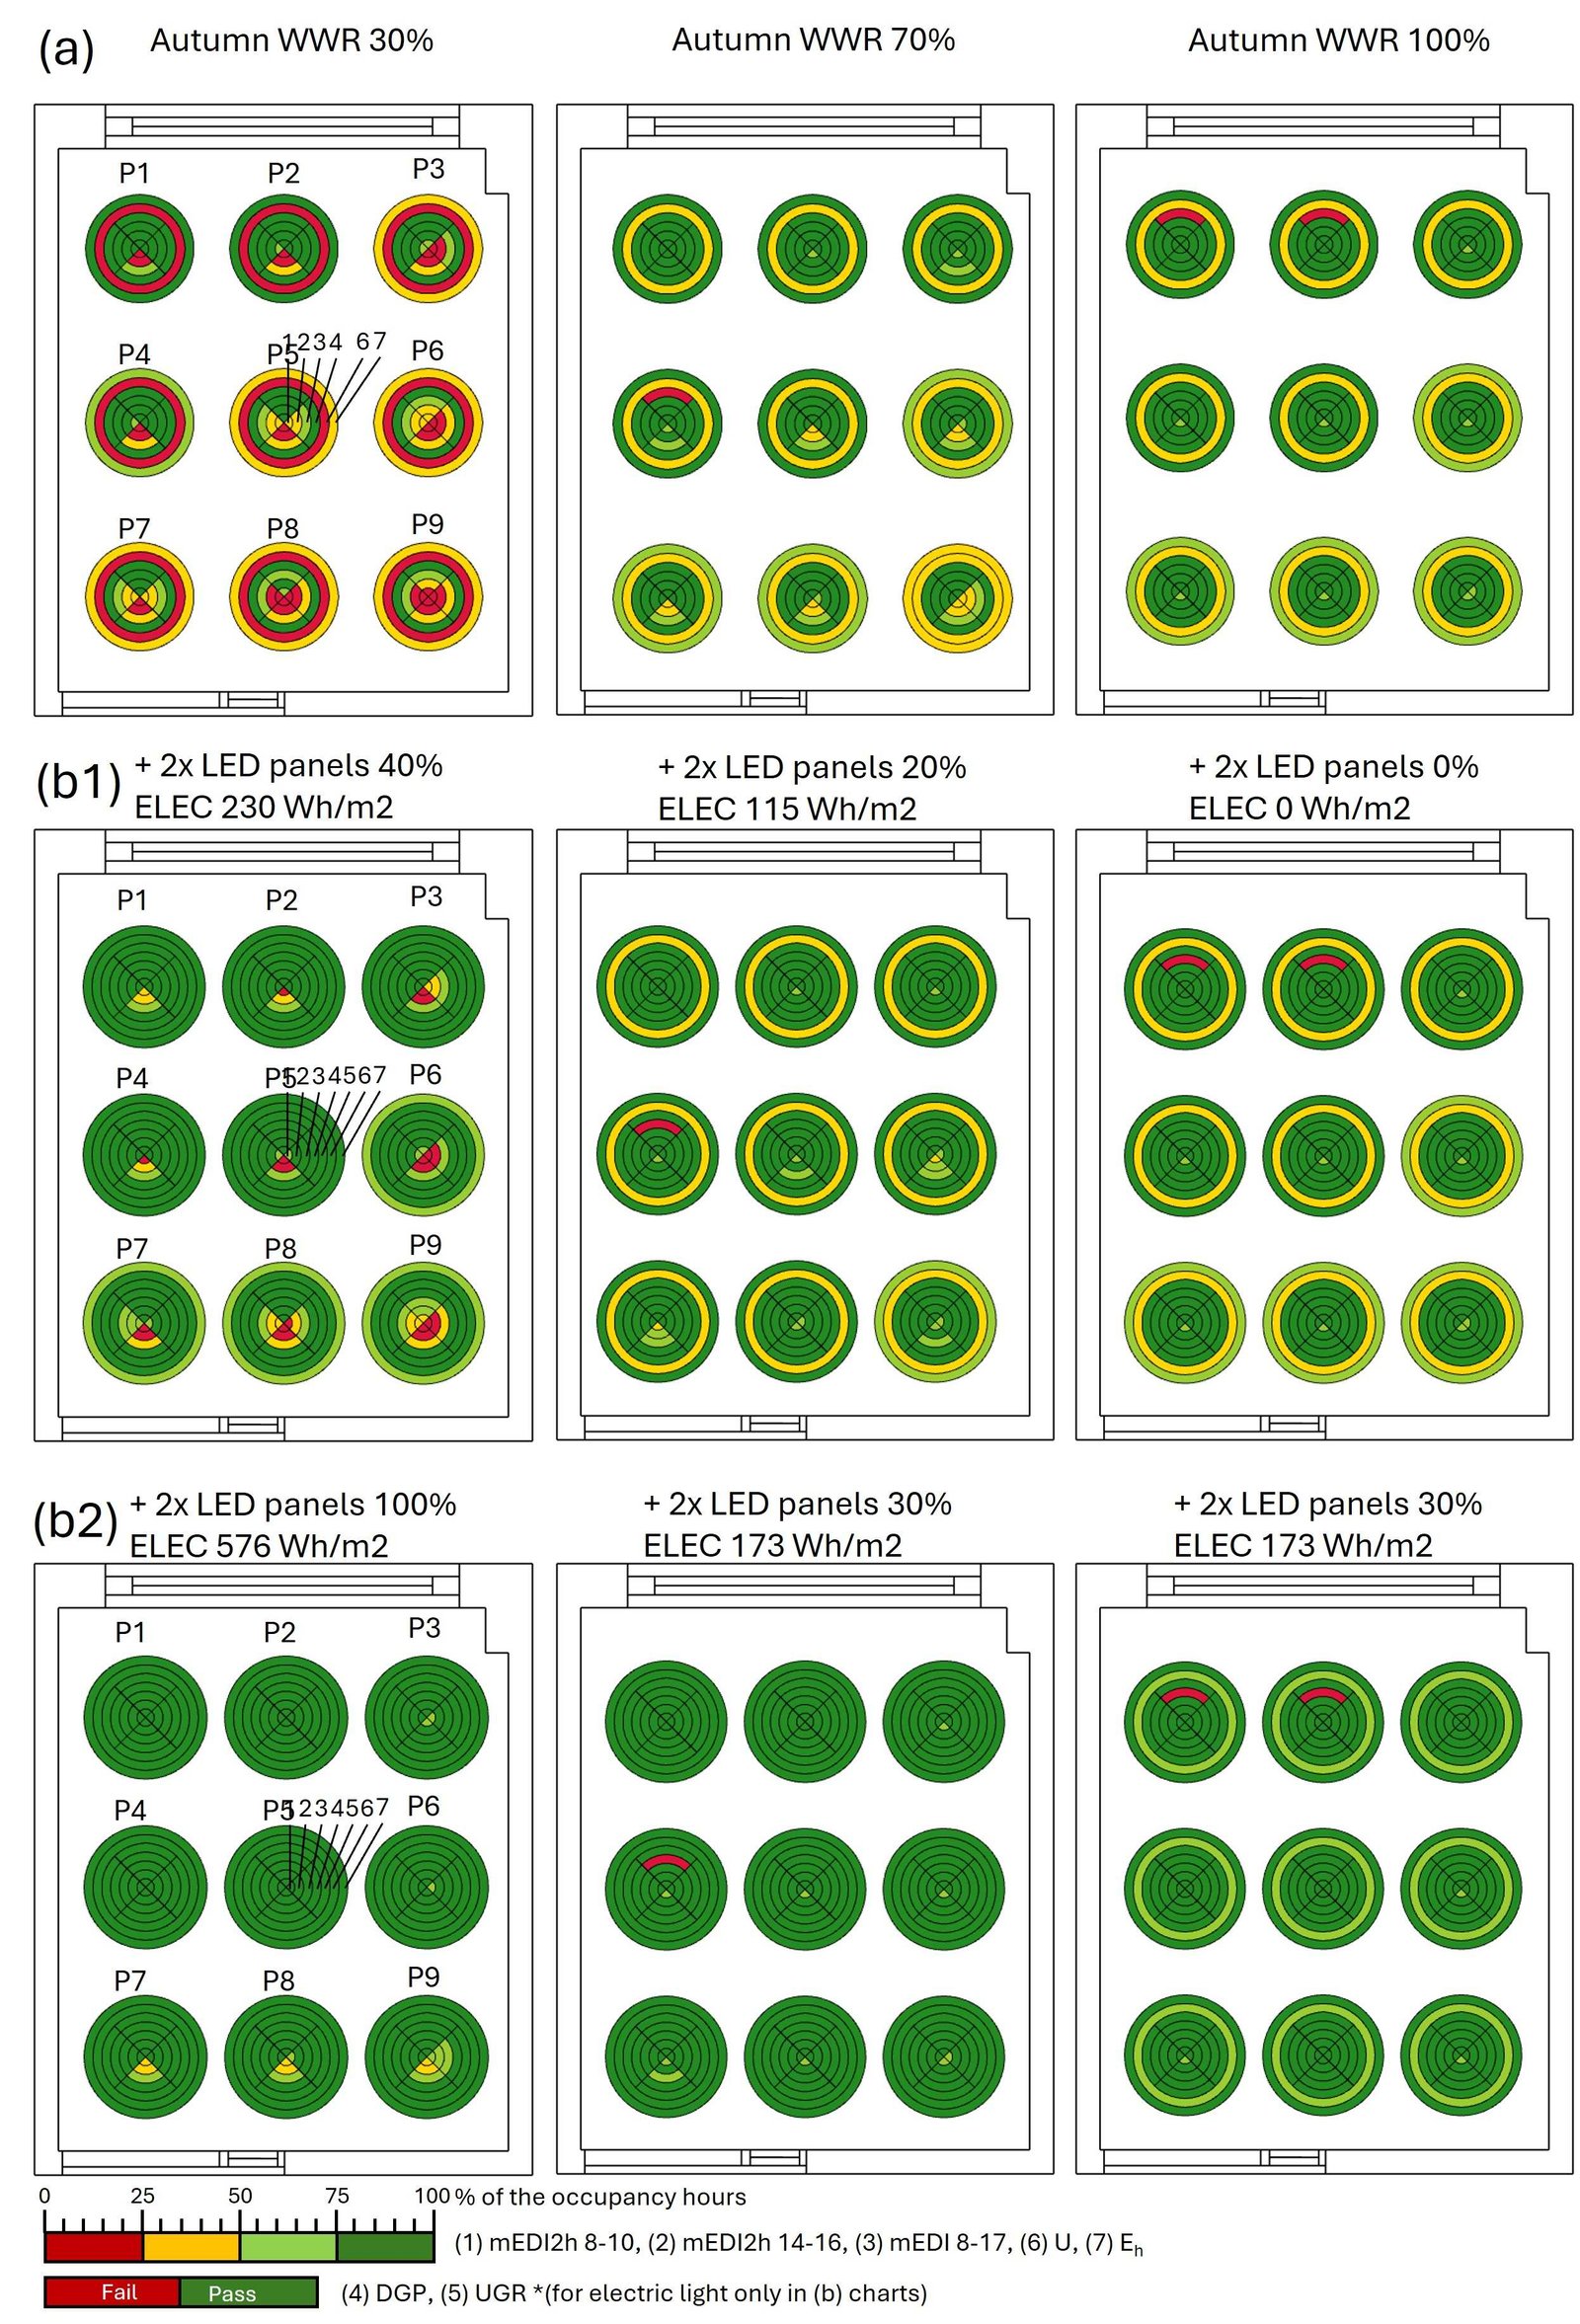
Fig. 14. Simulation results in autumn with variable WWR for (a) daylight only, (b1) daylight + variable electric light level so either visual or beyond-vision effects are achieved and (b2) for both being achieved.
At WWR 30%, all criteria were underperforming, especially deeper in the room, except DGP, which was not an issue in spring and autumn at WWR 30%. Other metrics like mEDI2h 8-10, mEDI2h 14-16 and mEDI 8-17 achieved the criteria (mEDI ≥ 250lx) in points closer to the window for façade-facing and left viewing directions. With added electric lighting of 40% in spring and autumn, all visual effects metrics like Eh, U, DGP and UGR achieved the criteria at all points and viewing directions for 50% or 75% of the occupancy time, but beyond-vision effects remain underperforming. When the electric light level is increased to 100%, all evaluation criteria are fulfilled except for the mEDI2h 8-10 rear-facing view at points 7-9 in spring and autumn and mEDI2h 14-16 in the same position for autumn.
Increasing the WWR from 30% to 70% improved all metrics at all points but not all viewing directions. In spring, mEDI2h 8-10 for rear-facing viewing direction deeper in the room and uniformity for the whole room were underperforming. In autumn, mEDI2h 8-10 and mEDI2h 14-16 for rear-facing and right viewing directions deeper in the room, DGP at point four façade-facing and U were underperforming. All criteria are achieved with added electric lighting of 10% in spring and 20% in autumn, except uniformity remains underperforming. Uniformity criterion was achieved later at an electric light level of 30%, and all sombrero plots are completely green for spring and autumn except for DGP at point four façade-facing in autumn.
At WWR 70%, there is a tipping point in the performance of the visual and beyond-vision effects. Increasing the WWR is no longer necessary to improve the light level since metrics related to light quantity like Eh and mEDI 8-17 fulfil their criteria. Instead, the focus should be on enhancing the electric lighting to achieve uniform horizontal illuminance and uniformity criterion rather than getting stronger contrast for points closer and further away from the window.
At WWR 100%, the uniformity is still underperforming, but all other criteria are achieved for 50% or 75% of the occupancy time. However, the glare (DGP) is increasing at points one and two for the façade-facing viewing direction in autumn. With no added electric lighting, beyond-vision effects criteria are achieved at this stage. The uniformity criterion is achieved for 50% of the occupancy time after adding 20% electric lighting in spring and 30% in autumn, and all sombrero plots are green.
In spring and autumn, ELEC decreased gradually with increased WWR, being the lowest (58 Wh/m²) at WWR 100% in spring and (173 Wh/m²) at WWR 100% in autumn and highest (576 Wh/m²) at WWR 30% for both spring and autumn.
3.1.4. Overall seasonal evaluation
The long-term beyond-vision effects metrics (RD and mEDI4sea) were used to compare all four seasonal days. The long-term responses build upon the history of circadian lighting evaluation criteria, meaning that mEDI 8-17 and mEDI2h 8-10 ≥ 250 lx should be fulfilled for all four seasonal days to pass mEDI4sea and RD ≥ 4.2 within five hours of continuous light exposure. The results show an improvement in RD and mEDI4sea with increased WWR (Fig. 15). However, winter daylight conditions were underperforming for mEDI 8-17 and mEDI2h 8-10 ≥ 250 lx for all WWRs. Therefore, no WWR passes mEDI4sea. The RD level did not reach the threshold of 4.2, which means a person does not get five continuous hours of daylight in winter. With added electric lighting in summer, spring, and autumn, all the circadian criteria fulfil mEDI ≥ 250 lx and RD ≥ 4.2 for all WWRs and viewing directions. Yet, electric lighting was not sufficient to pass the criteria in winter. This means that mEDI4sea ≥ 250 lx for all seasons was not achieved for any WWR and electric light levels.
Figure 15
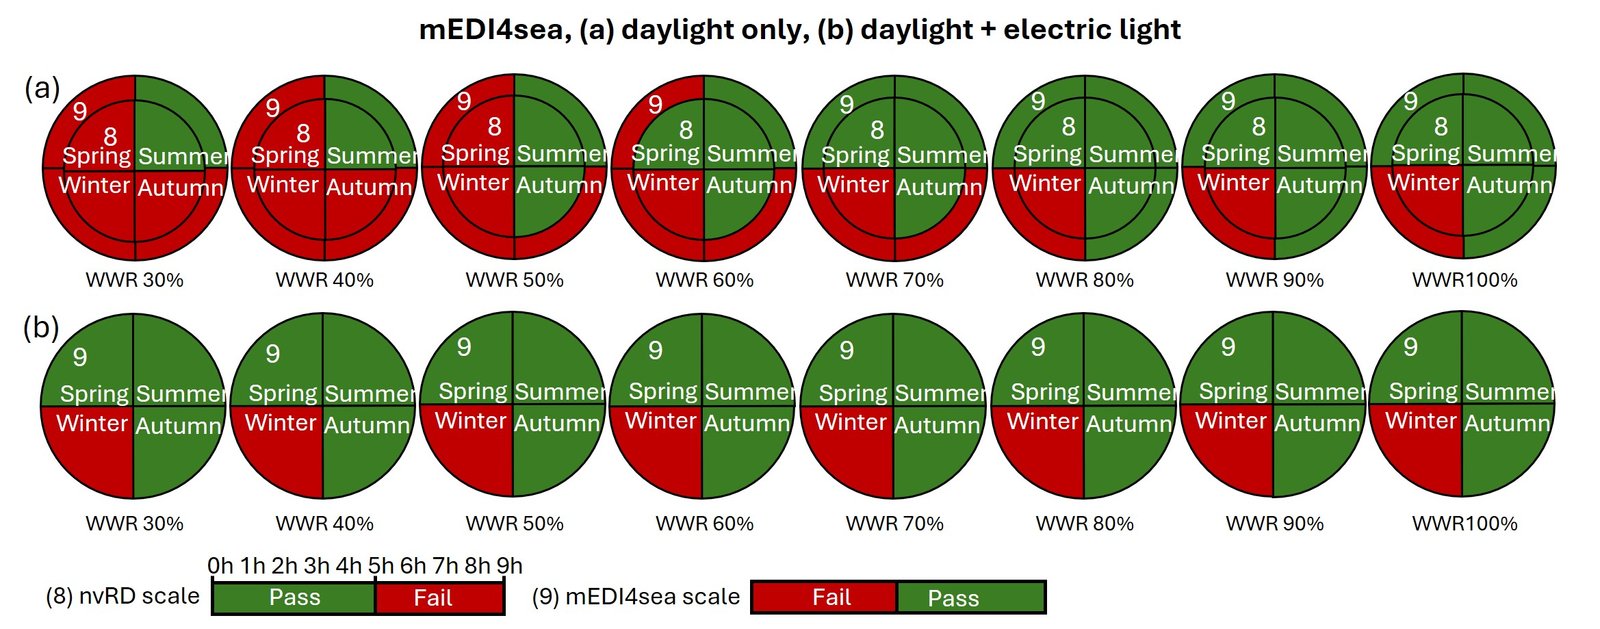
Fig. 15. Results of the (8) RD and (9) mEDI4sea metrics with variable WWR for all four seasons: (a) daylight only, and (b) daylight + electric light.
3.2. Stage 2: lighting spectrum
Since winter is the most underperforming seasonal day, further optimisation in stage two will focus on understanding each underperforming metric and how to optimise it. As described earlier, there is a tipping point at WWR 70% in spring and autumn when further increasing the WWR does not help fulfil visual experience metrics (U); therefore, the optimisation will focus on WWR 70% in winter. Figure 16(a) shows the simulation results in winter at WWR 70% for daylight only.
Figure 16
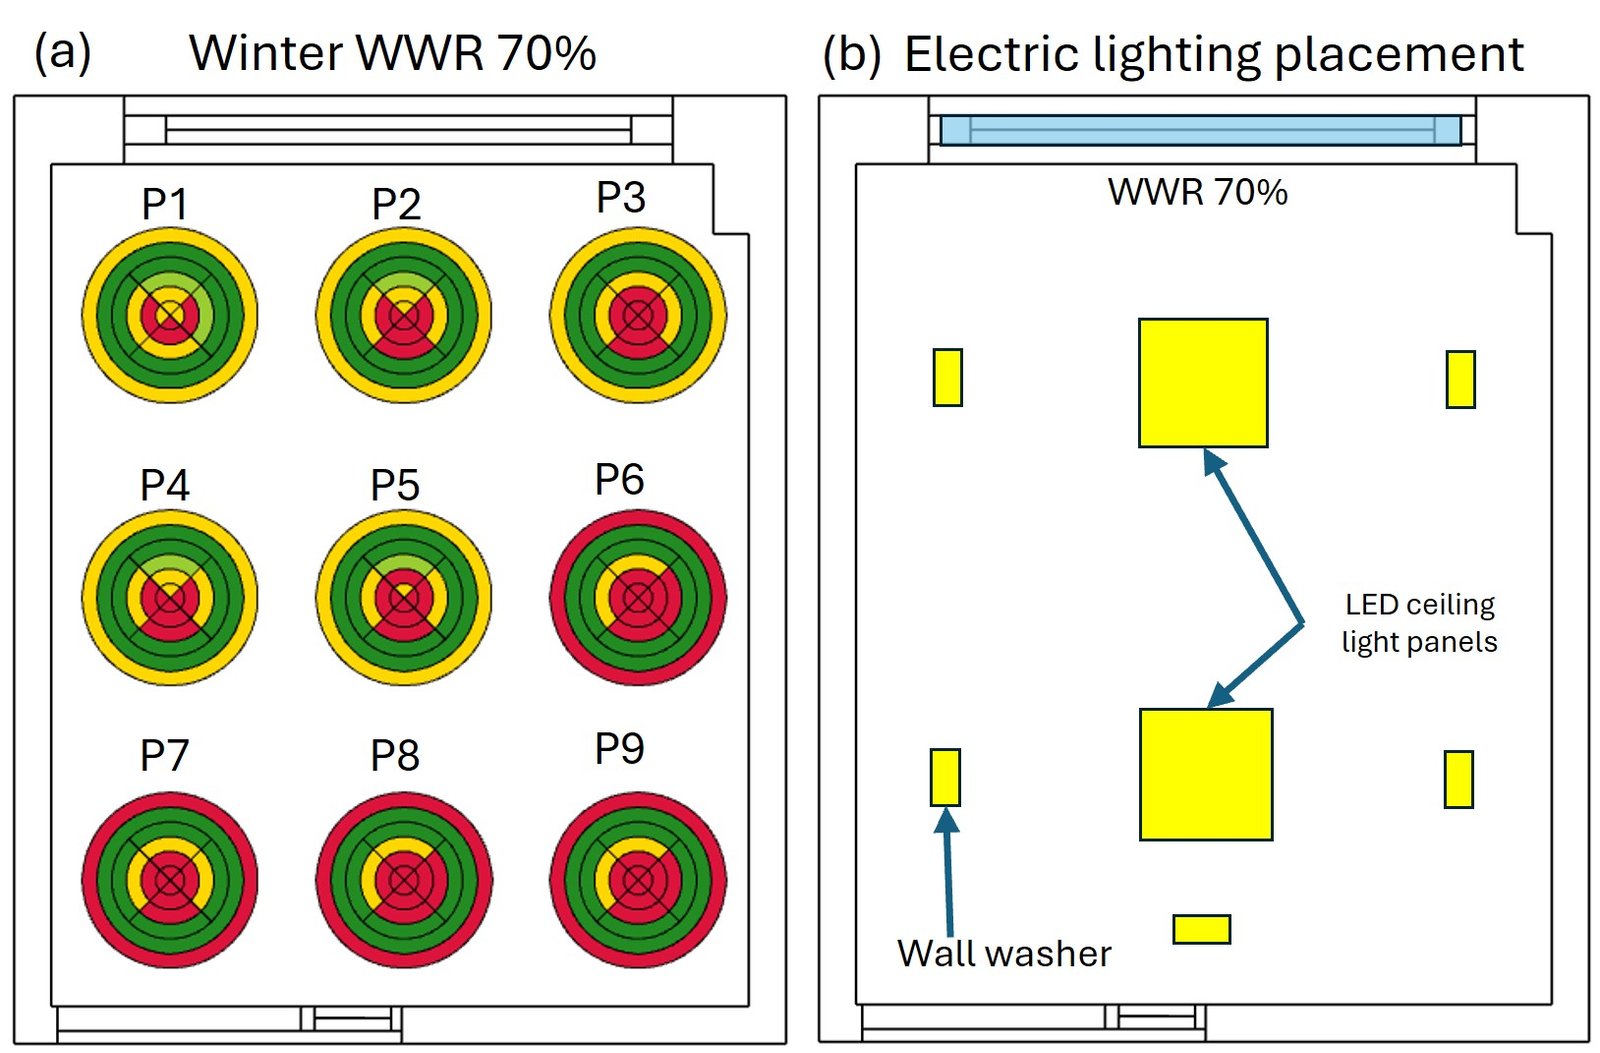
Fig. 16. (a) Winter simulation results for WWR 70% with daylight only, (b) electric lighting placement for two LED panels and five wall washers.
Starting from the first layer in the sombrero plots, mEDI2h 8-10 is mostly red except for façade-facing viewing directions in points 1, 2, 4, and 5. This indicates the need for better light distribution to help achieve higher mEDI results in other viewing directions, mostly in points 3,6,7,8,9. The second layer for mEDI2h 14-16 is mostly red at all points and viewing directions, which means higher light levels are needed during these hours. mEDI 8-17 shows a better distribution than the previous two metrics, but the light level is still insufficient to achieve the mEDI ≥ 250 lx criterion. DGP was all green at all points and viewing directions. This means no daylight glare issues but also lower daylight levels. Uniformity is also all green, ensuring good light distribution at the horizontal plane. Finally, Eh ranges from red deeper in the right corner of the room and yellow in the opposite direction. This means that the light levels are generally low.
According to the luminous and temporal light factors, the two LED panels (mDER 0.45) used before were insufficient in quantity, spectrum, and directionality to ensure the achievement of beyond-vision effects criteria at all WWRs and electric light levels. Therefore, a combination of five wall washer lights and two ceiling LED panels are used instead (Fig. 16(b) and Table 3). The aim is to have as low electric lighting energy consumption as possible while improving the underperforming criteria. Combining the different electric light sources was presented systematically by first adding low (0.45), medium (0.68) and high (1.18) mDER LED panels to daylight results. The next step is adding wall washers with low mDER (0.46) to the previous LED panels and increasing the wall washer mDER level to (0.66).
According to Fig. 17, increasing the mDER of the two LED panels from 0.45 to 1.18 improved but did not fulfil the mEDI ≥ 250 lx for the acute and circadian metrics at all points and viewing directions. A noticeable pattern in the viewing directions shows how the centrally placed two LED panels affect the light distribution. The façade-facing viewing directions at P1, P2 and P3 are still underperforming for mEDI2h 8-10 and 14-16 because much of the light transmits through the glazing instead of reflecting back. The single underperforming point facing the rear is related to the door's darker colour and lower photopic and spectral reflectance material. The combination of daylight + 2x LED panels 100% mDER 0.45 + 5x wall washer 100% mDER 0.46 improves the results significantly in all points except the ones facing the façade and the single point facing the door.
Figure 17
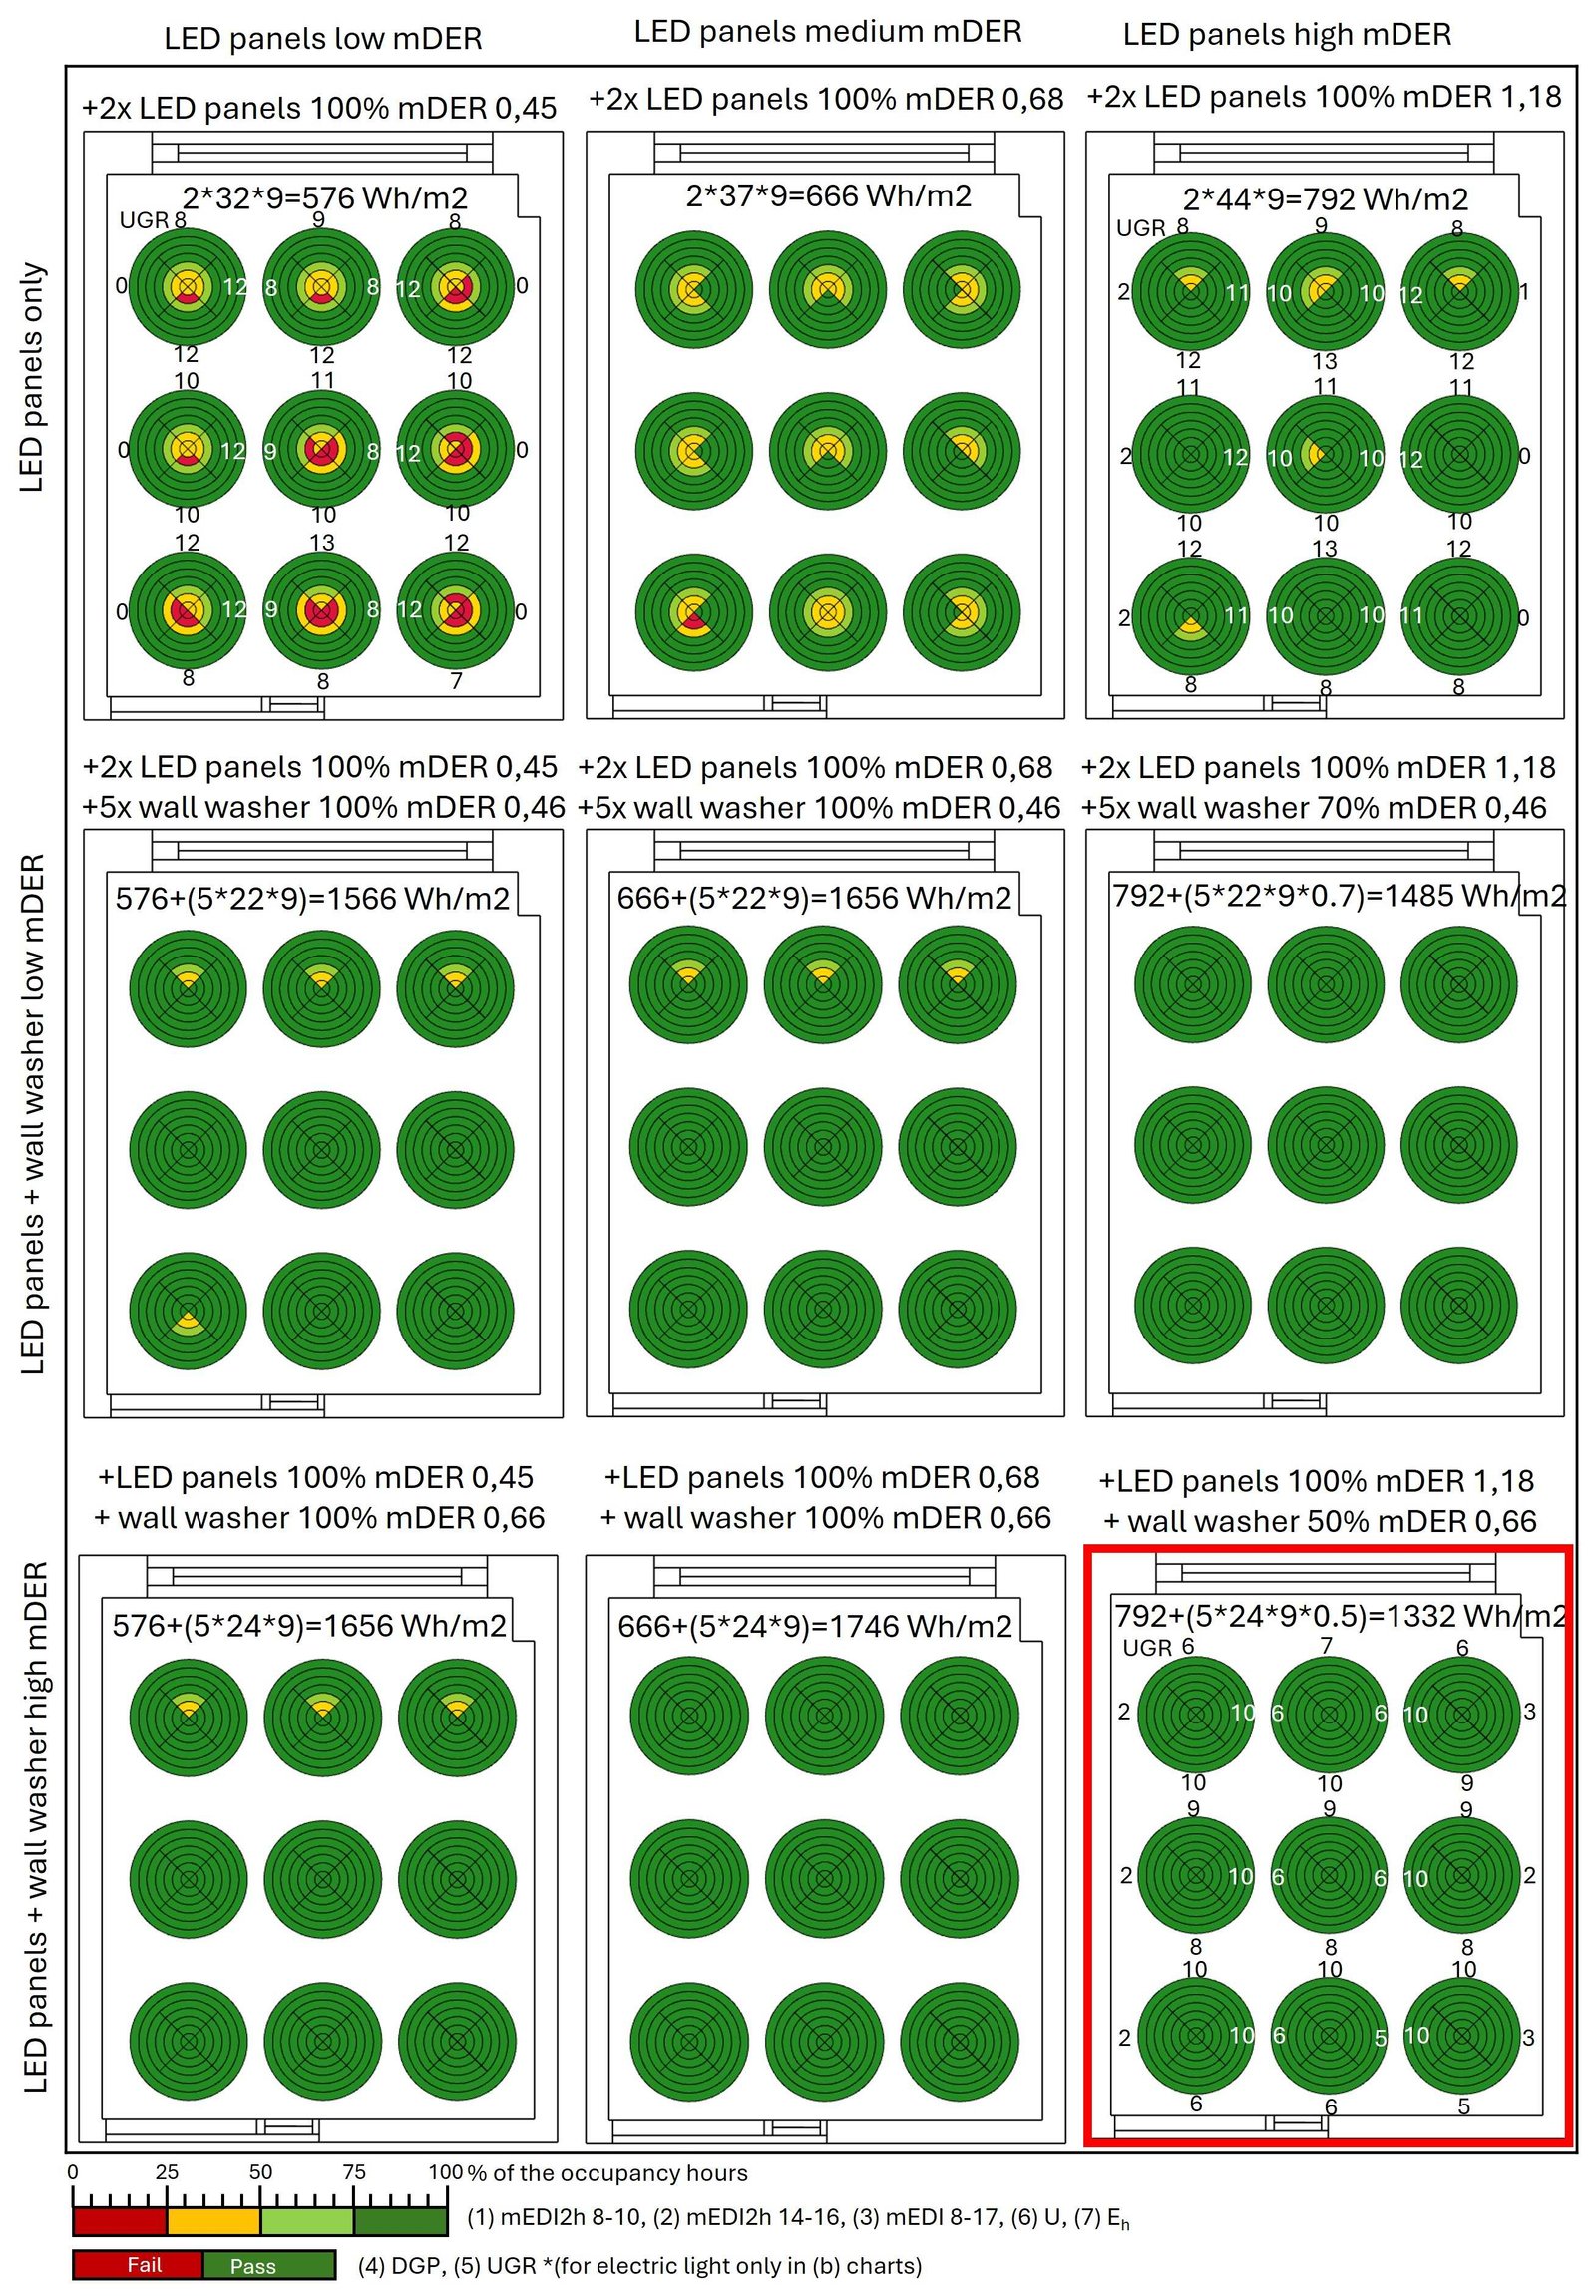
Fig. 17. Electric lighting combinations of two LED panels and five wall washers with high and low mDER. The red box shows the best-performing combination for visual and beyond-vision metrics and energy consumption.
The combination of daylight + 2x LED panels 100% mDER 1.18 + 5x wall washer 70% mDER 0.46 is the first combination that satisfies all metrics for all points and viewing directions. Second comes (2x LED panels 100% mDER 0.68 + 5x wall washer 100% mDER 0.66) and (2x LED panels 100% mDER 1.18 + 5x wall washer 50% mDER 0.66). Among these, the last one has the lowest energy consumption due to dimming the light level of the five wall washers by 50%, as it was sufficient to fulfil the criteria while saving energy. It is important to note that the LED panels were always held constant at a maximum light level of 100%, and the wall washers were being dimmed. Different combinations of dimming of both light types could lead to more efficient electric lighting in terms of performance and energy. Although the UGR criterion is met for all lighting combinations, the actual UGR values are lower for the combination of LED panels (mDER 1.18) and wall washers (mDER 0.66) compared to using LED panels alone (mDER 0.45 and 1.18). This occurs even at higher light levels, as the combination achieves better light distribution and increases background luminance, which helps reduce glare perception.
3.3. Stage 3: lighting directionality
Directionality of light has been found to play a significant role in the magnitude of beyond-vision effects in humans. As far as we know now, inferior and nasal retinal exposures induce a significantly higher response compared to the superior and temporal ones on nocturnal melatonin suppression. The results are shown in Figs. 18 and 19 first for (a) non-spatially weighted mEDI and luminance HDR images and (b) spatially weighted mEDI and HDR images where weighting factors 2.06, 1.37, 0.34 and 0.23 are applied for the upper-inner, upper-outer, lower-inner, and lower-outer, visual field areas respectively. The centre point five is chosen for the directionality analysis since it has shown variation in previous analysis and average results (not worst- or best-case scenario). Timeline results are presented for the early morning period 8:00-10:00, noon and early afternoon period 14:00-15:00 since it is dark after 15:00 in winter. The lighting combinations presented are (1) daylight only, (2) with two LED panels, light level of 100% and mDER 0.45, (3) with two LED panels, light level of 100% and mDER 1.18, and (4) with two LED panels, light level of 100% and mDER 1.18 + five wall washers, light level of 50% and mDER 0.66.
Figure 18
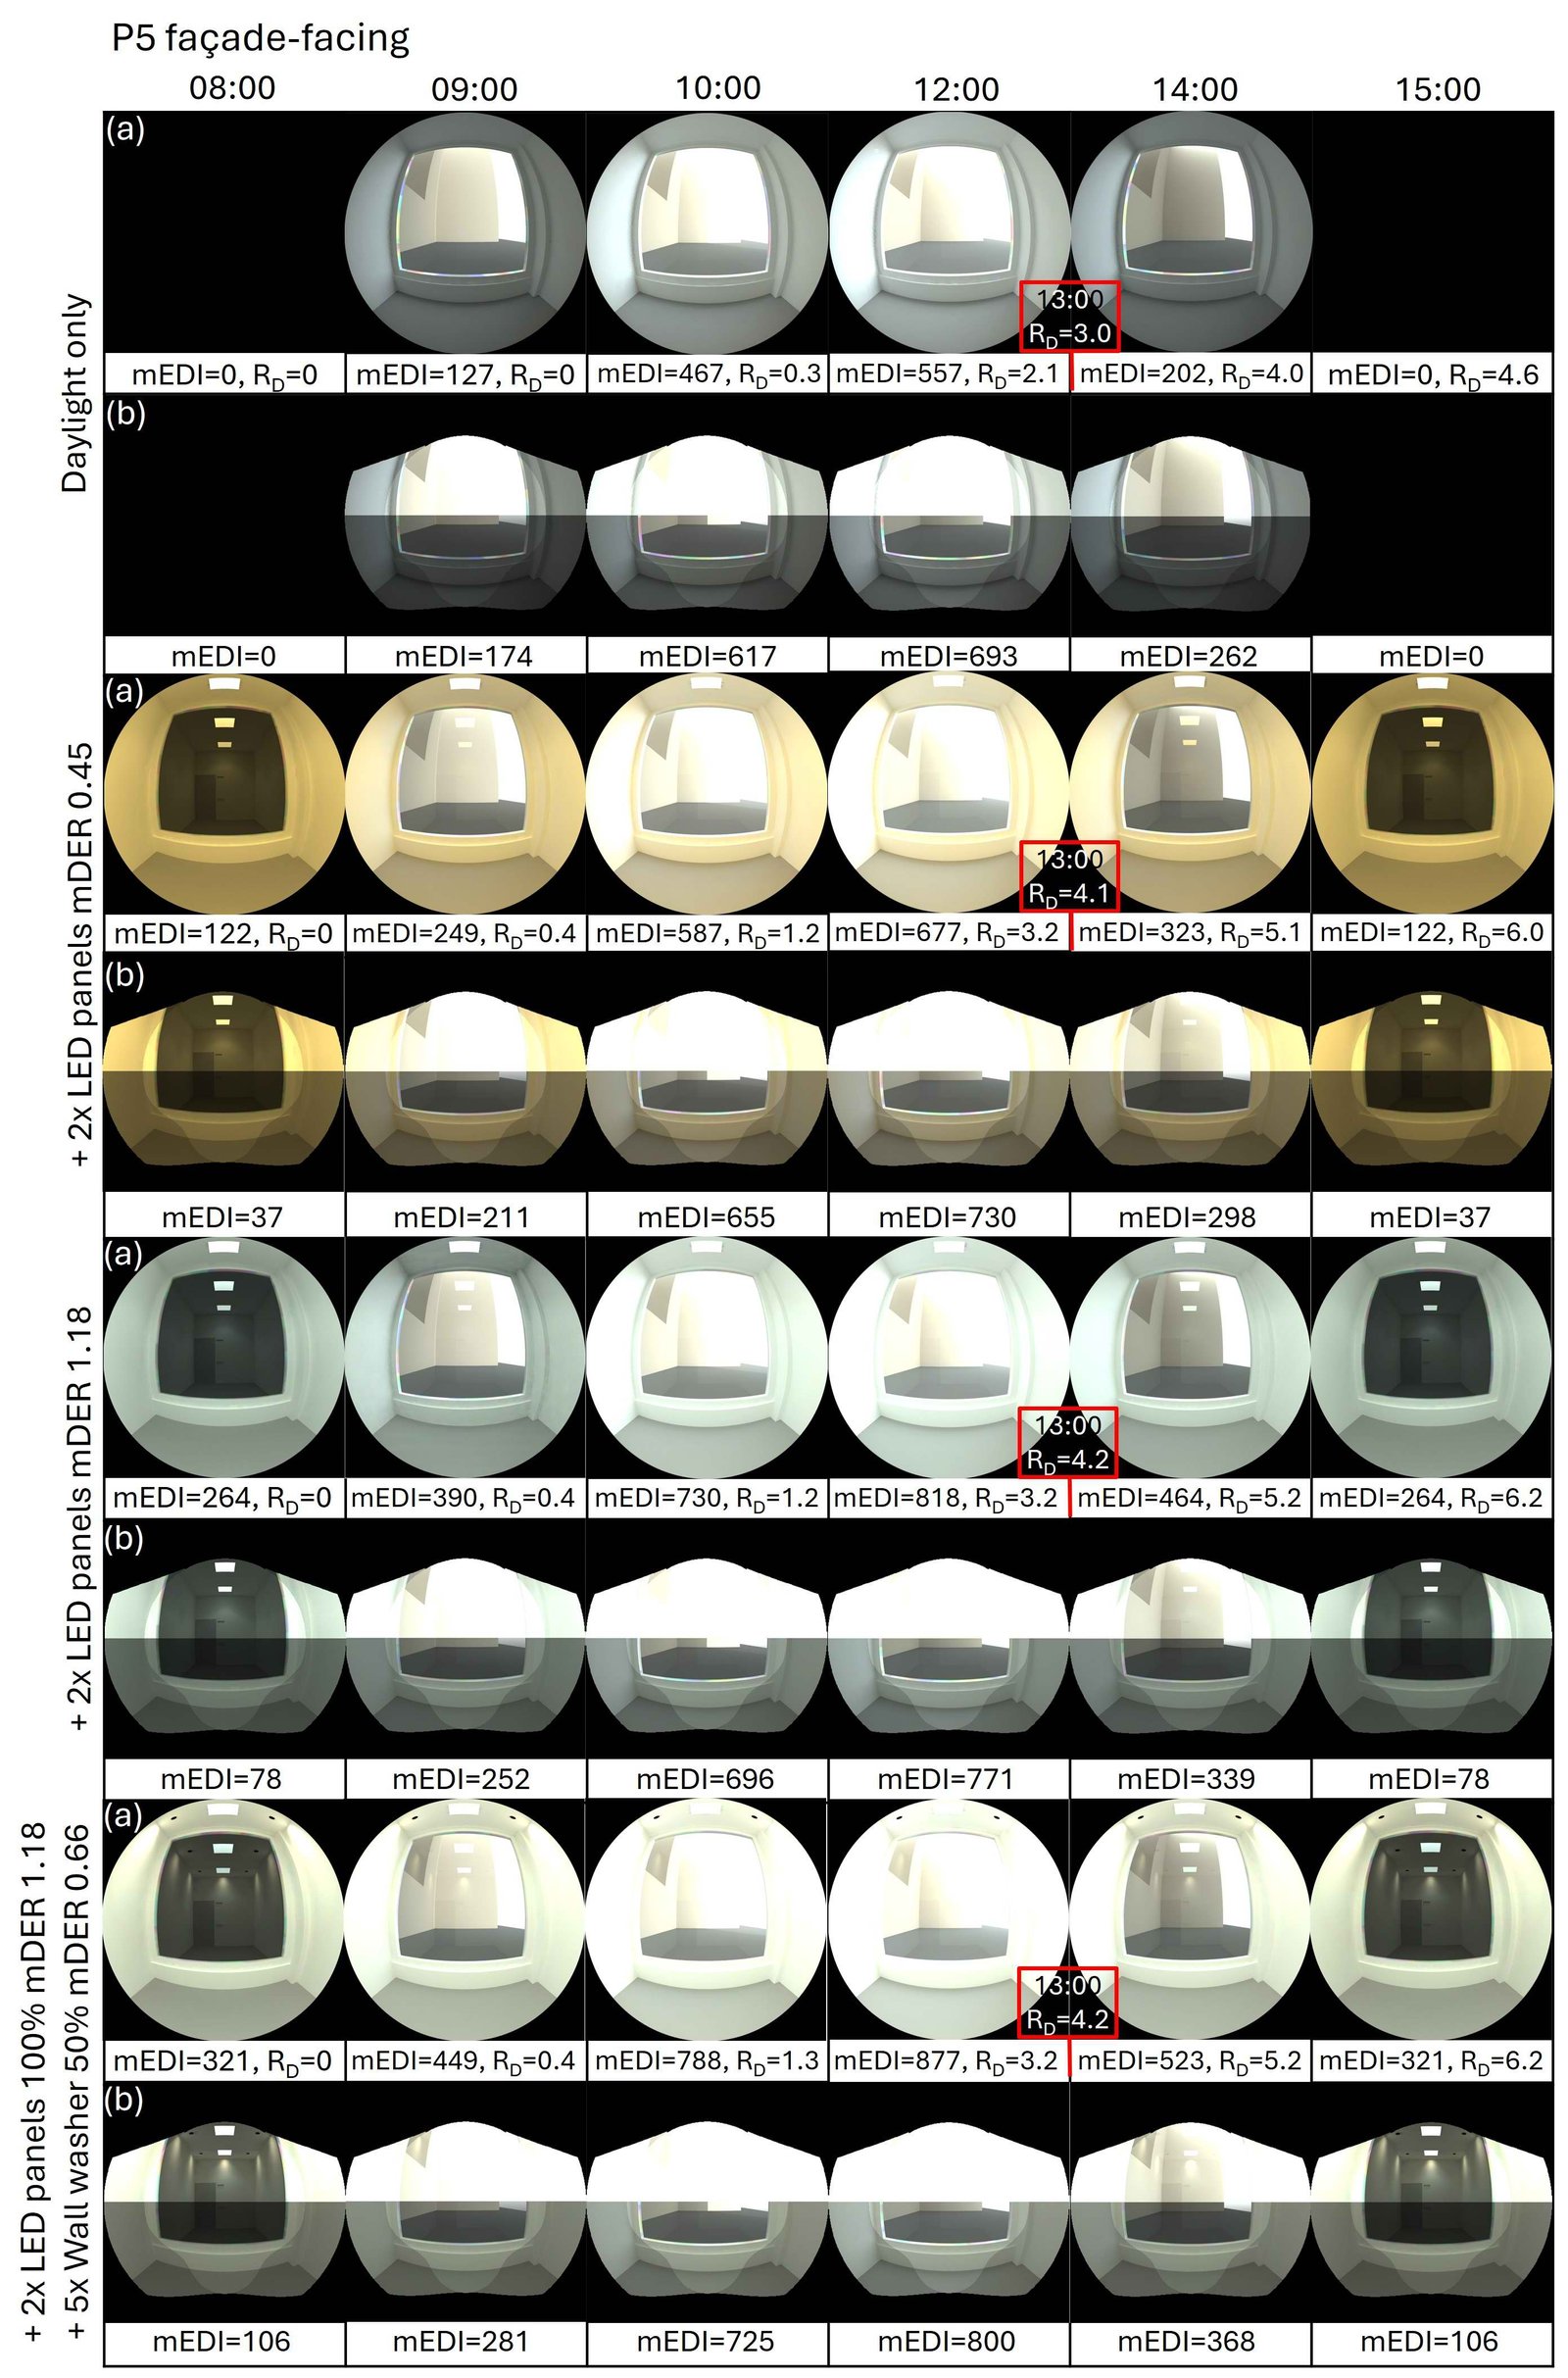
Fig. 18. Timeline mEDI and RD results at P5 facade-facing (a) non-spatially weighted and (b) spatially weighted images according to Field-Of-View filter for different lighting combinations.
Figure 19
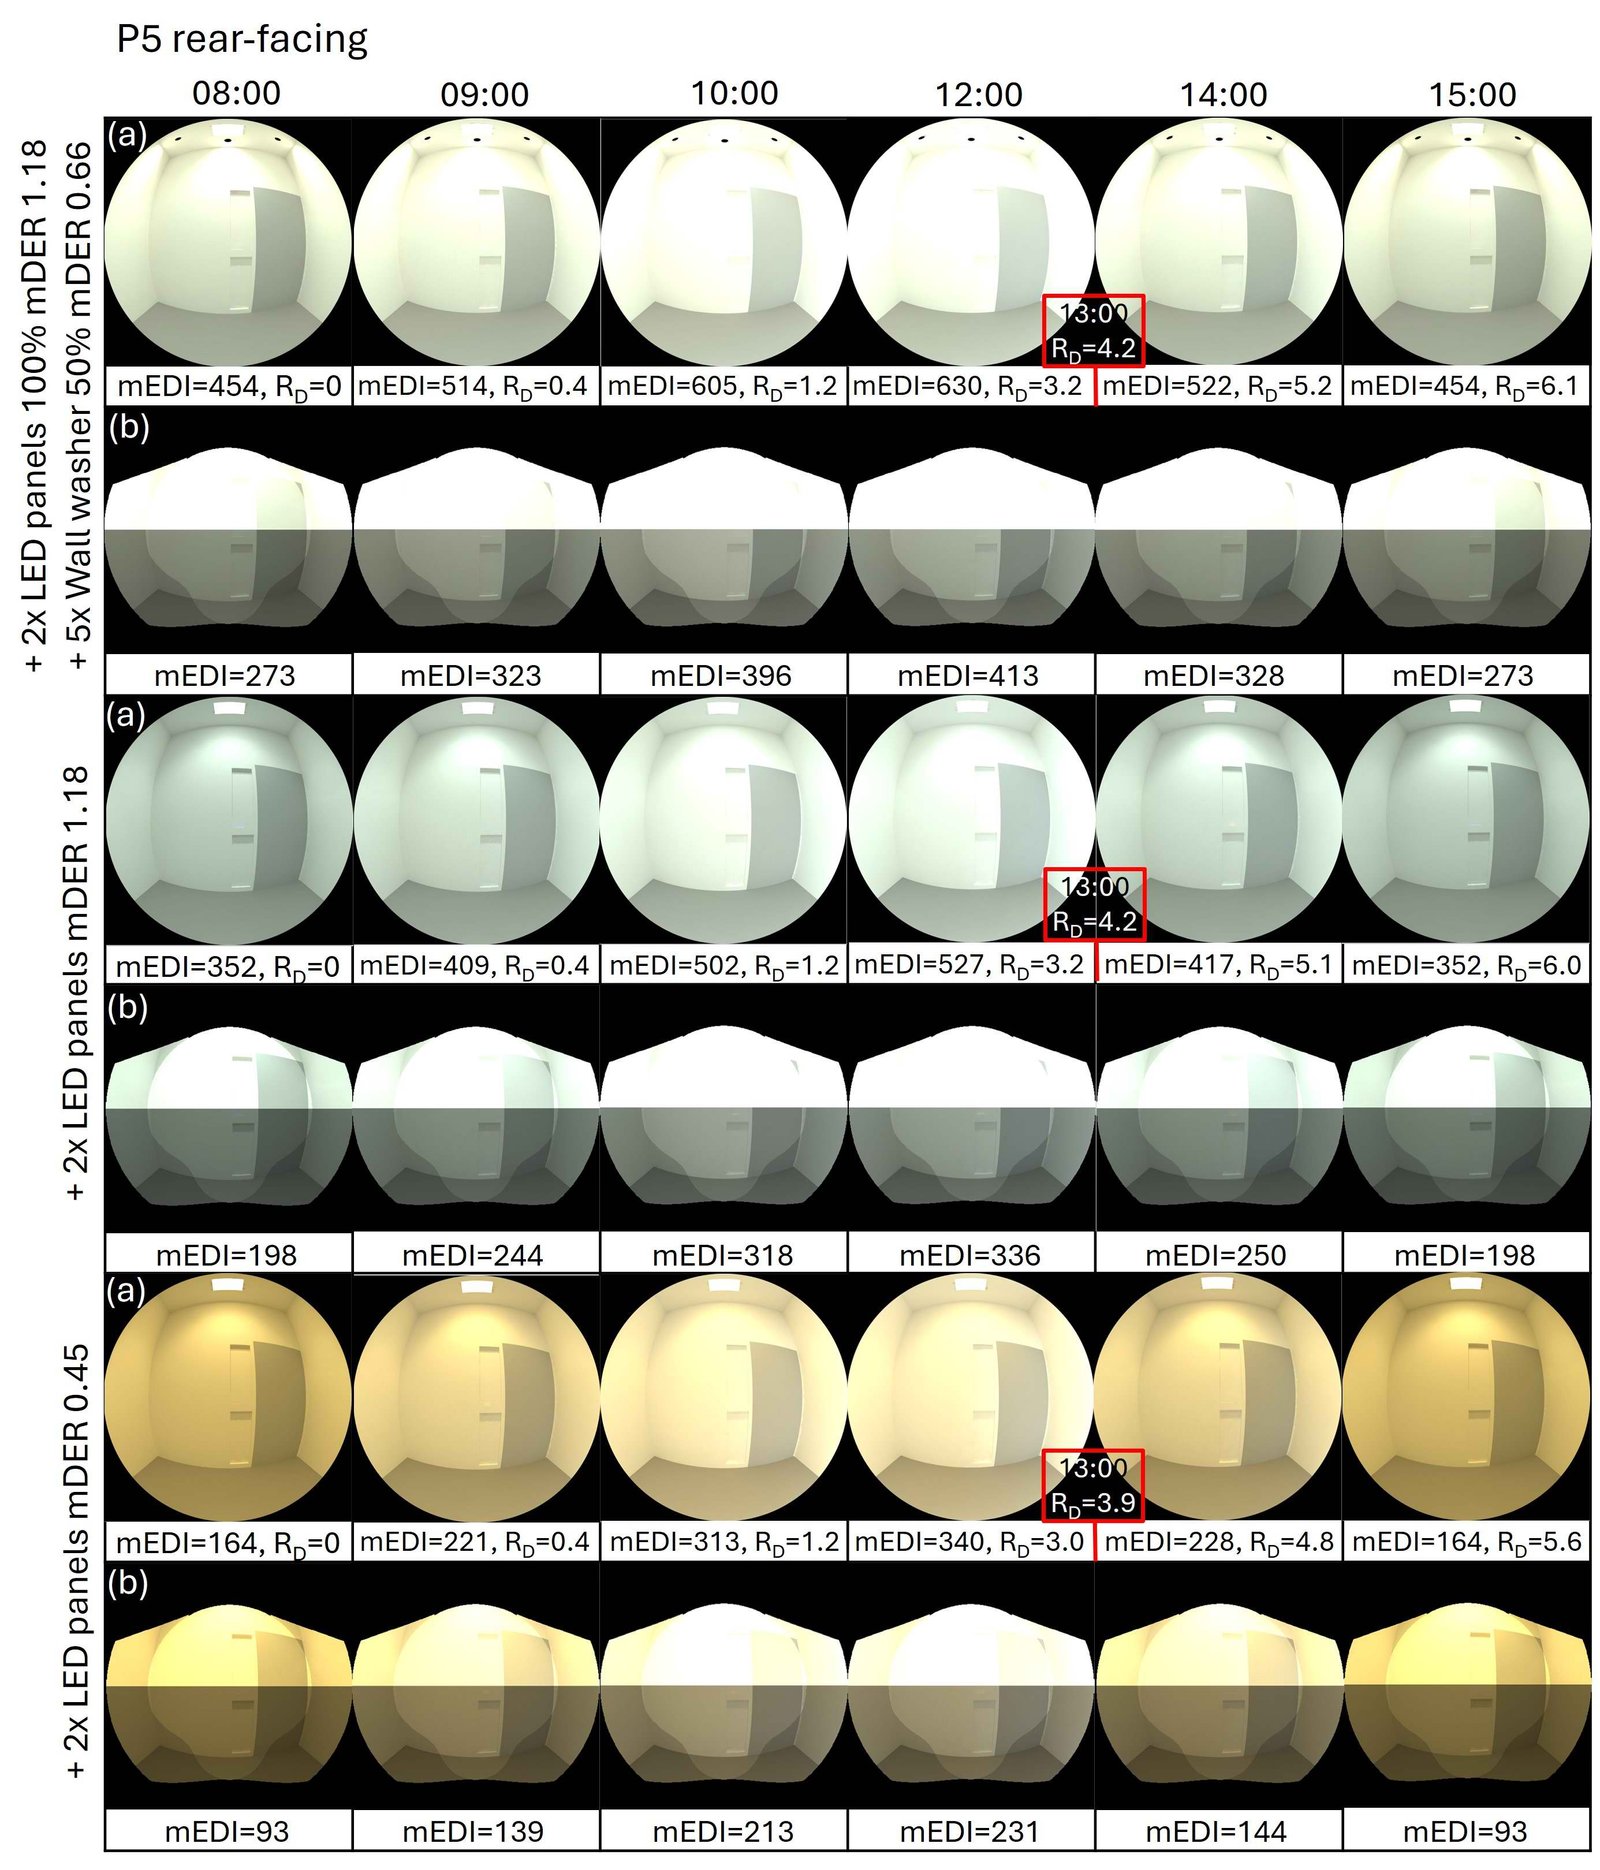
Fig. 19. Timeline mEDI and RD results at P5 rear-facing (a) non-spatially weighted and (b) spatially weighted images according to Field-Of-View filter for different lighting combinations.
Daylight results in Fig. 18 at P5 façade-facing viewing direction show lower mEDI values for non-spatially weighted images than spatially weighted. The spatially weighted results are higher by 47 lx, 153 lx, 138 lx and 61 lx for 9:00, 10:00, 12:00 and 14:00, respectively. It is also completely black at 8:00 and 15:00. Similar results are obtained by the two added LED panels (mDER 0.45) as they provide very little effect on the mEDI level. The spatially weighted results at 8:00 and 15:00 are totally dependent on electric lighting, and the dark outside view from the window lowers the mEDI level by (122-37)/122=70%. The opposite happens once there are high daylight levels at 10:00 and 12:00. mEDI increases by 11% and 7%, respectively. The mEDI2h 8-10 and 14-16 metrics are underperforming because mEDI values are under 250 lx for more than an hour for spatially and non-spatially weighted results.
When the LED panels changed to mDER 1.18, the mEDI level increased more than double (122 lx to 264 lx for non-spatially and 37 lx to 78 lx for spatially weighted results) for electric lighting only. These values can be added to the daylight results to get the rest of the hours. However, the results were simulated to get the HDR images. As the room gets brighter, especially on the walls with the higher mDER value, the bottom half appears darker for the floor and exterior ground regions, which leads to decreased spatially weighted mEDI values by 35%, 5%, 6%, and 27% for 9:00, 10:00, 12:00 and 14:00 respectively. For this light combination, the metrics mEDI2h 8-10 and 14-16 achieve 250 lx for the non-spatially weighted mEDI for the two-hour morning and early afternoon period but not for the spatially weighted mEDI.
The last lighting combination (2x LED panels 100% mDER 1.18 + 5x wall washer 50% mDER 0.66) which performed best regarding lighting spectrum, uniformity and energy consumption (previous chapter), achieved the mEDI2h 8-10 criterion for spatially and non-spatially weighted mEDI since we got one hour over 250 lx from 9:00-10:00. On the other hand, mEDI2h 14-16 criterion was not achieved for the spatially weighted mEDI because of the dark window area an insufficient surrounding luminance from 15:00 onward. In Fig. 19, the same lighting combination achieved both mEDI2h 8-10 and mEDI2h 14-16 criteria at P5 rear-facing viewing direction for spatially and non-spatially weighted images as all values where over 250 lx during the day. The lighting combination with only two LED panels added mDER 1.18 for P5 rear-facing viewing direction passes the mEDI2h 8-10 and mEDI2h 14-16 criteria for non-spatially weighted results but not the weighted ones, although they were close. For the two LED panels with mDER 0.45 these criteria are not achieved for neither spatially nor non-spatially weighted mEDI results.
The period-based simulations for the non-visual direct-response model produced cumulative response (RD) results presented in Figs. 18 and 19 as a timeline for each lighting combination and the two viewing directions at point five façade- and rear-facing. The red box shows the RD values at 13:00 between 12:00 and 14:00, representing five hours of light exposure. The daylight RD results start from 9:00 when the light exposure starts. However, RD threshold 4.2 is not achieved within five hours of light exposure at 14:00. It was achieved later between 14:00 and 15:00. The two LED panels with low mDER (0.45) do not achieve RD=4.2 within five hours of light exposure at 13:00 for the façade- and rear-facing views. It is achieved instead between 13:00 and 14:00. The two LED panels with high mDER (1.18) achieve the RD criterion within the five hours of light exposure at 13:00 for the façade- and rear-facing views and so does the lighting combination (2x LED panels 100% mDER 1.18 + 5x wall washer 50% mDER 0.66). It is noticed that the façade-facing results have slightly higher RD values than the rear-facing view.
4. Discussion
The study aimed to evaluate representative metrics integration by designing, implementing, and testing a comprehensive lighting simulation framework incorporating luminous (quantity, spectrum, directionality) and temporal (timing, duration, history) factors to meet visual and beyond-visual human lighting demands.
4.1. Lighting quantity
Lighting quantity is tested by evaluating the eight WWRs (30-100%) and electric lighting levels (0-100%). These design variables had a significant effect on light quantity. The room had good visual performance in summer, with sufficient daylight levels for a person to perform office work on the horizontal plane [114], same as in spring, autumn and winter but with added electric lighting. Increasing the WWR improved the visual experience in summer by allowing the light to penetrate deeper into the room, resulting in better light distribution and uniformity. In winter, uniformity was better due to the constant dim daylight levels. In spring and autumn, a person might perceive the lighting in the office as even and uniform when electric lighting is added. This could be beneficial in situations requiring consistent and stable illumination, such as detailed tasks or prolonged work periods to reduce visual fatigue and eye strain [115,116]. However, it could be detrimental in scenarios where more dynamic lighting is desired to mimic natural light variations and enhance mood [115].
From a visual comfort perspective, a person sitting in the room would generally experience comfortable lighting conditions with minimal glare in spring, autumn and winter due to the surrounding building and dim daylight levels. This can prevent discomfort and distraction, promoting a more pleasant and productive working environment, but may limit the outside view, which is the case in densely populated areas [116-118]. However, DGP was underperforming mainly in summer, and the other seasonal days were glare-free 95% of the occupancy time, which means no fixed shading device is needed but rather manually controlled blinds that can be closed when needed to improve comfort and productivity, especially since the façade is facing north [3,72,119]. Shen et al. [120] compared two locations/climates in their study with two office buildings, each with different WWR and shading devices for all four cardinals, to balance daylighting and solar gains and maintain human visual comfort and performance while reducing cost and energy. The study shows, similar to our results, that visual comfort and performance were maintained while ELEC was reduced with large WWR in north-facing offices. However, the heating energy consumption, which was not considered in this paper, doubled, leading to higher total energy use. A large WWR in an office can lead to substantial thermal discomfort and increased heating/cooling energy loss through the large window. This also applied to offices facing other cardinals in heating-dominated climates, while cooling-dominated climates had the opposite results. Regarding the visual comfort of electric lighting, the two ceiling-mounted LED panels (4394lm, mDER 0.45) were under the threshold for the unified glare rating index.
From a human well-being perspective, circadian responses could be regulated in summer, spring and autumn if large WWRs are chosen or with increased electric lighting. In the current situation in winter, a person will not get enough early to mid-morning daylight dose to help advance the circadian rhythm (shorten the biological day) [9,25], especially in the rear-facing direction. The daytime light exposure throughout the rest of the day was also not sufficient, delaying the melatonin phase and leading to poorer sleep quality and efficiency [47-49,89]. Depending on the season and WWR, a person might or might not receive increased indoor light levels in the early afternoon hours to cope with the post-lunch dip and boost acute responses, such as alertness and melatonin suppression, to ensure better safety, cognition, and mood [21,35,48].
In summary, increasing the electric light level and daylight openings did improve the light quantity for each season. The office room performed best in summer, fulfilling all evaluation criteria for all points and viewing directions with smaller WWR (WWR 30% with 20% electric light level or WWR 60% without electric light). In spring and autumn, increased WWR leads to better performance and reduced electric lighting energy consumption, but a larger WWR is needed to fulfil all evaluation criteria for all points and viewing directions compared to summer (WWR 40% with 90% electric light level and no WWR could achieve all criteria without electric lighting). It was worse in winter as none of the WWRs achieved all evaluation criteria, even with 100% electric lighting. This might be because of the unfavourable position of the adjacent building facing the north façade and screening the lower incident daylight (low sun angles). Since typically only one window size can be selected using traditional building technologies, no WWR could be chosen to satisfy the evaluation criteria 50% of the occupancy hours across all seasons combined, even with 100% electric lighting. Achieving the evaluation criteria for 75% of occupancy hours was even harder. While WWR 60% was sufficient to meet the criteria in summer without electric lighting, it was not adequate for winter conditions. However, increasing WWR in winter can improve light levels, although it does not fully meet the evaluation criteria.
However, in spring and autumn, a tipping point is observed where further increasing the window-to-wall ratio no longer improves light levels, as metrics related to light quantity, such as horizontal illuminance and melanopic equivalent daylight illuminance for the 8:00–17:00 period, already meet their criteria. Beyond this point, the benefits of increasing WWR diminish. The focus should instead shift to optimising electric lighting design to ensure uniform horizontal illuminance and meet uniformity criteria rather than exacerbating contrasts between areas closer to and farther from the window. Ochoa et al. [72] call the tipping point the “critical region” which defines the limit when increasing the window size does not contribute any more to daylight availability. Ochoa et al. [72] also found that the critical region starts at WWR70%, and the optimal WWR is from 50%-70% for the north-facing façade in Amsterdam, Netherlands, while measuring average annual Eh, DGI, U and total energy consumption. Jia et al. [121] suggest that the WWR for north-facing classrooms in cold regions of China should also be 60%-70% for the sDA300,50% and UDI100–2000 metrics.
Although the critical region aligns for visual and beyond-vision effects with findings from other studies, meeting visual performance criteria, such as Eh, does not guarantee the achievement of beyond-vision effects, like mEDI. Hence, the tipping point for Eh is different from that of mEDI. For instance, Eh can be satisfied at smaller WWRs that also fulfil U and DGP criteria. However, increasing the WWR to meet beyond-vision criteria may compromise visual comfort and experience due to heightened contrasts and potential glare. Furthermore, increases in WWR allow for more daylight but can also lead to higher solar heat gains, especially during warmer months. In colder seasons, the increased window size can exacerbate heat losses, leading to increased heating energy use, drafts and potential discomfort if thermal performance is not adequately addressed [122]. While the benefits of daylighting must be weighed against visual and non-visual lighting needs, thermal performance must also be considered when determining an optimal WWR. Achieving a balance between these factors goes beyond adjusting WWR alone for light quantity; it also requires additional luminous factors, such as spectral composition and directionality.
To fulfil the evaluation criteria, more electric lighting should be added by adding an extra light source or replacing the existing light sources with a higher light intensity and blue-enriched light spectrum to enhance the mEDI levels, which is tested in the next step. Changing the placement of the light source closer to the eye level or changing the directionality would also help achieve the beyond-vision criteria. If all these measures are insufficient, the office room layout should avoid placing furniture facing rear directions. This requires further optimisation as Mousavi et al. [123] did, studying the impact of furniture layout on indoor daylighting performance. Generally, the room is not deep enough to have furniture like a desk at P7, P8, and P9, and it is not very likely that a person will sit facing the rear direction, so having 100% fulfilled visual performance and beyond-vision criteria is not the most important. In this study, the evaluation criteria were strictly followed, but in reality, the limits are more flexible, and humans cannot notice if they have enough light 50% of the time. Further optimisation is needed to find the most optimal combination of window size and electric lighting for all seasons.
4.2. Lighting spectrum
The variation in the spectral data is based on the simulation under different sky conditions (clear sky in summer and overcast sky in autumn, winter and spring). However, spectral sky and sun are not controllable variables and are constant throughout the day. The material spectral reflectance/ transmittance distribution is provided for all surfaces in the model to generate accurate simulations. The primary design variable influencing the spectrum is the electric light sources. According to the luminous and temporal light factors, the two LED panels (mDER 0.45) used before were insufficient in quantity, spectrum, and directionality to ensure the achievement of beyond-vision effects criteria at all points and viewing directions. Therefore, a combination of five wall washer lights and two ceiling LED panels are used instead.
Increasing the LED panels from low mDER (0.45) or 3000K to high (1.18) or 6500K improved circadian and acute response criteria significantly at all points and viewing directions. The points directly under the LED panels were all green. However, the observed underperformance in façade-facing viewing directions at (P1, P2, P3) for mEDI2h during 8:00–10:00 and 14:00–16:00, can be attributed to the glazing’s spectral transmission properties, which allow light to pass through rather than reflect back into the space. Similarly, the single underperforming point facing the rear is influenced by the darker door material with lower photopic and spectral reflectance, reducing reflected light levels.
The next step was adding wall washers with low mDER (0.46) or 3000K to the previous LED panels and increasing the wall washer mDER level to (0.66) or 4000K. The increase in mDER of the LED panel and wall washer has shown to be one of the most influencing factors for beyond-vision effects. When both light sources switch to a higher mDER (1.18 for the LED panel and 0,66 for the wall washer), all criteria are fulfilled at a lower electric light level. The dimming of wall washers by 50% demonstrates an effective energy-saving strategy while maintaining sufficient light levels.
4.3. Lighting directionality
In this study, the directionality of light has been found to play a significant role in the magnitude of beyond-vision effects in humans. Increasing WWR and electric light melanopic content mDER separately does not guarantee achieving all criteria for all points and viewing directions. On the other hand, adding another wall washer facing an opaque surface has shown to be more effective for beyond-vision effects as the light reflects on the surface and reaches the eye. However, the spectral contribution of wall washers, combined with LED panels, enhances light distribution and increases background luminance, leading to lower UGR values, which helps reduce glare perception and improve visual comfort compared to using LED panels alone. This highlights the importance of balancing spectral power distribution and light placement to optimise both energy efficiency and lighting performance.
Another aspect of directionality is related to the direction in which the light enters the eye. Inferior and nasal retinal exposures induce a significantly higher response than the superior and temporal ones on nocturnal melatonin suppression [124]. The Field-Of-View filter by Khademagha [124], where weighting factors 2.06, 1.37, 0.34 and 0.23 are applied for the upper-inner, upper-outer, lower-inner, and lower-outer visual field areas, respectively, to image-based simulation for the same lighting combinations to understand the directionality effect on beyond-vision effects better. This analysis showed several interesting comparisons and findings related to non-spatially weighted and spatially weighted results as follows.
4.3.1. Daylight hours vs. dark hours
During daylight hours, the two added LED panels (mDER 0.45) result in higher mEDI at point five facing the façade for spatially weighted results compared to non-spatially weighted results. This is because the LED panels have minimal impact on mEDI levels inside, while the bright daylight visible through the window dominates due to its placement in the upper field of view. The window’s upper position and the high weighting factors of 2.06 and 1.37 for the upper-inner and upper-outer masks, respectively, amplify daylight's influence on the field of view. At dark hours, such as 8:00 and 15:00, mEDI depends entirely on electric lighting. For spatially weighted results, the dark outside view through the window reduces the mEDI level by 70% compared to non-spatially weighted results. This highlights the principle that the perception of light is a complex interaction between direct and reflected light, as the glazing allows light to pass through instead of reflecting it back into the space. This is clearly demonstrated in spatially weighted HDR images of the façade-facing view under dark conditions with only electric lighting.
This result underscores the importance of daylight availability in contributing to spatially weighted metrics, as the absence of sufficient luminance in the upper field of view significantly impacts beyond-vision effects. It also suggests that electric lighting alone may struggle to fully compensate for the lack of daylight, particularly in creating a balanced spatial distribution of light that aligns with beyond-visual lighting needs.
4.3.1.1. Low mDER vs. high mDER
The two LED panels with low mDER (0.45) produce mEDI results below 250 lx, causing the mEDI2h 8-10 and 14-16 metrics to underperform for both spatially and non-spatially weighted mEDI. In contrast, the LED panels with high mDER (1.18) meet the mEDI2h 8-10 and 14-16 metrics for non-spatially weighted mEDI during the two-hour morning and early afternoon periods but fail to achieve them for spatially weighted mEDI.
4.3.1.2. Without wall washer vs. with wall washer
The last lighting combination (2x LED panels at 100% mDER 1.18 + 5x wall washers at 50% mDER 0.66), when wall washers are added, achieves the mEDI2h 8-10 criterion for both spatially and non-spatially weighted mEDI when facing the façade but underperforms for the mEDI2h 14-16 criterion. This is due to the dark outside view, limited luminance from the window area, and insufficient surrounding luminance from 15:00 onward.
4.3.1.3. Façade-facing view vs. rear-facing view
The same lighting combination achieved both the mEDI2h 8-10 and mEDI2h 14-16 criteria at P5 rear-facing viewing direction for spatially and non-spatially weighted mEDI, as all values exceeded 250 lx during the day. This was due to the higher reflectance from the upper and inner regions of the wall. However, the spatially weighted results were lower than the non-weighted mEDI because of the masking regions and their associated weighting factors. The façade-facing view benefited significantly from daylight from 10:00 to 12:00, with almost double the mEDI levels compared to the rear-facing view. These findings indicate that while façade-facing views perform better during daylight hours due to direct access to brighter outdoor luminance, other viewing directions, such as the rear-facing view, provide more consistent performance during dark hours due to the reliance on reflected light within the interior. This highlights the role of surface reflectance and spatial weighting in optimising beyond-vision effects across varying conditions.
4.4. Time and Duration
Representing temporal factors like timing and duration of light exposure as a measurable metric was challenging in a graphical representation method. Achieving the mEDI2h 8-10 and 14-16 metrics for early morning and early afternoon hours is more challenging than achieving the overall mEDI 8-17 metric and the visual performance criteria. This difficulty reflects the natural distribution of daylight, with less light in the early morning and late afternoon hours, especially in winter. While the metric mEDI 8-17 partially addresses similar outcomes, its requirement of achieving 250 lx for 50% of the occupancy time between 8:00 and 17:00 does not specifically guarantee sufficient light levels in the early morning or early afternoon hours. For instance, the required light exposure occurs in winter from 9:00 to 15:00 and does not cover the full periods. Representing mEDI2h 8-10 and 14-16 as a percentage of time simplified the evaluation criteria, but this obscures the variation of daylight pattern supply, which is important to investigate in beyond-vision effects simulations.
4.5. Light History
The accumulation of light exposure over the day builds upon the history of lighting, meaning that mEDI 8-17 and mEDI2h 8-10 ≥ 250 lx should be fulfilled for all four seasonal days to pass mEDI4sea and RD ≥ 4.2 within five hours of continuous light exposure. The underperforming results for mEDI 8-17, mEDI2h 8-10 and mEDI4sea ≥ 250 lx in winter daylight conditions for all WWRs increase the office worker's sensitivity of melatonin to light suppression [52], risking a higher circadian phase delay when exposed to light in the late evening hours, while higher daylight doses in spring/summer reduce sensitivity [41]. Huiberts et al. [20] highlight that these seasonal light/response interactions are most prominent during morning sessions. The RD level did not reach the threshold of 4.2 within five continuous hours of light exposure, which means that the daylight level is less effective in having potential health benefits for humans, such as reduced subjective sleepiness and faster reaction time compared to the reference light exposure profile from Phipps-Nelson et al. [112]. However, depending on the goal of the analysis for a given set of design intentions, indicators of non-visual health potential may differ, i.e. what is healthy may change between scenarios or occupants' profile (age, chronotype, etc.) [38]. A strong day-night contrast, such as under natural conditions, has been shown to reduce interindividual variability in the phase of entrainment [125].
However, in the long-term, irregular circadian rhythms and prolonged exposure over the years to inappropriate lighting conditions, such as insufficient natural light during the day, particularly in the morning, and seasonal variation in beyond-vision responses to light, may be risk factors for both non-seasonal depression and seasonal affective disorder (SAD) [32,41,51] for the office worker in this case. When adding electric lighting with high melanopic content mDER 1.18 (6500K) or adding wall washers with mDER 0.66, the RD criterion is achieved within five hours of light exposure. This agrees with studies' suggestions that white- and blue-LED light sources can prevent SAD at lower light levels [31], with Glickman et al. [53] reporting significant antidepressant effects after 45 minutes of morning exposure to short-wavelength LED light for 3 weeks. While prior exposure to light on a scale of hours and days can reduce the sensitivity of light-induced responses, such as melatonin suppression, circadian resetting and alertness, this adaptation contributes to long-term responses by shaping the overall stability and resilience of the circadian system. Over time, these cumulative effects influence the entrainment of circadian rhythms, adaptation to seasonal changes, and long-term physiological and psychological outcomes, such as improved mood, behaviour, and productivity [15,40,41,51,52]. Essentially, the adjustments made by the phototransduction system in response to short-term light exposure lay the foundation for sustained changes that affect health and well-being across weeks, months, and even years.
4.6. Methodological Reflections
It is important to note that some beyond-vision effects criteria, such as mEDI2h 8–10, mEDI2h 14–16, and mEDI4sea, are introduced and tested in this paper for the first time and may require further exploration and validation. Several laboratory studies demonstrated that exposure to a high melanopic EDI in the early morning helps phase-advance the circadian rhythm [2,91,92] and in the early afternoon, helps counteract the post-lunch dip [105-108]. Yet, it is notable that sustained exposure to high melanopic EDI would not always result in beneficial effects during daytime working hours and is sometimes experienced as less pleasant [109-111]. Therefore, a simplified approach is followed to specify the threshold values for beyond-vision effects based on the widely adopted recommendation by Brown et al. [9] and WELL standard [84] of 250 lx as a minimum light level for the evaluation criteria.
A limitation of this study is the simulated room’s location, where shielding by an adjacent building on the north façade may have skewed results. Expanding the analysis to other façade orientations (north, south, east, west) and climates (e.g., tropical, arid, or cooling-demanding) is necessary for a more comprehensive evaluation and effective building lighting design recommendations. On a broader scale, more complex case studies involving multiple spaces (e.g., single-family homes or office floor plans) could provide insights into the combined temporal and spatial effects of light exposure, particularly when tracking occupants’ dynamic movement. Additionally, the simulated electric lighting relied on the room’s existing system, which may not represent optimal solutions for visual, beyond-visual, and energy performance as tested later in stages two and three. Applying dynamic lighting that follows a lighting demand curve for different scenarios and activities will better support beyond-vision effects by tailoring light intensity, spectrum, and timing to align with human circadian rhythms, improve visual comfort, and optimise energy efficiency [92,94,95,126,127]. Moreover, interpreting the implications of beyond-vision effects criteria requires support from applied research involving human subjects to better understand the physiological and psychological impacts [128].
The graphical evaluation method employed in this study - several initially tested, including line charts, column charts, and simple tables - ultimately relied on Sombrero plots and HDR images for presentation. The coloured Sombrero plots were selected because they effectively represented multidimensional data across four viewing directions and multiple criteria in a single, cohesive diagram. Unlike line or column charts, which required multiple graphs or axes, the Sombrero plot's circular format provided a holistic perspective, allowing for quick identification of patterns or imbalances to grasp underperforming metrics.
In general, Sombrero plots proved suitable for evaluating multiple criteria in the worst-case and best-case scenarios, winter and summer. However, with a more complex model and contradicting criteria - particularly during transitional seasons like spring and autumn - more systematic and sophisticated evaluation methods are needed, especially when additional criteria for acoustics, thermal comfort, life cycle assessment, etc, are included [129,130]. Using graphical representations alone can make it difficult to focus on each metric separately, leading to potential oversights or misunderstandings. For instance, achieving the mEDI2h 8-10 and 14-16 metrics requires more electric lighting than other metrics. This additional lighting impacts energy consumption, affecting the overall evaluation of design alternatives. By studying each metric independently, these interdependencies and how much one metric influences another can be better understood.
Defining the evaluation criteria is crucial, as it involves determining how many criteria should be fulfilled, in which order and from which aspect (visual or beyond-visual), what percentage of occupancy time and room area must meet these criteria, and how holistic the evaluation should be. Additionally, the inclusion or exclusion of potentially contradicting criteria can significantly affect how comparable the results are to other studies. For instance, Ochoa et al. [72] considered meeting two out of three visual criteria sufficient, with the critical region satisfying Eh and U but not DGI for 50% of the occupancy time at two control points. In contrast, this study treats all criteria equally important, requiring them to be met for all nine points and viewing directions, covering the entire room area across all seasonal days. This strict approach is maintained, prioritising completeness over trade-offs. To address variability in the percentage of time meeting the criteria, results are presented using a sombrero plot with different ranges marked by colour, making them comparable to both stricter and more lenient requirements.
The evaluation is kept open and holistic until clear standards for beyond-vision effects are established and trade-offs between luminous and temporal light factors are fully understood and incorporated into guidelines [63]. This approach ensures a comprehensive analysis while paving the way for future refinements in integrative lighting standards.
5. Conclusions, recommendations and further research
This study highlights the critical role of both luminous and temporal factors in designing, implementing, and testing comprehensive lighting for visual and beyond-visual human lighting demands in office environments. Simulations were performed on a single office room with nine control points with four viewing directions in the vertical plane and one horizontally, each testing eight window sizes and different electric lighting combinations of LED ceiling panels and wall washers with low and high mDER across seasonal variations, aiming to minimise electric lighting energy consumption while enhancing visual and beyond-vision performance and comfort. A necessary step to further improvement of the validation of the proposed approach will be to address the question of whether a beyond-visual analysis truly provides more information than visual quantities: an interesting further analysis would indeed be to question whether design decisions differ when beyond-visual considerations are brought in compared to simply ensuring higher lighting thresholds.
The paper found that including beyond-vision effects in the evaluation process of multiple criteria introduces significant complexity, not because of individual factors but due to the interplay between luminous and temporal aspects. Results indicated that while WWR primarily influences light quantity, achieving optimal beyond-vision effects requires careful modulation of spectral composition and spatial distribution. Notably, neither increased WWR nor higher melanopic-content electric lighting alone ensured uniform beyond-vision performance across all viewpoints. Instead, introducing a wall washer directed at an opaque surface proved more effective, enhancing background luminance, reducing glare, and improving spatial uniformity and Field-Of-View retinal light exposure. This highlighted the importance of spectral tuning and light placement, particularly in settings with prolonged exposure and limited movement, such as office environments with extended screen use.
Temporal dynamics further influenced non-visual outcomes. Achieving targeted mEDI thresholds in the early morning and early afternoon proved more challenging than fulfilling daily averages, reflecting daylight’s seasonal variability.
Building on these findings, it is recommended to use vertical mEDI measurement at eye level for standardised assessments, as it provides a consistent metric for broad lighting comparisons and compliance checks in guidelines and certifications such as WELL. However, since mEDI assumes uniform retinal sensitivity, it may underestimate or overestimate the actual impact on circadian stimulation, as it does not account for retinal sensitivity across different Field-Of-View areas.
As guidelines such as WELL and CIE increasingly prioritise human-centric lighting, integrating spatially weighted analyses into these standards is essential for a more accurate evaluation of beyond-vision effects. However, this type of analysis is more complex and costly to calculate (requires HDR images and a field of view analysis), and it is not as widely standardised as mEDI measurements. Given that the inferior and nasal retinal regions are more sensitive to melatonin suppression, the direction of light exposure is crucial for circadian stimulation. This method is particularly relevant for complex lighting environments and applications where light placement and directionality are critical to maximising circadian benefits, such as for office workers, night shift workers, truck drivers, hospital patients, or individuals with mood disorders.
These findings highlight that beyond-vision effects depend on light quantity and its spectrum, spatial distribution, and directionality. This underscores the importance of lighting design strategies that integrate these factors to balance visual and beyond-vision outcomes by ensuring the appropriate daylight and electric lighting levels, spectrum, and directionality at the right time of day. Therefore, the study recommends a combined lighting strategy for optimising integrative light effects. High-mDER LED panels and wall washers directed at opaque surfaces offer a promising strategy, enhancing spatial light distribution and uniform background luminance and reducing glare. By increasing the melanopic content and reducing the light levels, the light strategy optimises electric lighting energy consumption while maintaining visual and beyond-visual performance. This combined lighting strategy contributes to improved well-being in complex indoor environments.
In conclusion, the study recommends investigating trade-offs between spectral tuning, light type, placement, and directionality to optimise both visual and beyond-visual lighting effects. To address this complexity, future strategies should explore automated multi-objective optimisation (MOO) to identify optimal combinations of dimming levels, spectral characteristics, and directionality, thereby reducing manual adjustments while achieving better alignment of visual and beyond-visual criteria [59]. MOO provides a structured framework for considering trade-offs, identifying conflicts, and making informed decisions in various fields. By adopting MOO, lighting strategies can advance towards more efficient and human-centric designs.
APPENDIX A. Computer modelling and the initial input
The office room with the surrounding building was modelled in Autodesk Revit 2022 and exported to Rhinoceros 7 (McNeel LLC) as a DWG file. In Rhino, the different building components were assigned to layers to apply different materials to them and link them with Grasshopper plug-ins according to the previous material and electric lighting inputs. ClimateStudio 1.9 was used for the four simulation days' glare and climate-based daylight analysis (CBDM). It is an environmental performance analysis software that can optimise buildings for energy efficiency, daylight access, electric lighting performance, and visual and thermal comfort [131]. It works as a plug-in for both Rhino and Grasshopper. The developed spectral lighting simulation tool Lark v2.0 [132] validated the computer modelling and conducted all spectrum-based lighting calculations. Lark is an open-source plugin in Grasshopper with Radiance as a simulation engine. It was chosen due to its ability to generate colour information for spectral materials and spectral sky models, with the calculation based on nine channels and directly calculating metrics for beyond-vision effects. Adding colour information to the material and the sky files is important as previous studies such as [133] and [144] showed that the spectral content of light at typical interior daylight levels affects human circadian rhythms. ALFA is a commercial licensed software that can perform spectral lighting simulation. Table A1 shows a concise comparison summarizing the capabilities of ALFA and Lark.
Table A1
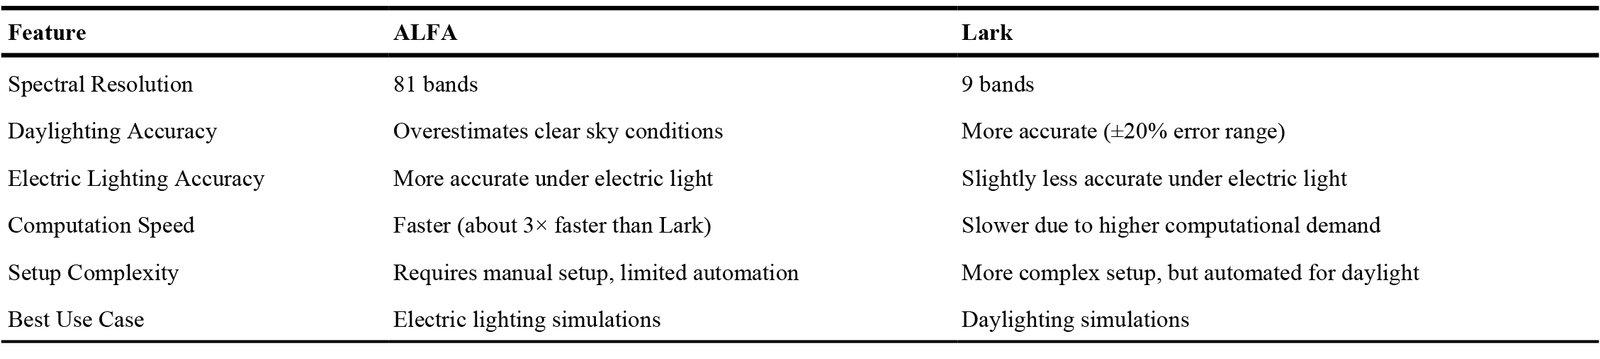
Table A1. This table clearly compares the tools strengths and simulation capabilities.
The analysis period simulation template in Lark was used to run daylight simulations for only four days in the year, which are the spring equinox (21st March), summer solstice (21st of June), autumn equinox (21st September), and winter solstice (21st December). These were chosen as representative periods of how the circadian rhythm could change during different periods throughout the year. The daylight hours for each of the four days were extracted from the EPW weather file and set as the simulation's analysis period with a one-minute interval. Later in the data analysis, only hours in the occupancy schedule of the room (08:00-17:00) were included. The electric light simulations were performed in the point-based simulation template with 10 light intensities by multiplying the IES file luminance values by the dimming factor (100% - 0%). The results are then added for each point and view direction to the daylight result based on how much electric light is needed to achieve the evaluation criteria. See Table A2 for Radiance and ClimateStudio simulation inputs and Table A3 for all the software tools used and their versions.
Table A2
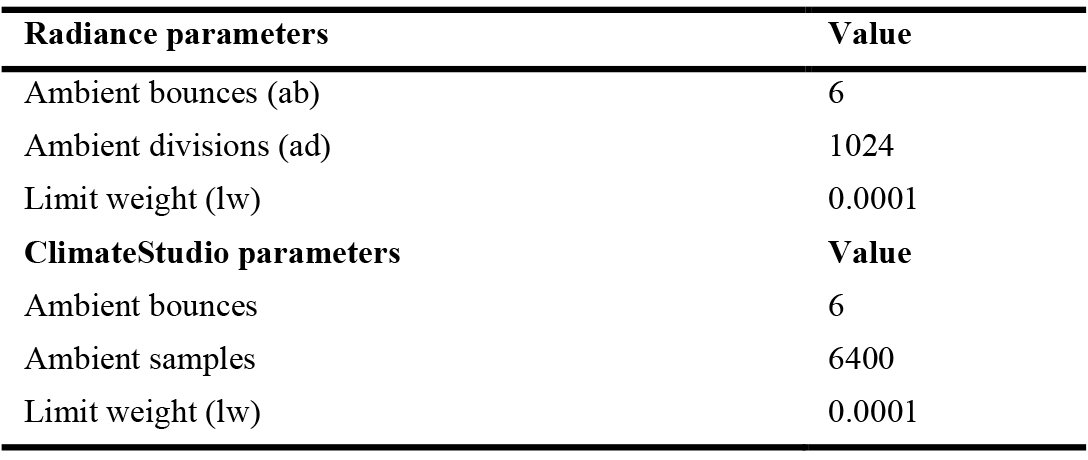
Table A2. Radiance and ClimateStudio simulation parameters.
Table A3
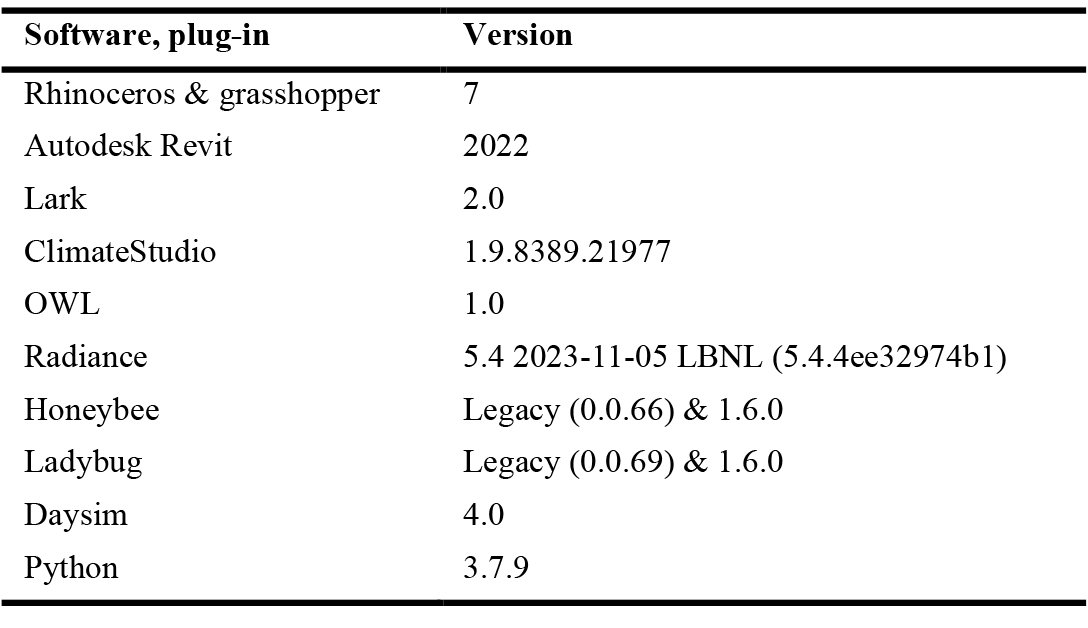
Table A3. Simulation software and plug-ins used and their versions.
The luminance distribution of the sky depends on weather and climate, and it changes during the day as the sun’s position changes. Lark requires sky spectral power distribution (SPD) to add colour information to sky models and assumes that the sun is neutral white, but first, the sky type for the four days needs to be defined from the three unified CIE sky types (Overcast sky, intermediate, and clear sky) developed by the International Commission on Illumination [135]. The sky diffuse model developed by Perez et al. [136] gives sky clearness bins as a list of values representing the transition from a totally overcast sky (1) to a clear sky (8). The clearness bins are based on the sky clearness index ( ) that was calculated for each hour of the four days using the following equation. The relevant data was extracted from the weather file using Ladybug and Honeybee for DHI and DNI and Grasshopper plug-in OWL (Occupant Wellbeing through Lighting) component "SCALE_SunPos" developed by Maskarenj et al. [137] to get the solar altitude angle (α).
Where θz is the solar zenith angle in radians, , (α: Solar altitude angle in degrees), DHI is the Diffuse horizontal irradiance (W/m2), and DNI is the Direct normal irradiance (W/m2).
k: Constant equal to 1.041 for angles in radian
The results for the sky clearness index ( ) for Jönköping weather file ranged from 1-5. The sky clearness index is then matched with their upper and lower bound bins from Table 1 in the paper by Perez et al. [136]. Both the sky clearness index and their bins are presented in Fig. A1. The clearness bins ranged from 1-7, indicating that these hours did not have 100% clear skies. The overcast sky type is decided based on the range of DHI matched with their equivalent sky clearness bins. The DHI for all four days range from 0~200 (W/m2), which means bins 1-2 are overcast sky. The bin bound separating between the intermediate and clear sky is when the DNI was more than double the DHI, which was 5, as shown in the March and June graphs. This means bins 3-4 are intermediate sky and 5-8 clear sky.
Figure A1
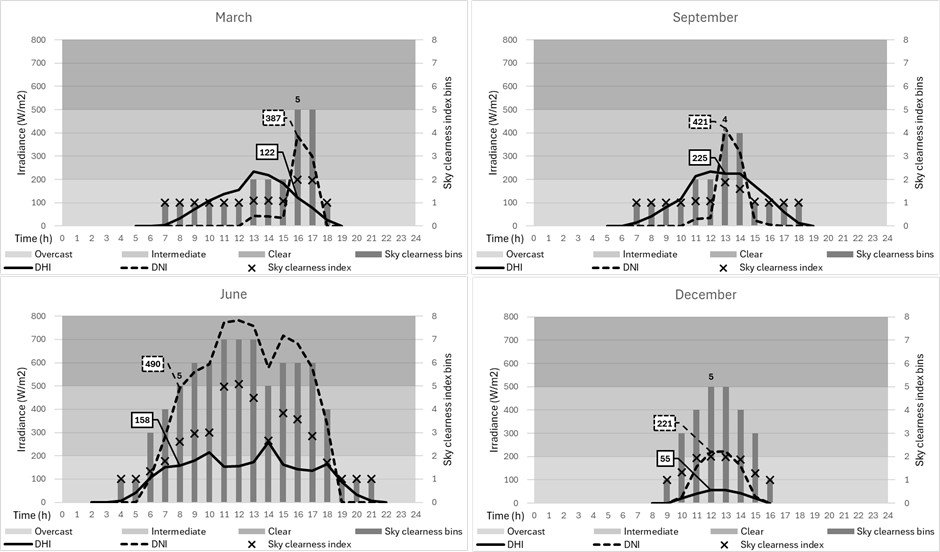
Fig. A1. The sky diffuse model shows the sky type for each simulation day.
The sky clearness index was calculated for each hour of the day, but the most dominant sky type was chosen for the whole day since Lark can only perform dynamic simulations with constant sky SPD for the whole simulation period. Although the December graph shows that the sky clearness bins reached 5, the DHI and DNI were within the range of 0~200 (W/m2). Therefore, the simulation day in December was assigned an overcast sky, which goes with the fact that winter in Sweden is mostly dark and cloudy. The days in March and September have also an overcast sky, and for summer in June, it is a clear sky according to Fig. A1.
To add spectral power distribution to the sky, a correlated colour temperature (CCT) was chosen for each sky type to characterise the colour information. Even though two sources can have the same CCT but with different spectral power distributions, it was still used as a simple method to differentiate between the different sky types. A more accurate representation of the sky CCT could only be achieved by measuring the sky SPD in real life, which was not possible due to the selection of the four seasonal days throughout the year. The overcast and clear sky values were determined by [134] as 6500K and 25000 K, respectively. The daylight spectral data are generated in 10 nm intervals from the measurements of CCT using the Excel Daylight Series Calculator [138]. The calculation method is based on the definitions of CIE standard illuminants [139]. The sky SPD is then interpolated to a 1 nm interval and normalised by the max value (Fig. A2).
Figure A2
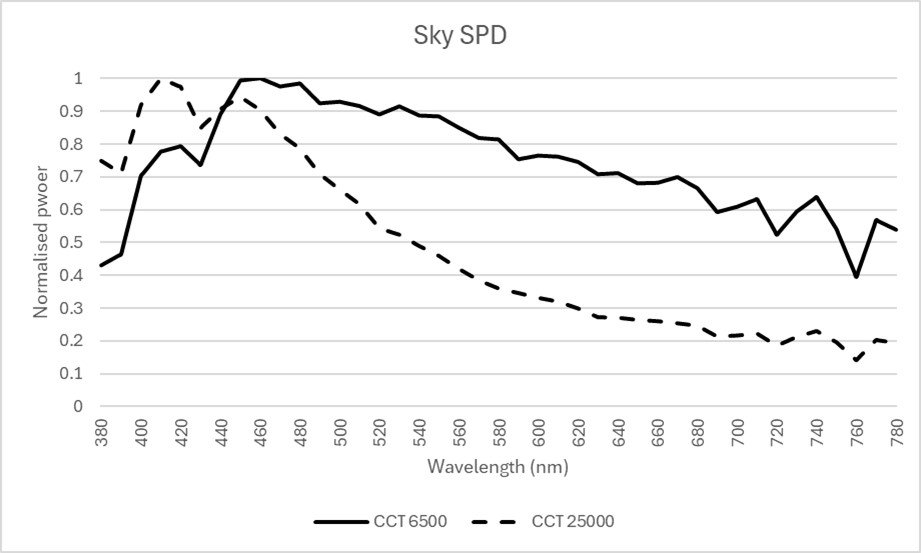
Fig. A2. Sky spectral power distribution for overcast (CCT 6500) and clear sky (CCT 25000).
APPENDIX B. Computer modelling and the initial input
The visual properties of the surfaces, like photopic reflectance (Rvis) of opaque materials, were approximately measured from 23 sampling points with a luminance/illuminance photometer (Hagner, universal photometer model S3) under electric lighting conditions to reduce any variations in light intensity that can affect the measurement (Fig. B1(a) for the sampling points). The device provides luminance and illuminance measurements with an accuracy better than ±3% for common light sources and daylight and was last calibrated in February 2022. Reflectance can be estimated by measuring the amount of light incoming to the surface (illuminance) and reflected off of the same surface (luminance). Reflectance was calculated using this formula:
Figure B1
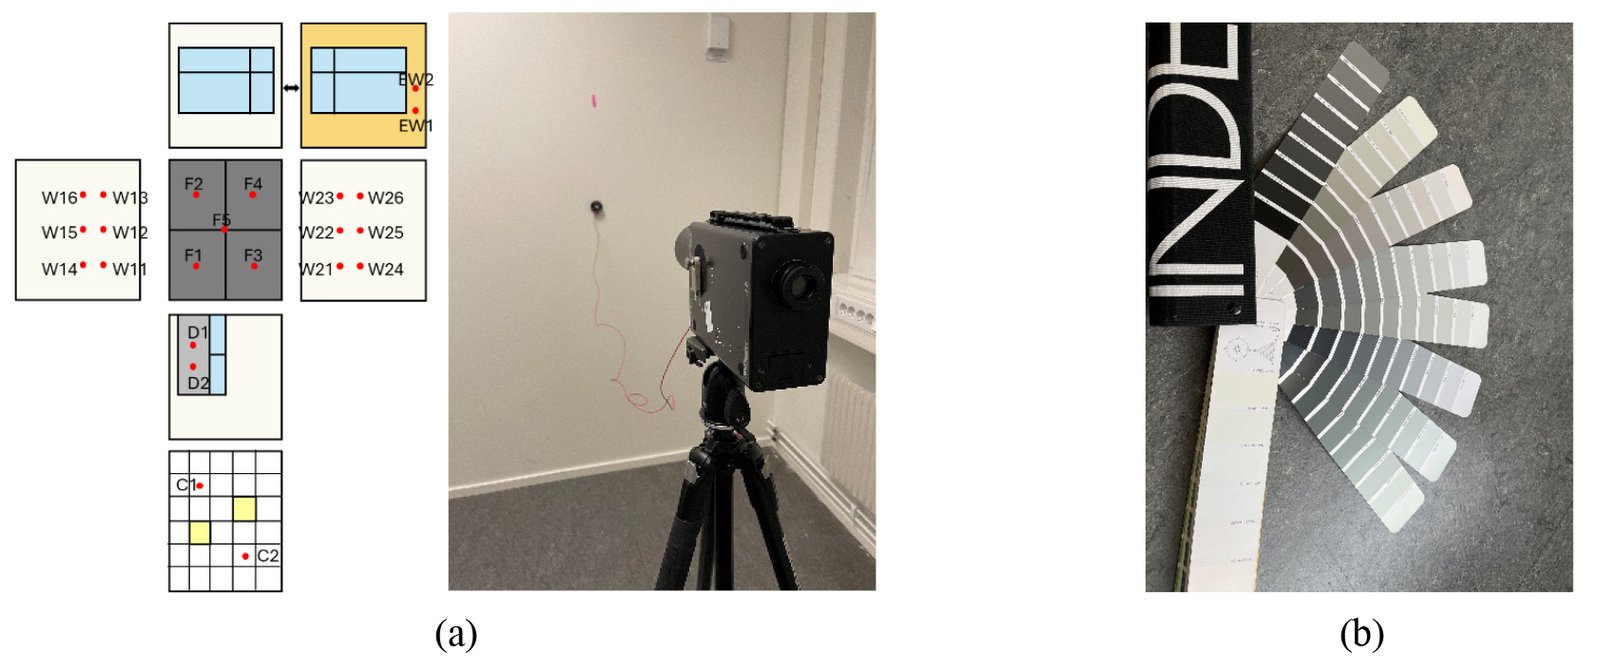
Fig. B1. Sky spectral power distribution for overcast (CCT 6500) and clear sky (CCT 25000).
The calculation of the reflectance values of the 23 sampling points is shown in Table 3. The colour of the materials was matched with the NCS colour pallet (Fig. B1(b)) according to perception-based approximation due to the lack of a spectrophotometer. The selected colours are converted to approximate RGB using the NCS colour guide website. The RGB colours or sRGB with values (0, 255) are then converted to linear RGB to get each channel reflectance because sRGB values apply a nonlinear function called gamma correction, which is 2.2, to linear RGB values so colours appear brighter and easier to distinguish in monitors [50]. The conversion formula is:
LinearRGB = ((R, G, B)/256)2.2.
The converted linear RGB colour reflectance is also shown in Table B1. Spectral reflectance distribution (SRD), material roughness and specularity were obtained using the calculated surface colour information and reflectance in a spectral materials database by matching to the closest material [141] (Table B2 for selected materials). All material properties are used as input for spectral calculation in Lark v2.0.
Table B1
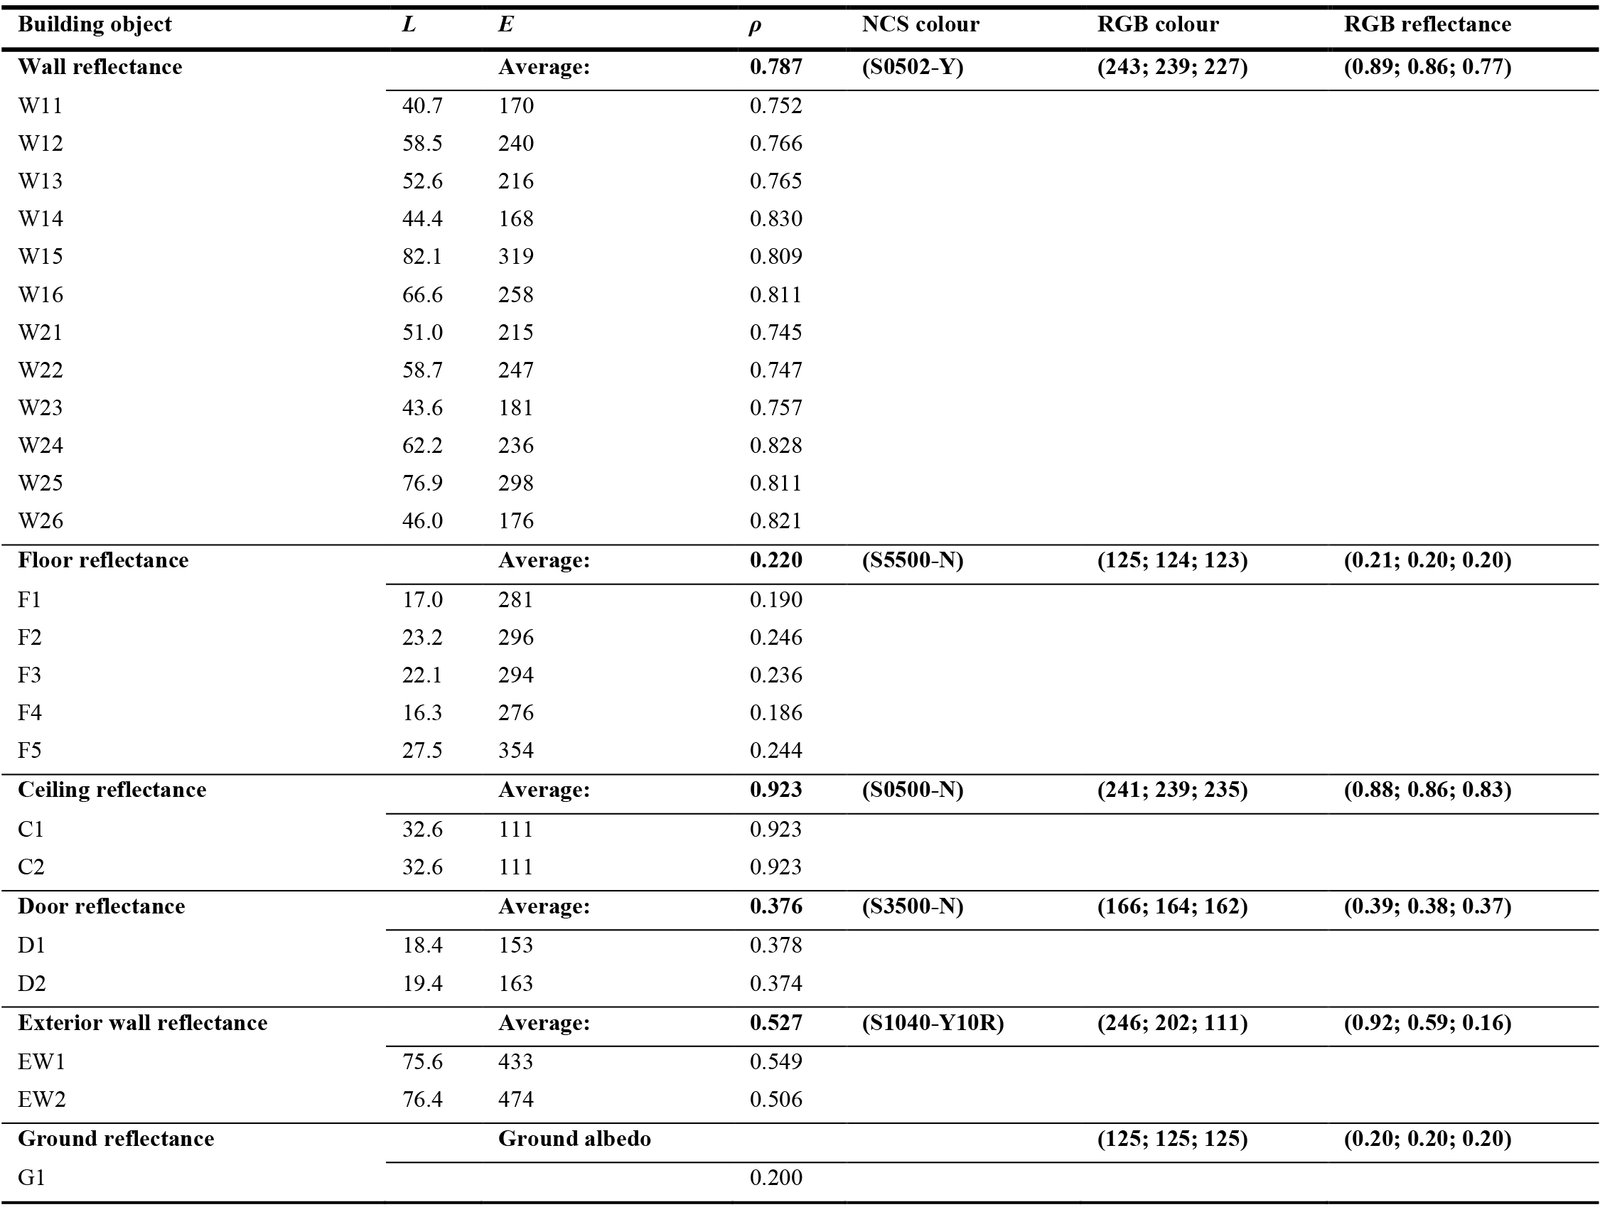
Table B1. Calculated reflectance values from 23 sampling points and their NCS and RGB colour and reflectance.
Table B2
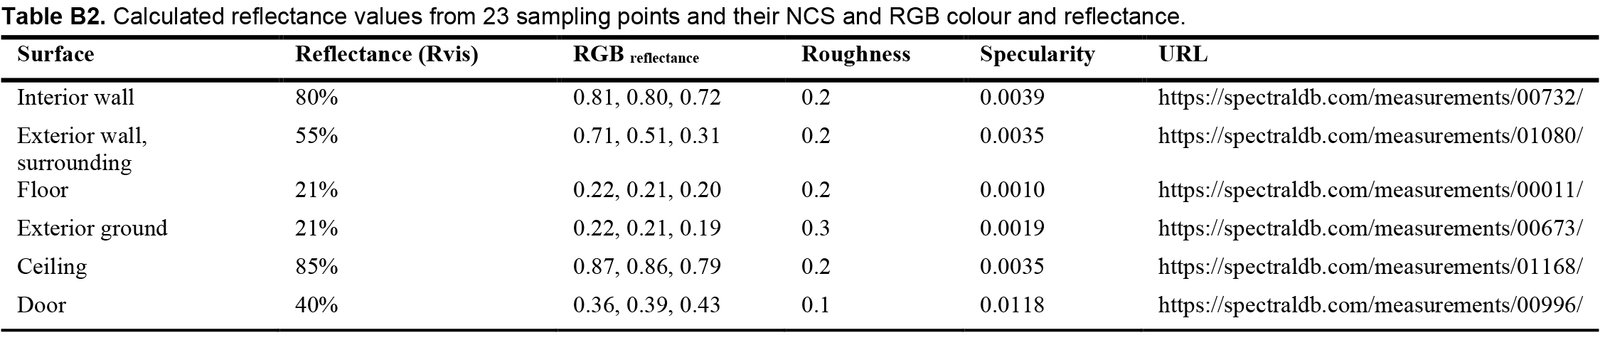
Table B2. Calculated reflectance values from 23 sampling points and their NCS and RGB colour and reflectance.
Due to its age, data from the window system could not be obtained via the manufacturer; hence, the glazing’s photopic transmittance (Tvis) and spectral transmittance distribution (STD) were estimated by measuring the SPD using a spectrometer (UPRtek MK350S_Premium) in a black box. The spectral measurements have a wavelength precision of ±1 nm and a bandwidth resolution of approximately 9 nm, and the device was last calibrated in March 2023. First, the SPD was measured from a light source without the window, and then the window was placed in between the light source and the spectrometer (Fig. B2). Another measurement was done to calculate how much light is transmitted through the glazing at each wavelength by dividing the first SPD measurement by the second. The resulting glazing material is shown in Table B3.
Figure B2
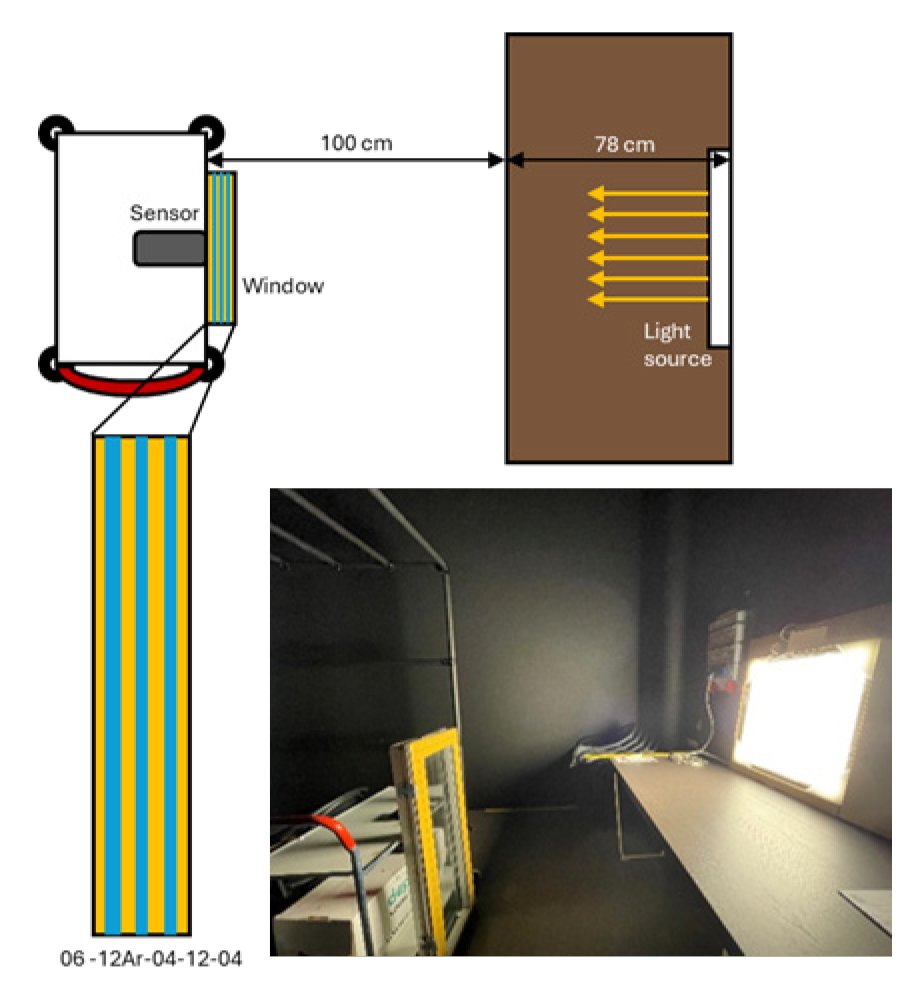
Fig. B2. The model shows how the transmittance and spectral transmittance of the widow glazing were measured.
Table B3

Table B3. Glazing material properties.
APPENDIX C. Calibration and validation of the simulation model
With the computer model built and the initial input parameters collected, the next step was to calibrate the computer model for photometric simulation. Two control points were placed in the real room with a total of 11 sensors placed facing the five view directions (north, south, east, west, top) and one sensor point at the rooftop of the Jönköping University building to collect sky illuminance. The sensors used are the HOBO Pendant MX Temperature/Light Data Logger, which can log illuminance data. The illuminance measurement accuracy is ±10%, typical for direct sunlight. One spectrometer (UPRtek MK350S_Premium) was placed at point 1 facing the window (north view direction) (Fig. C1). The HOBO sensors were calibrated compared to 2 Hagner lux meters in both electric (indoor) and daylight (outdoor) settings (the manufacturer calibrated the Hagner (model EC 1) meters in 2022/02 and 2019/02). The lux meter has an accuracy better than ±3%. The electric light calibration was done under 4 steps light level increment (220, 590, 960 1430 lx). The resulting combined calibration factor for indoor and outdoor is ~1.33.
Figure C1
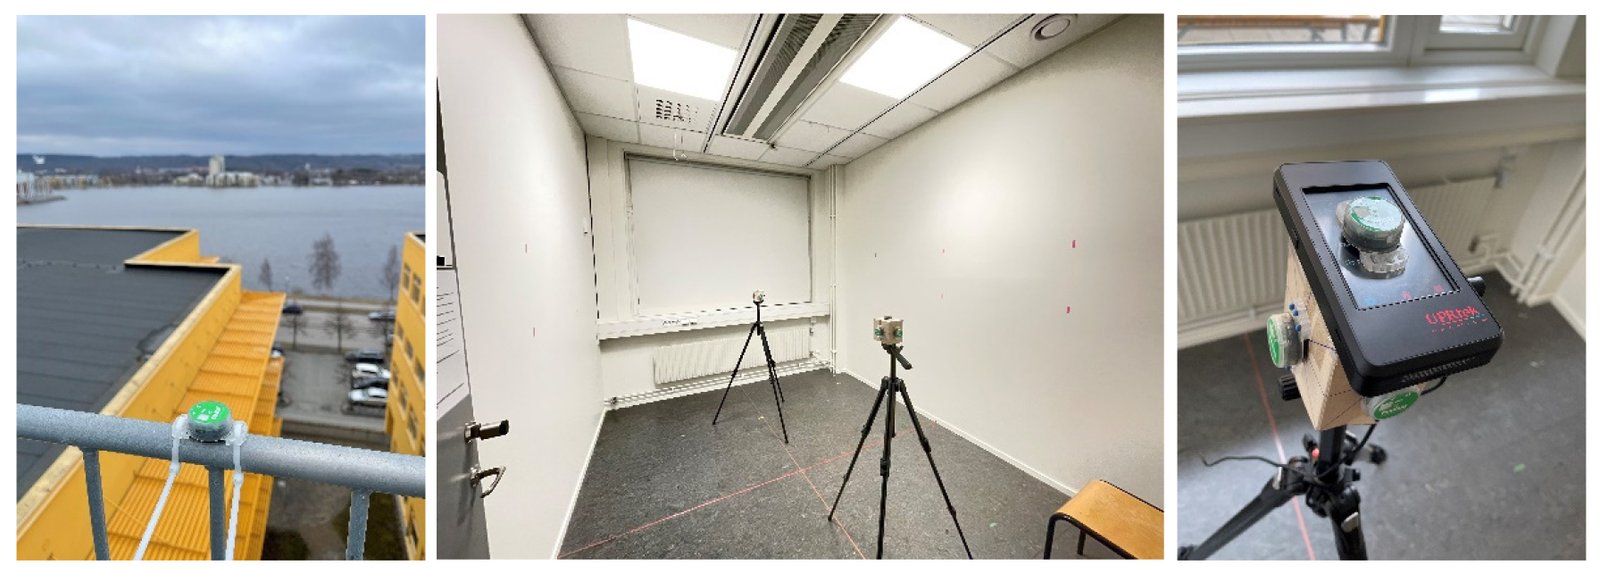
Fig. C1. Measurement devices and data loggers were placed at the two control points in the office room and one at the rooftop.
The real-life measurement ran for three days, from March 1st to March 3rd, 2024, measuring only daylight with one-minute intervals. The measured sky illuminance was converted to global horizontal irradiance (GHI) by dividing it by 179, which is the luminous efficacy coefficient of the equal energy light used in calculating luminance and illuminance in Radiance [140]. Lark v2.0 period simulation extracts DHI and DNI from the weather file to run daylight simulations. Since the sky was overcast overall during the three days and since GHI equals the sum of DNI and DHI, the DNI was assumed to be 0 all the time, and the DHI values were replaced by the GHI measured. According to Pierson et al. [52], accurately simulating the quantity of light (irradiance) had a larger impact on the result than accurately simulating the spectrum. Hence, a constant D65 was reasonably accurate in simulating mEDI indoors in various sky conditions.
The model was simulated with the given inputs, followed by several rounds of adjustments to calibrate and increase the accuracy of the final simulations, following the method described by He et al. [143]. Initially, Radiance parameters were set lower (-ab 2, -ad 512, -lw 0.0001) to facilitate faster iterative simulations. Based on the weather file DHI and DNI, the first simulation round in Lark resulted in a different daylight pattern and low illuminance values. Subsequently, sky irradiance values were adjusted as described above, producing a daylight pattern similar to real-life measurements and high accuracy for north-facing views (towards the window). However, other views still showed low illuminance values. In the third round, all interior and exterior surfaces, even the surrounding building and ground, were changed to white with high photopic and spectral reflectance (Rvis 93%). This adjustment resulted in higher simulation values for the north-facing view, but the illuminance at sensor P2 did not increase significantly. Finally, the glazing was changed to a higher photopic and spectral transmittance (Tvis 0.95), allowing almost all light to pass through. This led to significantly higher simulation values than measurements for view directions at P1, while view directions at P2 remained lower (Fig. C2).
Figure C2
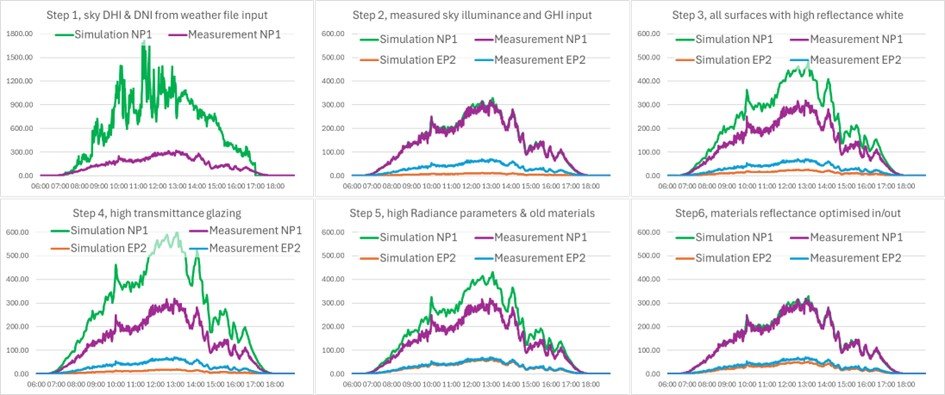
Fig. C2. Calibration steps and validation of the simulation model.
After returning the surface materials to the initial inputs and setting Radiance parameters to higher accuracy (-ab 6, -ad 1024, -lw 0.0001), the simulation results matched all views at the two points except for the north-facing views at P1 and P2, which were higher. To address this, surrounding building and ground materials were set to lower reflectance values, and interior surface materials were set to higher reflectance to reduce reflected light at the north views and increase it inside the room. These changes have resulted in new material properties chosen from the spectral material database [141] (Table C1), as the previously measured properties were approximate. The high-accuracy simulation data strongly correlated with observed real-world measurements for all the views (Fig. C2).
Table C1
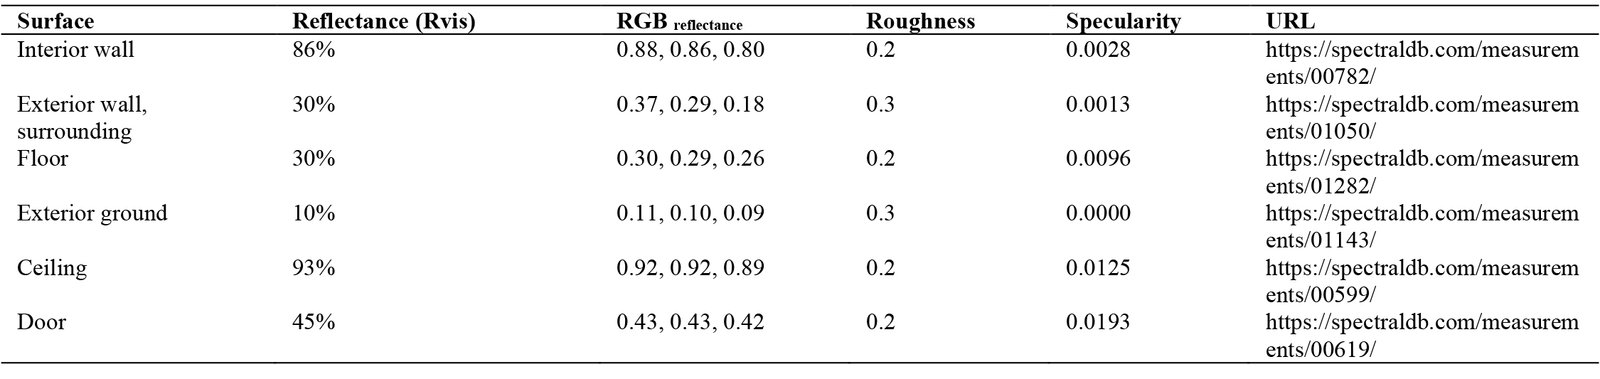
Table C1. Surface material properties from the spectral material database after model calibration.
The regression analysis compared the resulting simulation data with the observed real-world measurements and revealed a strong correlation, with an R² value ranging from 0.97 to 0.98. This means that the simulated data can explain 97% to 98% of the variance in the measured light levels. An R² value close to 1 indicates a very high level of accuracy and agreement between the simulation results and the real-world measurements, suggesting that the model and its parameters are highly effective in predicting actual lighting conditions (Fig. C3).
Figure C3
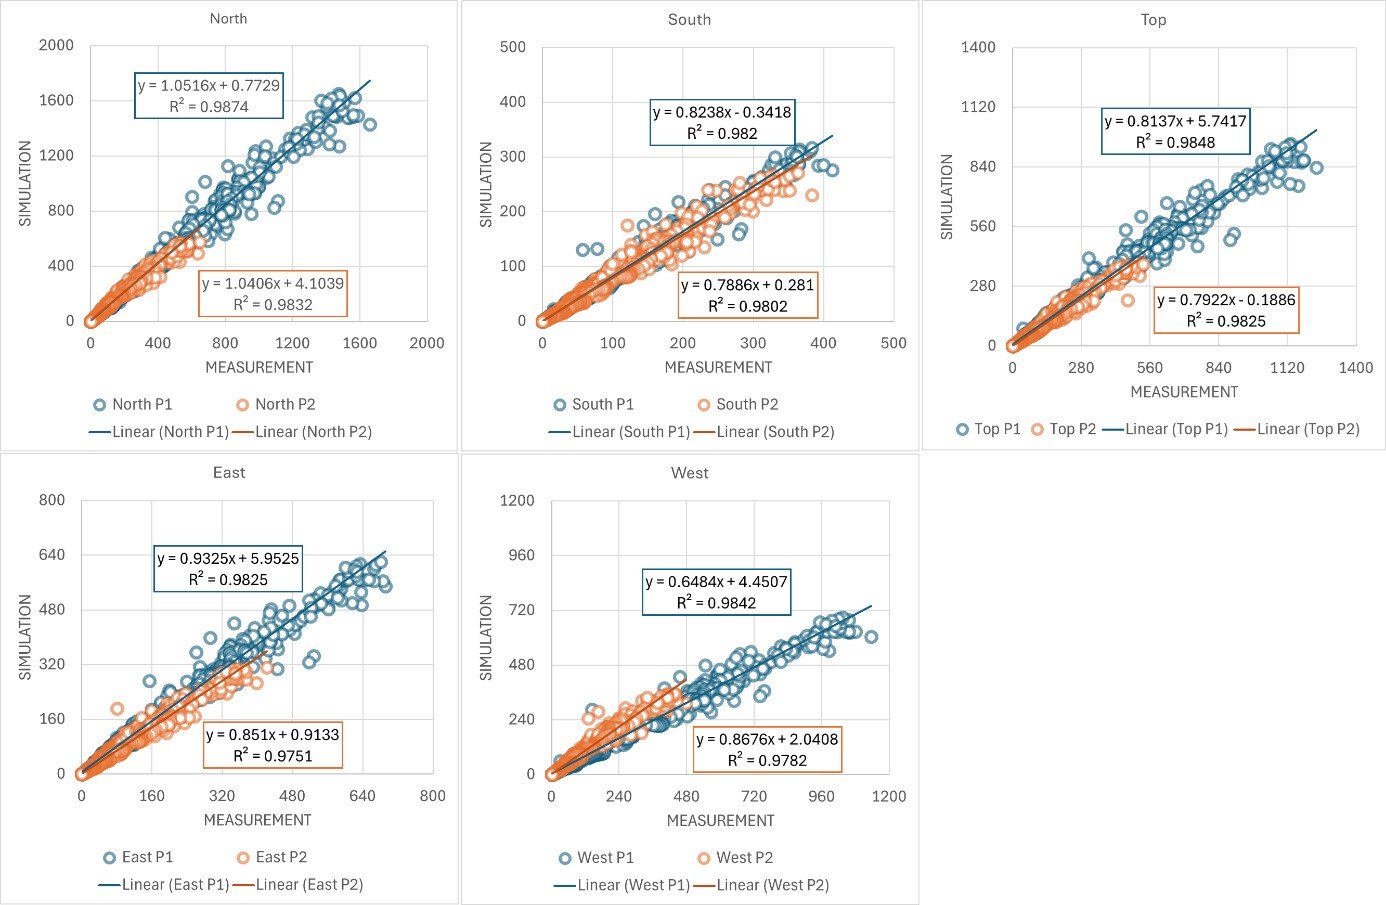
Fig. C3. Regression analysis, RMSE, MBE of the simulation model and measurement.
The mean biased error (MBE) and root mean squared error (RMSE) are calculated to characterise the similarities/differences between two data series. The relative MBE indicates the tendency of one data series to be larger or smaller than the other. The RMSE indicates how far one data series “fluctuates” around the other. The MBE and RMSE are calculated for each point of view and their average. In this context, a negative Mean Biased Error (MBE) indicates that, on average, the simulation underestimates the observed real-world measurements. A negative MBE means that the simulated light levels are generally lower than the actual measured light levels. MBE for north-facing views only is positive, meaning the simulation overestimates the real-world measurements. Generally, P1, which is closer to the window, has a higher error factor than P2 because P1 is more directly influenced by variations in sunlight and reflections from the window, making it more challenging to model accurately. The area near the window may have more complex lighting interactions, such as reflections and refractions, that are harder to simulate precisely.
The RMSE analysis is also higher for P1, with a value of 42, suggesting that, on average, the predictions deviate from the actual measurements by 42 lux for light levels compared to 17 lux for P2. The lower the RMSE, the more accurate the model. This bias suggests that the model might be refined further to better capture the actual lighting conditions. It is important to note that there currently does not exist a standard or common reference that suggests how high or low typical MBEs and/or RMSEs should be for a simulation to be considered ‘reliable’ [144]. The average MBE (-10.5) and RMSE (29.8) for both points show that the error is relatively acceptable compared to other studies ranges. In previous validation studies, various benchmarks have been established for evaluating the accuracy of daylighting simulations. For example, in a validation study of Radiance, the largest Mean Bias Error (MBE) and Root Mean Squared Error (RMSE) reported were 20% and 33%, respectively [145]. Another study validating Lark suggests most errors should be within the ±20% range [142]. These benchmarks provide a useful reference for assessing the accuracy of daylighting simulation models.
Overall, the adjustments made to the simulation parameters and material reflectance values have significantly improved the alignment between the simulated and actual light conditions, demonstrating the effectiveness of the refined Radiance settings and material properties in achieving realistic lighting simulations.
Acknowledgement
The authors would like to thank Mr. Mikael Petersson for his assistance during the laboratory measurements.
Funding
This work was funded by Bertil and Britt Svenssons Stiftelse för Belysningsteknik (2022-vår-07).
Contributions
A. Tabbah: Conceptualization, Investigation, Methodology, Data curation, Formal analysis, Validation, Visualization, Writing – original draft, Writing – review & editing, Funding acquisition. P. Johansson: Conceptualization, Methodology, Writing – review & editing, Supervision, Project administration, Funding acquisition. M. Aries: Conceptualization, Methodology, Visualization, Writing – review & editing, Supervision, Resources, Funding acquisition.
Declaration of competing interest
The authors declare no conflict of interest.
References
- N. E. Klepeis, W. C. Nelson, W. R. Ott, J. P. Robinson, A. M. Tsang, P. Switzer, J. V. Behar, S. C. Hern and W. H. Engelmann, The National Human Activity Pattern Survey (NHAPS): a resource for assessing exposure to environmental pollutants, Journal of Exposure Science & Environmental Epidemiology, 11(3) (2001) 231-252. https://doi.org/10.1038/sj.jea.7500165
- M. Andersen, J. Mardaljevic and S. W. Lockley, A framework for predicting the non-visual effects of daylight - Part I: photobiology- based model, Lighting Research & Technology, 44(1) (2012) 37-53. https://doi.org/10.1177/1477153511435961
- M. Andersen, S. J. Gochenour and S. W. Lockley, Modelling 'non-visual' effects of daylighting in a residential environment, Building and Environment, 70 (2013) 138-149. https://doi.org/10.1016/j.buildenv.2013.08.018
- S. Ezpeleta, E. Orduna-Hospital, J. Aporta, M. J. Luesma, I. Pinilla and A. Sánchez-Cano, Evaluation of Visual and Nonvisual Levels of Daylight from Spectral Power Distributions Considering Orientation and Seasonality, Applied Sciences, 11(13) (2021). https://doi.org/10.3390/app11135996
- C. Vetter et al., A Review of Human Physiological Responses to Light: Implications for the Development of Integrative Lighting Solutions, Leukos, 18(3) (2022) 387-414. https://doi.org/10.1080/15502724.2021.1872383
- L. L. A. Price et al., Linking the non-visual effects of light exposure with occupational health, Int J Epidemiol, 48(5) (2019) 1393-1397. https://doi.org/10.1093/ije/dyz131
- L. J. M. Schlangen and B. M. I. van der Zande, The power of healthy daytime lighting in indoor settings: melanopic lighting advances and office applications, Zenodo, (2022).
- CIE, System for metrology of optical radiation for ipRGC-influenced responses to light, (2018).
- T. M. Brown et al., Recommendations for daytime, evening, and nighttime indoor light exposure to best support physiology, sleep, and wakefulness in healthy adults, PLOS Biology, 20(3) (2022) e3001571. https://doi.org/10.1371/journal.pbio.3001571
- S. Hattar, H. W. Liao, M. Takao, D. M. Berson and K. W. Yau, Melanopsin-Containing Retinal Ganglion Cells: Architecture, Projections, and Intrinsic Photosensitivity, Science (American Association for the Advancement of Science), 295(5557) (2002) 1065-1070. https://doi.org/10.1126/science.1069609
- J. Mardaljevic, M. Andersen, N. Roy and J. Christoffersen, A framework for predicting the non-visual effects of daylight - Part II: The simulation model, Lighting Research & Technology, 46(4) (2014) 388-406. https://doi.org/10.1177/1477153513491873
- CIE, ISO/CIE TR 21783:2022 | ISO/CIE TR 21783 Light and lighting-Integrative lighting- Non-visual effects, Report No. ISO/CIE TR 21783., (2020). Retrieved from: https://cie.co.at/publications/light-and-lighting-integrative-lighting-non-visual-effects.
- K. W. Houser and T. Esposito, Human-Centric Lighting: Foundational Considerations and a Five-Step Design Process, Frontiers in neurology, 12 (2021) 630553. https://doi.org/10.3389/fneur.2021.630553
- Y. A. W. de Kort and J. A. Veitch, From blind spot into the spotlight: Introduction to the special issue 'Light, lighting, and human behaviour', Journal of Environmental Psychology, 39 (2014) 1-4. https://doi.org/10.1016/j.jenvp.2014.06.005
- C. Cajochen, M. Münch, S. Kobialka, K. Kräuchi, R. Steiner, P. Oelhafen, S. Orgül and A. Wirz-Justice, High Sensitivity of Human Melatonin, Alertness, Thermoregulation, and Heart Rate to Short Wavelength Light, The journal of clinical endocrinology and metabolism, 90(3) (2005) 1311-1316. https://doi.org/10.1210/jc.2004-0957
- M. Rüger, M. C. M. Gordijn, D. G. M. Beersma, B. De Vries and S. Daan, Time-of-day-dependent effects of bright light exposure on human psychophysiology: comparison of daytime and nighttime exposure, American Journal of Physiology-Regulatory, Integrative and Comparative Physiology, 290(5) (2006) R1413-R1420. https://doi.org/10.1152/ajpregu.00121.2005
- Y. Li, W. Fang, H. Qiu and J. Wang, The non-visual effects of correlated color temperature on the alertness, cognition, and mood of fatigued individuals during the afternoon, International Journal of Industrial Ergonomics, 101 (2024). https://doi.org/10.1016/j.ergon.2024.103589
- M. C. Giménez, O. Stefani, C. Cajochen, D. Lang, G. Deuring and L. J. M. Schlangen, Predicting melatonin suppression by light in humans: Unifying photoreceptor-based equivalent daylight illuminances, spectral composition, timing and duration of light exposure, Journal of Pineal Research, 72(2) (2022) e12786. https://doi.org/10.1111/jpi.12786
- M. Spitschan, P. Vidafar, S. W. Cain, A. J. K. Phillips and B. C. Lambert, Power Analysis for Human Melatonin Suppression Experiments, Clocks and Sleep, 6(1) (2024) 114-128. https://doi.org/10.3390/clockssleep6010009
- L. M. Huiberts, K. C. H. J. Smolders and Y. A. W. De Kort, Seasonal and time-of-day variations in acute non-image forming effects of illuminance level on performance, physiology, and subjective well-being, Chronobiology International, 34(7) (2017) 827-844. https://doi.org/10.1080/07420528.2017.1324471
- K. C. H. J. Smolders, Y. A. W. de Kort and P. J. M. Cluitmans, A higher illuminance induces alertness even during office hours: Findings on subjective measures, task performance and heart rate measures, Physiology & Behavior, 107(1) (2012) 7-16. https://doi.org/10.1016/j.physbeh.2012.04.028
- M. Spitschan, Time-Varying Light Exposure in Chronobiology and Sleep Research Experiments, Frontiers in Neurology, 12 (2021). https://doi.org/10.3389/fneur.2021.654158
- M. G. Figueiro, R. Nagare and L. Price, Non-visual effects of light: how to use light to promote circadian entrainment and elicit alertness, Light Res Technol, 50(1) (2018) 38-62. https://doi.org/10.1177/1477153517721598
- C. A. Czeisler, J. F. Duffy, T. L. Shanahan, E. N. Brown and et al., Stability, precision, and near-24-hour period of the human circadian pacemaker, Science, 284(5423) (1999) 2177-2181. https://doi.org/10.1126/science.284.5423.2177
- J. F. Duffy et al., Sex difference in the near-24-hour intrinsic period of the human circadian timing system, Proceedings of the National Academy of Sciences, 108(supplement_3) (2011) 15602-15608. https://doi.org/10.1073/pnas.1010666108
- Kenneth, Andrew, Brian, Brandon, T. Rusterholz and Evan, Entrainment of the Human Circadian Clock to the Natural Light-Dark Cycle, Current Biology, 23(16) (2013) 1554-1558. https://doi.org/10.1016/j.cub.2013.06.039
- T. Eto and S. Higuchi, Review on age-related differences in non-visual effects of light: melatonin suppression, circadian phase shift and pupillary light reflex in children to older adults, Journal of Physiological Anthropology, 42(1) (2023). https://doi.org/10.1186/s40101-023-00328-1
- B. Feigl, G. Ojha, L. Hides and A. J. Zele, Melanopsin-Driven Pupil Response and Light Exposure in Non-seasonal Major Depressive Disorder, Front Neurol, 9 (2018) 764. https://doi.org/10.3389/fneur.2018.00764
- S. A. Laurenzo et al., Pupillary response abnormalities in depressive disorders, Psychiatry Research, 246 (2016) 492-499. https://doi.org/10.1016/j.psychres.2016.10.039
- L. Tao, R. Jiang, K. Zhang, Z. Qian, P. Chen, Y. Lv and Y. Yao, Light therapy in non-seasonal depression: An update meta-analysis, Psychiatry Research, 291 (2020). https://doi.org/10.1016/j.psychres.2020.113247
- J. L. Anderson, C. A. Glod, J. Dai, Y. Cao and S. W. Lockley, Lux vs. wavelength in light treatment of Seasonal Affective Disorder, Acta Psychiatrica Scandinavica, 120(3) (2009) 203-212. https://doi.org/10.1111/j.1600-0447.2009.01345.x
- K. A. Roecklein et al., Melanopsin-driven pupil response in summer and winter in unipolar seasonal affective disorder, Journal of Affective Disorders, 291 (2021) 93-101. https://doi.org/10.1016/j.jad.2021.04.084
- P. Khademagha, M. B. C. Aries, A. L. P. Rosemann and E. J. van Loenen, Implementing non-image-forming effects of light in the built environment: A review on what we need, Building and environment, 108 (2016) 263-272. https://doi.org/10.1016/j.buildenv.2016.08.035
- H. Baek and B.-K. Min, Blue light aids in coping with the post-lunch dip: an EEG study, Ergonomics, 58(5) (2015) 803-810. https://doi.org/10.1080/00140139.2014.983300
- A. U. P. Viola, L. M. James, L. J. M. P. Schlangen and D.-J. P. Dijk, Blue-enriched white light in the workplace improves self-reported alertness, performance and sleep quality, Scandinavian Journal of Work, Environment & Health, 34(4) (2008) 297-306. https://doi.org/10.5271/sjweh.1268
- G. Glickman, J. P. Hanifin, M. D. Rollag, J. Wang, H. Cooper and G. C. Brainard, Inferior Retinal Light Exposure Is More Effective than Superior Retinal Exposure in Suppressing Melatonin in Humans, Journal of Biological Rhythms, 18(1) (2003) 71-79. https://doi.org/10.1177/0748730402239678
- M. Rüger, M. C. M. Gordijn, D. G. M. Beersma, B. de Vries and S. Daan, Nasal versus Temporal Illumination of the Human Retina: Effects on Core Body Temperature, Melatonin, and Circadian Phase, Journal of Biological Rhythms, 20(1) (2005) 60-70. https://doi.org/10.1177/0748730404270539
- M. L. Amundadottir, S. Rockcastle, M. Sarey Khanie and M. Andersen, A human-centric approach to assess daylight in buildings for non-visual health potential, visual interest and gaze behavior, Building and environment, 113 (2017) 5-21. https://doi.org/10.1016/j.buildenv.2016.09.033
- M. Te Kulve, L. J. M. Schlangen and W. D. van Marken Lichtenbelt, Early evening light mitigates sleep compromising physiological and alerting responses to subsequent late evening light, Sci Rep, 9(1) (2019) 16064. https://doi.org/10.1038/s41598-019-52352-w
- M. Hébert, S. K. Martin, C. Lee and C. I. Eastman, The effects of prior light history on the suppression of melatonin by light in humans, Journal of Pineal Research, 33(4) (2002) 198-203. https://doi.org/10.1034/j.1600-079X.2002.01885.x
- I. Schöllhorn, O. Stefani, C. Blume and C. Cajochen, Seasonal Variation in the Responsiveness of the Melanopsin System to Evening Light: Why We Should Report Season When Collecting Data in Human Sleep and Circadian Studies, Clocks and Sleep, 5(4) (2023) 651-666. https://doi.org/10.3390/clockssleep5040044
- J. S. Martin, M. Hébert, É. Ledoux, M. Gaudreault and L. Laberge, Relationship of Chronotype to Sleep, Light Exposure, and Work-Related Fatigue in Student Workers, Chronobiology International, 29(3) (2012) 295-304. https://doi.org/10.3109/07420528.2011.653656
- A. Lowden, G. Öztürk, A. Reynolds and B. Bjorvatn, Working Time Society consensus statements: Evidence based interventions using light to improve circadian adaptation to working hours, Ind Health, 57(2) (2019) 213-227. https://doi.org/10.2486/indhealth.SW-9
- S. W. Lockley, E. E. Evans, F. A. J. L. Scheer, G. C. Brainard, C. A. Czeisler and D. Aeschbach, Short-Wavelength Sensitivity for the Direct Effects of Light on Alertness, Vigilance, and the Waking Electroencephalogram in Humans, Sleep, 29(2) (2006) 161-168.
- B. Bano-Otalora, M. J. Moye, T. M. Brown, R. J. Lucas, C. O. Diekman and M. D. C. Belle, Daily electrical activity in the master circadian clock of a diurnal mammal, Cold Spring Harbor Laboratory, (2020). https://doi.org/10.1101/2020.12.23.424225
- B. Bano-Otalora, M. Franck, C. Harding, D. A. Bechtold, A. E. Allen, T. M. Brown, B. Mino Dc and R. J. Lucas, Daytime light enhances the amplitude of circadian output in a diurnal mammal, Cold Spring Harbor, (2020). https://doi.org/10.1101/2020.06.22.164194
- T. Roenneberg, A. Wirz-Justice and M. Merrow, Life between Clocks: Daily Temporal Patterns of Human Chronotypes, Journal of Biological Rhythms, 18(1) (2003) 80-90. https://doi.org/10.1177/0748730402239679
- M. Boubekri, J. Lee, P. MacNaughton, M. Woo, L. Schuyler, B. Tinianov and U. Satish, The Impact of Optimized Daylight and Views on the Sleep Duration and Cognitive Performance of Office Workers, Int J Environ Res Public Health, 17(9) (2020). https://doi.org/10.3390/ijerph17093219
- D. Leger, V. Bayon, M. Elbaz, P. Philip and D. Choudat, Underexposure to light at work and its association to insomnia and sleepiness: A cross-sectional study of 13 296 workers of one transportation company, Journal of Psychosomatic Research, 70(1) (2011) 29-36. https://doi.org/10.1016/j.jpsychores.2010.09.006
- S. Hubalek, M. Brink and C. Schierz, Office workers' daily exposure to light and its influence on sleep quality and mood, Lighting Research & Technology, 42(1) (2010) 33-50. https://doi.org/10.1177/1477153509355632
- A. J. Lewy, J. N. Rough, J. B. Songer, N. Mishra, K. Yuhas and J. S. Emens, The phase shift hypothesis for the circadian component of winter depression, Dialogues in Clinical Neuroscience, 9(3) (2007) 291-300. https://doi.org/10.31887/DCNS.2007.9.3/alewy
- S. Higuchi, Y. Motohashi, K. Ishibashi and T. Maeda, Less Exposure to Daily Ambient Light in Winter Increases Sensitivity of Melatonin to Light Suppression, Chronobiology International, 24(1) (2007) 31-43. https://doi.org/10.1080/07420520601139805
- G. Glickman, B. Byrne, C. Pineda, W. W. Hauck and G. C. Brainard, Light Therapy for Seasonal Affective Disorder with Blue Narrow-Band Light-Emitting Diodes (LEDs), Biological Psychiatry, 59(6) (2006) 502-507. https://doi.org/10.1016/j.biopsych.2005.07.006
- N. Ghaeili Ardabili, J. Wang and N. Wang, A systematic literature review: Building window's influence on indoor circadian health, Renewable and Sustainable Energy Reviews, 188 (2023). https://doi.org/10.1016/j.rser.2023.113796
- A. Batool, P. Rutherford, P. McGraw, T. Ledgeway and S. Altomonte, Window Views: Difference of Perception during the COVID-19 Lockdown, LEUKOS - Journal of Illuminating Engineering Society of North America, 17(4) (2021) 380-390. https://doi.org/10.1080/15502724.2020.1854780
- A. Borisuit, J. Kämpf, M. Münch, A. Thanachareonkit and J. L. Scartezzini, Monitoring and rendering of visual and photo-biological properties of daylight-redirecting systems, Solar Energy, 129 (2016) 297-309. https://doi.org/10.1016/j.solener.2015.12.052
- CIE, CIE position Statement on Non-Visual Effects of Light: Recommending Proper Light at the Proper Time, 2nd edition, (2019). Retrieved from: https://cie.co.at/publications/position-statement-non-visual-effects-light-recommending-proper-light-proper-time-2nd.
- O. K. Larsen, R. L. Jensen, T. Antonsen and I. Strømberg, Estimation methodology for the electricity consumption with daylight- and occupancy-controlled artificial lighting, Energy Procedia, 122 (2017) 733-738. https://doi.org/10.1016/j.egypro.2017.07.388
- F. Yu, R. Wennersten and J. Leng, A state-of-art review on concepts, criteria, methods and factors for reaching 'thermal-daylighting balance', Building and environment, 186 (2020) 107330. https://doi.org/10.1016/j.buildenv.2020.107330
- E. J. Gago, T. Muneer, M. Knez and H. Köster, Natural light controls and guides in buildings. Energy saving for electrical lighting, reduction of cooling load, Renewable and Sustainable Energy Reviews, 41 (2015) 1-13. https://doi.org/10.1016/j.rser.2014.08.002
- C. E. Ochoa, M. B. C. Aries and J. L. M. Hensen, State of the art in lighting simulation for building science: a literature review, Journal of building performance simulation, 5(4) (2012) 209-233. https://doi.org/10.1080/19401493.2011.558211
- M. Ayoub, 100 Years of daylighting: A chronological review of daylight prediction and calculation methods, Solar energy, 194 (2019) 360-390. https://doi.org/10.1016/j.solener.2019.10.072
- M. Gkaintatzi-Masouti, J. van Duijnhoven and M. P. J. Aarts, Simulations of non-image-forming effects of light in building design: A literature review, Lighting Research & Technology, 55(7-8) (2023) 669-689. https://doi.org/10.1177/14771535221142812
- A. Faraji, M. Rashidi, F. Rezaei and P. Rahnamayiezekavat, A Meta-Synthesis Review of Occupant Comfort Assessment in Buildings (2002-2022), Sustainability, 15(5) (2023) 4303. https://doi.org/10.3390/su15054303
- B. J. Alkhatatbeh, Y. Kurdi and S. Asadi, Multi-objective optimization of classrooms' daylight performance and energy use in U.S. Climate Zones, Energy and Buildings, 297 (2023). https://doi.org/10.1016/j.enbuild.2023.113468
- S. Safranek, J. M. Collier, A. Wilkerson and R. G. Davis, Energy impact of human health and wellness lighting recommendations for office and classroom applications, Energy and Buildings, 226 (2020) 110365. https://doi.org/10.1016/j.enbuild.2020.110365
- B. Abboushi and S. Safranek, Determining Critical Points To Control Electric Lighting To Meet Circadian Lighting Requirements And Minimize Energy Use, in: 2022 Annual Modeling and Simulation Conference (ANNSIM), San Diego, CA, USA, (18 07 2022), pp. 559-568. https://doi.org/10.23919/ANNSIM55834.2022.9859378
- Y. Zeng, H. Sun and B. Lin, Optimized lighting energy consumption for non-visual effects: A case study in office spaces based on field test and simulation, Building and Environment, 205 (2021). https://doi.org/10.1016/j.buildenv.2021.108238
- SOLEMMA, ClimateStudio v1.9.8389.21977. Retrieved from: https://www.solemma.com/climatestudio.
- M. Gkaintatzi-Masouti, C. Pierson, J. Van Duijnhoven, M. Andersen and M. Aarts, A simulation tool for building and lighting design considering ipRGC-influenced light responses, E3S Web of Conferences, 362 (2022) 01001. https://doi.org/10.1051/e3sconf/202236201001
- SOLEMMA, ALFA 0.5.0.7 Beta. Retrieved from: https://www.solemma.com/alfa.
- C. E. Ochoa, M. B. C. Aries, E. J. Van Loenen and J. L. M. Hensen, Considerations on design optimization criteria for windows providing low energy consumption and high visual comfort, Applied Energy, 95 (2012) 238-245. https://doi.org/10.1016/j.apenergy.2012.02.042
- S. M. Hosseini, M. Heiranipour, J. Wang, L. E. Hinkle, G. Triantafyllidis and S. Attia, Enhancing Visual Comfort and Energy Efficiency in Office Lighting Using Parametric-Generative Design Approach for Interactive Kinetic Louvers, Journal of Daylighting, 11(1) (2024) 69-96. https://doi.org/10.15627/jd.2024.5
- S. Nazari, P. K. MirzaMohammadi, B. Sajadi, P. Pilehchi Ha, S. Talatahari and P. Sareh, Designing energy-efficient and visually-thermally comfortable shading systems for office buildings in a cooling-dominant climate, Energy Reports, 10 (2023) 3863-3881. https://doi.org/10.1016/j.egyr.2023.10.062
- M. Valitabar, M. Mahdavinejad, H. Skates and P. Pilechiha, A dynamic vertical shading optimisation to improve view, visual comfort and operational energy, Open House International, 46(3) (2021) 401-415. https://doi.org/10.1108/OHI-02-2021-0031
- W. Zou, Y. Wang, E. Tian, J. Wei, J. Peng and J. Mo, A New Dynamic and Vertical Photovoltaic Integrated Building Envelope for High-Rise Glaze-Facade Buildings, Engineering, 39 (2024) 194-203. https://doi.org/10.1016/j.eng.2024.01.014
- R. Perez, P. Ineichen, R. Seals, J. Michalsky and R. Stewart, Modeling daylight availability and irradiance components from direct and global irradiance, Solar Energy, 44(5) (1990) 271-289. https://doi.org/10.1016/0038-092X(90)90055-H
- M. Inanici, M. Brennan and E. Clark, Spectral Lighting Simulations: Computing Circadian Light, in: Proceedings of Building Simulation 2015: 14th Conference of IBPSA, Hyderabad, India, (07 12 2015), pp. 1245-1252. https://doi.org/10.26868/25222708.2015.2467
- Munsell Color Science Laboratory, Excel Daylight Series Calculator, (2002). Retrieved from: http://www.ritmcsl.org/UsefulData/DaylightSeries.xls.
- J. A. Jakubiec, Data-Driven Selection of Typical Opaque Material Reflectances for Lighting Simulation, LEUKOS, 19(2) (2023) 176-189. https://doi.org/10.1080/15502724.2022.2100788
- S. He, Y. Yan and H. Cai, Improving the accuracy of circadian lighting simulation with field measurement, Journal of Building Performance Simulation, 15(5) (2022) 575-598. https://doi.org/10.1080/19401493.2022.2071466
- C. F. Reinhart and O. Walkenhorst, Validation of dynamic RADIANCE-based daylight simulations for a test office with external blinds, Energy and Buildings, 33(7) (2001) 683-697. https://doi.org/10.1016/S0378-7788(01)00058-5
- C. Pierson, M. Aarts and M. Andersen, Validation of spectral simulation tools for the prediction of indoor daylight exposure, in: Building Simulation Conference Proceedings, Bruges, Belgium, (01 09 2021), pp. 2522-2708. https://doi.org/10.26868/25222708.2021.30583
- International WELL Building Institute, WELL v2, Q1-Q2 2024: WELL building standard, (2024). Retrieved from: https://v2.wellcertified.com/wellv2/en/overview.
- U.S. Green Building Council, LEED v4.1 Building Design and Construction, (2023).
- Swedish Institute for Standards, SS-EN 17037:2018+A1:2021 Daylight in buildings, (2021) 72. Retrieved from: https://www.sis.se/en/produkter/building-design-stage/building-design/ss-en-170372018a12021/.
- M. L. Ámundadóttir, M. Andersen and S. W. Lockley, Light-driven Model for Identifying Indicators of Non-visual Health Potential in the Built Environment, Ecole Polytechnique Fédérale de Lausanne: Lausanne, Switzerland, 2016.
- S. B. S. Khalsa, M. E. Jewett, C. Cajochen and C. A. Czeisler, A Phase Response Curve to Single Bright Light Pulses in Human Subjects, The Journal of Physiology, 549(3) (2003) 945-952. https://doi.org/10.1113/jphysiol.2003.040477
- M. Benedetti, L. Maierová, C. Cajochen, J.-L. Scartezzini and M. Münch, Optimized office lighting advances melatonin phase and peripheral heat loss prior bedtime, Scientific Reports, 12(1) (2022). https://doi.org/10.1038/s41598-022-07522-8
- J. Lee and M. Boubekri, Introduction of new daylighting metrics for health, wellbeing, and feasibility: a study of the indoor building environment, Journal of Green Building, 17(1) (2022) 105-126. https://doi.org/10.3992/jgb.17.1.105
- M. Münch, C. Nowozin, J. Regente, F. Bes, J. De Zeeuw, S. Hädel, A. Wahnschaffe and D. Kunz, Blue-Enriched Morning Light as a Countermeasure to Light at the Wrong Time: Effects on Cognition, Sleepiness, Sleep, and Circadian Phase, Neuropsychobiology, 74(4) (2017) 207-218. https://doi.org/10.1159/000477093
- T. Ru, M. E. Kompier, Q. Chen, G. Zhou and K. C. H. J. Smolders, Temporal tuning of illuminance and spectrum: Effect of a full-day dynamic lighting pattern on well-being, performance and sleep in simulated office environment, Building and Environment, 228 (2023) 109842. https://doi.org/10.1016/j.buildenv.2022.109842
- R. W. Corbett, B. Middleton and J. Arendt, An hour of bright white light in the early morning improves performance and advances sleep and circadian phase during the Antarctic winter, Neuroscience Letters, 525(2) (2012) 146-151. https://doi.org/10.1016/j.neulet.2012.06.046
- W. van Bommel, Dynamic Lighting at work-both in level and colour, CIE, (2006). Retrieved from: https://www.researchgate.net/publication/228487691_Dynamic_Lighting_at_work-both_in_level_and_colour.
- W. J. M. van Bommel, Non-visual biological effect of lighting and the practical meaning for lighting for work, Applied Ergonomics, 37(4) (2006) 461-466. https://doi.org/10.1016/j.apergo.2006.04.009
- S. L. Hartmeyer and M. Andersen, Towards a framework for light-dosimetry studies: Quantification metrics, Lighting Research & Technology, 56(4) (2023) 337-365. https://doi.org/10.1177/14771535231170500
- C. Nowozin, A. Wahnschaffe, J. de Zeeuw, A. Papakonstantinou, S. Hädel, A. Rodenbeck, F. Bes and D. Kunz, Living in Biological Darkness II: Impact of Winter Habitual Daytime Light on Night-Time Sleep, European Journal of Neuroscience, 61(2) (2025). https://doi.org/10.1111/ejn.16647
- H. Hao, J. Xu and L. J. M. Schlangen, Evaluation and optimization of annual light variations for visual and non-visual effects within a ground-floor middle school classroom, Journal of Building Engineering, 98 (2024) 111293. https://doi.org/10.1016/j.jobe.2024.111293
- S. Kim and M. D. Casement, Promoting adolescent sleep and circadian function: A narrative review on the importance of daylight access in schools, Chronobiology International, 41(5) (2024) 725-737. https://doi.org/10.1080/07420528.2024.2341156
- J. Liu, Z. Li, Z. Zhang, L. Xie and J. Wu, Evaluation and Optimization of Interior Circadian Daylighting Performance for the Elderly in Traditional Dwellings: A Case Study in Western Hunan, China, Sustainability, 16(9) (2024) 3563. https://doi.org/10.3390/su16093563
- B. Mukherjee and M. Boubekri, Sustainable Architecture and Human Health: A Case for Effective Circadian Daylighting Metrics, Buildings, 15(3) (2025). https://doi.org/10.3390/buildings15030315
- E. Rastegari, M. Adamsson and M. Aries, Daylight potential of Swedish residential environments: Visual and beyond-vision effects and the relationship with well-being assessment, Lighting Research & Technology, (2024) 14771535241268606. https://doi.org/10.1177/14771535241268606
- J. Mantua and R. M. C. Spencer, Exploring the nap paradox: are mid-day sleep bouts a friend or foe?, Sleep Medicine, 37 (2017) 88-97. https://doi.org/10.1016/j.sleep.2017.01.019
- M. Takahashi, A. Nakata, T. Haratani, Y. Ogawa and H. Arito, Post-lunch nap as a worksite intervention to promote alertness on the job, Ergonomics, 47(9) (2004) 1003-1013. https://doi.org/10.1080/00140130410001686320
- T. Askaripoor, M. Motamedzade, R. Golmohammadi, M. Farhadian, M. Babamiri and M. Samavati, Effects of light intervention on alertness and mental performance during the post-lunch dip: a multi-measure study, Industrial Health, 57(4) (2019) 511-524. https://doi.org/10.2486/indhealth.2018-0030
- L. Qian, T. Ru, Q. Chen, Y. Li, Y. Zhou and G. Zhou, Effects of bright light and an afternoon nap on task performance depend on the cognitive domain, Journal of Sleep Research, 30(4) (2021) e13242. https://doi.org/10.1111/jsr.13242
- H. Slama, G. Deliens, R. Schmitz, P. Peigneux and R. Leproult, Afternoon Nap and Bright Light Exposure Improve Cognitive Flexibility Post Lunch, PLOS ONE, 10(5) (2015) e0125359. https://doi.org/10.1371/journal.pone.0125359
- Y. Zhou, Q. Chen, X. Luo, L. Li, T. Ru and G. Zhou, Does Bright Light Counteract the Post-lunch Dip in Subjective States and Cognitive Performance Among Undergraduate Students?, Frontiers in Public Health, 9 (2021). https://doi.org/10.3389/fpubh.2021.652849
- M. B. C. Aries, F. Beute and G. Fischl, Assessment protocol and effects of two dynamic light patterns on human well-being and performance in a simulated and operational office environment, Journal of Environmental Psychology, 69 (2020) 101409. https://doi.org/10.1016/j.jenvp.2020.101409
- M. E. Kompier, K. C. H. J. Smolders, W. D. van Marken Lichtenbelt and Y. A. W. de Kort, Effects of light transitions on measures of alertness, arousal and comfort, Physiology & Behavior, 223 (2020) 112999. https://doi.org/10.1016/j.physbeh.2020.112999
- S. T. Peeters, K. C. H. J. Smolders and Y. A. W. de Kort, What you set is (not) what you get: How a light intervention in the field translates to personal light exposure, Building and Environment, 185 (2020) 107288. https://doi.org/10.1016/j.buildenv.2020.107288
- J. Phipps-Nelson, J. R. Redman, D.-J. Dijk and S. M. W. Rajaratnam, Daytime Exposure to Bright Light, as Compared to Dim Light, Decreases Sleepiness and Improves Psychomotor Vigilance Performance, Sleep, 26(6) (2003) 695-700. https://doi.org/10.1093/sleep/26.6.695
- J. Wienold and J. Christoffersen, Evaluation methods and development of a new glare prediction model for daylight environments with the use of CCD cameras, Energy and Buildings, 38(7) (2006) 743-757. https://doi.org/10.1016/j.enbuild.2006.03.017
- Swedish Institute for Standards, SS-EN 12464-1:2021 Light and lighting - Lighting of work places - Part 1: Indoor work places, (2021) 244. Retrieved from: https://www.sis.se/en/produkter/construction-materials-and-building/lighting/interior-lighting/ss-en-12464-12021-f17a3ebb/.
- M. E. Kompier, K. C. H. J. Smolders, R. P. Kramer, W. D. van Marken Lichtenbelt and Y. A. W. de Kort, Contrasting dynamic light scenarios in an operational office: Effects on visual experience, alertness, cognitive performance, and sleep, Building and Environment, 212 (2022) 108844.
- A. Borisuit, F. Linhart, J. L. Scartezzini and M. Münch, Effects of realistic office daylighting and electric lighting conditions on visual comfort, alertness and mood, Lighting Research & Technology, 47(2) (2014) 192-209. https://doi.org/10.1177/1477153514531518
- Z. Hamedani, E. Solgi, H. Skates, T. Hine, R. Fernando, J. Lyons and K. Dupre, Visual discomfort and glare assessment in office environments: A review of light-induced physiological and perceptual responses, Building and Environment, 153 (2019) 267-280. https://doi.org/10.1016/j.buildenv.2019.02.035
- C. Pierson, J. Wienold and M. Bodart, Review of Factors Influencing Discomfort Glare Perception from Daylight, LEUKOS, 14(3) (2018) 111-148. https://doi.org/10.1080/15502724.2018.1428617
- F. Chi, Y. Wang, R. Wang, G. Li and C. Peng, An investigation of optimal window-to-wall ratio based on changes in building orientations for traditional dwellings, Solar Energy, 195 (2020) 64-81. https://doi.org/10.1016/j.solener.2019.11.033
- H. Shen, A. Tzempelikos, A. M. Atzeri, A. Gasparella and F. Cappelletti, Dynamic Commercial Façades versus Traditional Construction: Energy Performance and Comparative Analysis, Journal of Energy Engineering, 141(4) (2015). https://doi.org/10.1061/(ASCE)EY.1943-7897.0000225
- Y. Jia, Z. Liu, Y. Fang, H. Zhang, C. Zhao and X. Cai, Effect of Interior Space and Window Geometry on Daylighting Performance for Terrace Classrooms of Universities in Severe Cold Regions: A Case Study of Shenyang, China, Buildings, 13(3) (2023) 603. https://doi.org/10.3390/buildings13030603
- M. Heirani Pour, R. Fayaz and M. Mahdavinia, Optimization of Window Dimensions Regarding Light and Heat Parameters in Residential Buildings of Cold Climate; Case Study: Ilam City, Armanshahr Architecture & Urban Development, 14(35) (2021) 91-101.
- S. M. Mousavi, T. H. Khan and L. Y. Wah, Impact of furniture layout on indoor daylighting performance in existing residential buildings in Malaysia, Journal of Daylighting, 5(1) (2018) 1-63. https://doi.org/10.15627/jd.2018.1
- P. Khademagha, Light directionality in design of healthy offices, Technische Universiteit Eindhoven: Eindhoven, 2021.
- E. R. Stothard et al., Circadian Entrainment to the Natural Light-Dark Cycle across Seasons and the Weekend, Current Biology, 27(4) (2017) 508-513. https://doi.org/10.1016/j.cub.2016.12.041
- R. Sithravel, R. Ibrahim, M. S. Lye, E. K. Perimal, N. Ibrahim and N. D. Dahlan, Morning boost on individuals' psychophysiological wellbeing indicators with supportive, dynamic lighting in windowless open-plan workplace in Malaysia, PLOS ONE, 13(11) (2018) 1-28. https://doi.org/10.1371/journal.pone.0207488
- K. C. H. J. Smolders, Y. A. W. de Kort and S. M. van den Berg, Daytime light exposure and feelings of vitality: Results of a field study during regular weekdays, Journal of Environmental Psychology, 36 (2013) 270-279. https://doi.org/10.1016/j.jenvp.2013.09.004
- M. A. M. Yusoff, J. Ahmad, A. N. Mansor, R. Johari, K. Othman and N. C. Hassan, Evaluation of School Based Assessment Teacher Training Programme, Creative Education, 07(04) (2016) 627-638. https://doi.org/10.4236/ce.2016.74065
- E. Jalilzadehazhari, P. Johansson, J. Johansson and K. Mahapatra, Developing a decision-making framework for resolving conflicts when selecting windows and blinds, Architectural Engineering and Design Management, 15(5) (2019) 357-381. https://doi.org/10.1080/17452007.2018.1537235
- E. Jalilzadehazhari, G. Pardalis, J. Johansson and P. Johansson, Application of multi-objective optimization for resolving conflicts when selecting windows, in: The 9th International Conference on Sustainable Development in the Building and Environment, Cambridge, UK, (28 07 2019).
- SOLEMMA ClimateStudio v1.9.8389.21977 Retrieved from: https://www.solemma.com/climatestudio.
- M. Gkaintatzi-Masouti, C. Pierson, J. Van Duijnhoven, M. Andersen and M. Aarts, A simulation tool for building and lighting design considering ipRGC-influenced light responses, E3S Web of Conferences, 362, (2022) 01001. https://doi.org/10.1051/e3sconf/202236201001
- M. Andersen, J. Mardaljevic and S. W. Lockley, A framework for predicting the non-visual effects of daylight - Part I: photobiology- based model, Lighting Research & Technology, 44(1), (2012) 37-53. https://doi.org/10.1177/1477153511435961
- M. Inanici, M. Brennan and E. Clark, Spectral Lighting Simulations: Computing Circadian Light, in: Proceedings of Building Simulation 2015: 14th Conference of IBPSA, (2015/December), pp. 1245-1252. https://doi.org/10.26868/25222708.2015.2467
- CIE, Spatial Distribution of Daylight - CIE Standard General Sky, (CIE S 011/E:2003 (ISO 15469:2004)), (2016). Retrieved from: https://store.accuristech.com/cie/standards/cie-s-011-e-2003-iso-15469-2004?product_id=1210088
- R. Perez, P. Ineichen, R. Seals, J. Michalsky and R. Stewart, Modeling daylight availability and irradiance components from direct and global irradiance, Solar Energy, 44(5), (1990) 271-289. https://doi.org/10.1016/0038-092X(90)90055-H
- M. Maskarenj, B. Deroisy and S. Altomonte, A new tool and workflow for the simulation of the non-image forming effects of light, Energy and Buildings, 262, (2022). https://doi.org/10.1016/j.enbuild.2022.112012
- Munsell Color Science Laboratory, Excel Daylight Series Calculator, (2002). Retrieved from: http://www.ritmcsl.org/UsefulData/DaylightSeries.xls.
- G. n. Wyszecki and W. S. Stiles, Color science : concepts and methods, quantitative data and formulae, John Wiley & Sons: New York, 2000.
- L. G. Ward and R. Shakespeare, Rendering with Radiance : the art and science of lighting visualization, Morgan Kaufmann Publishers: San Francisco, California, 1998.
- Spectral Materials Database Retrieved from: https://spectraldb.com/.
- C. Pierson, M. Aarts and M. Andersen, Validation of spectral simulation tools for the prediction of indoor daylight exposure, in: Building Simulation Conference Proceedings, (2021), pp. 2522-2708. https://doi.org/10.26868/25222708.2021.30583
- S. He, Y. Yan and H. Cai, Improving the accuracy of circadian lighting simulation with field measurement, Journal of Building Performance Simulation, 15(5), (2022) 575-598. https://doi.org/10.1080/19401493.2022.2071466
- C. E. Ochoa, M. B. C. Aries, E. J. Van Loenen and J. L. M. Hensen, Considerations on design optimization criteria for windows providing low energy consumption and high visual comfort, Applied Energy, 95, (2012) 238-245. https://doi.org/10.1016/j.apenergy.2012.02.042
- C. F. Reinhart and O. Walkenhorst, Validation of dynamic RADIANCE-based daylight simulations for a test office with external blinds, Energy and Buildings, 33(7), (2001) 683-697. https://doi.org/10.1016/S0378-7788(01)00058-5
2383-8701/© 2025 The Author(s). Published by solarlits.com. This is an open access article distributed under the terms and conditions of the Creative Commons Attribution 4.0 License.

3462
Total views
Citations
SHARE ON


