Article | 18 January 2026
Volume 13 Issue 1 pp. 44-56 • doi: 10.15627/jd.2026.3
Optimizing Window-to-Floor Ratio and Glazing for Daylight and Cooling in Tropical Educational Buildings: A Case Study in Chiang Mai, Thailand
Ting Way Lim, Yuttana Tongtuam,* Nawit Ongsavangchai
Author affiliations
Faculty of Architecture, Chiang Mai University, Chiang Mai, Thailand
*Corresponding author.
limtingway@outlook.com (T. Lim)
yuttana.t@cmu.ac.th (Y. Tongtuam)
nawit.ong@cmu.ac.th (N. Ongsavangchai)
History: Received 19 September 2025 | Revised 3 November 2025 | Accepted 13 November 2025 | Published online 18 January 2026
2383-8701/© 2026 The Author(s). Published by solarlits.com. This is an open access article distributed under the terms and conditions of the Creative Commons Attribution 4.0 License.
Citation: Ting Way Lim, Yuttana Tongtuam, Nawit Ongsavangchai, Optimizing Window-to-Floor Ratio and Glazing for Daylight and Cooling in Tropical Educational Buildings: A Case Study in Chiang Mai, Thailand, Journal of Daylighting, 13:1 (2026) 44-56. doi: 10.15627/jd.2026.3
Figures and tables
Abstract
In tropical climates, where cooling loads dominate building energy use, minimizing cooling demand is particularly critical for achieving carbon neutrality in educational buildings while maintaining adequate daylight and visual comfort. This study investigated the combined effects of the Window-to-Floor Ratio (WFR), Visible Light Transmission (VLT), and Solar Heat Gain Coefficient (SHGC) on building performance through parametric simulations using ClimateStudio. A university classroom in Chiang Mai, Thailand, served as a case study with a baseline configuration of 30% WFR and SHGC 0.82, which is representative of conventional tropical classroom designs. Twenty retrofit scenarios were modelled by varying the WFR (30%, 25%, 20%, 15%, and 10%) and VLT (88%, 77%, 66%, and 56%) with SHGC (0.82, 0.62, 0.53, and 0.61), respectively. Each scenario was evaluated for estimated CO₂ emissions from cooling energy intensity, surface solar exposure, spatial Daylight Autonomy (sDA), and annual sunlight exposure (ASE) using radiance-based daylight analysis simulations. Thermal simulations were not conducted; instead, solar radiation was used as a proxy for cooling demand. The results indicate that optimized configurations (e.g., WFR 20-25% with SHGC 0.53) lower surface solar exposure by over 40% and cooling-related CO₂ emissions by approximately 30% compared to the baseline, while maintaining high daylight availability (sDA ≥ 96%). This approach offers preliminary insights for facade optimization aimed at passive cooling and sustainable energy use, though it lacks the precision of dynamic thermal modeling and should be interpreted with caution. The findings support Sustainable Development Goals 7 (Affordable and Clean Energy), 11 (Sustainable Cities and Communities), and 13 (Climate Action), offering practical guidance for architects and engineers in designing climate-responsive, carbon-neutral educational buildings in hot-humid regions.
Keywords
tropical climate design, educational architecture, window-to-floor ratio, solar heat gain coefficient, building daylight simulation
Nomenclature
| ASE | Annual Sunlight Exposure (%) |
| DF | Daylight Factor (%) |
| sDA | Spatial Daylight Autonomy (%) |
| SHGC | Solar Heat Gain Coefficient (-) |
| VLT | Visible Light Transmittance (%) |
| WFR | Window-to-Floor Ratio (%) |
| WWR | Window-to-Wall Ratio (%) |
1. Introduction
Achieving carbon neutrality in the built environment is a pressing global challenge, particularly in regions with hot and humid climates where cooling energy demand dominates operational energy use [1], and where the application of passive cooling strategies is critical [2]. Educational buildings, which often operate during peak daylight hours and accommodate large numbers of occupants, present unique opportunities for passive design strategies to reduce energy consumption while maintaining the indoor environmental quality. This study introduced a validated simulation-based framework that integrates climate-based daylight metrics and solar exposure analysis to provide actionable guidance for optimizing this balance in tropical educational buildings.
Although the interplay between daylighting and building energy performance has been explored in various climates, its application in tropical educational buildings requires further development.
Studies [3] have investigated facade optimization for office buildings in the tropics, and others [4] have examined shading strategies. While multi-objective optimization has been successfully applied to integrate daylighting and energy performance in various building types [5], and the critical role of glazing properties is well established [6], a focused parametric framework for tropical educational buildings [7] utilizing climate-based daylight metrics [8] remains a necessary contribution, particularly for early stage design where rapid feedback is crucial. This study aims to fill this gap by providing a simulation-based framework for early-stage design decision-making.
In tropical regions, such as Chiang Mai, Thailand, conventional classroom designs typically feature high Window-to-Floor Ratios (WFR) and clear glazing with high Solar Heat Gain Coefficients (SHGC), which contribute to excessive solar heat gains and elevated cooling loads [9]. Although such designs may enhance daylight penetration, they often compromise the thermal comfort and energy efficiency [10]. Prior studies have explored the role of daylighting in educational spaces [11-14], whereas others have examined the thermal performance of tropical buildings [1,15,16]. However, few studies have integrated daylight and thermal considerations [12] into a parametric framework tailored to tropical educational contexts.
This study addresses this gap by investigating the combined effects of WFR and SHGC on building performance using ClimateStudio, a simulation tool that integrates radiance-based daylight analysis and solar radiation modeling. A university classroom in Chiang Mai served as a case study, representing the typical architectural characteristics and usage patterns found in the region. Unlike previous research, which often isolates daylight or thermal performance, this study evaluates both aspects to concurrently identify facade configurations that balance daylight autonomy, glare risk, and cooling demand.
By identifying the optimal combination of WFR and SHGC, this study provides actionable design guidance for architects and engineers seeking to enhance building performance in tropical educational settings. The findings contribute to the broader discourse on sustainable architecture and support global efforts aligned with the United Nations Sustainable Development Goals (SDGs), particularly SDG 7 (Affordable and Clean Energy), SDG 11 (Sustainable Cities and Communities), and SDG 13 (Climate Action).
1.1. Objectives
This study aims to address the challenge of achieving a carbon-neutral design in tropical educational buildings by evaluating facade configurations that balance daylight performance and cooling demand. The specific objectives are:
- To quantify the impact of varying Window-to-Floor Ratios (WFR), Visible Light Transmission (VLT), and Solar Heat Gain Coefficients (SHGC) on daylight autonomy, glare risk, and solar heat gain in a tropical classroom setting using simulation-based analysis.
- To identify optimal facade configurations that simultaneously enhance daylight availability and reduce cooling-related carbon emissions, supporting passive cooling strategies in hot-humid climates.
- To assess the performance of commercially available glazing models across multiple WFR scenarios, offering a practical and accessible alternative to dynamic thermal simulation tools during early-stage design and retrofit evaluations.
- Contribution to climate-responsive design practices that align with the United Nations Sustainable Development Goals (SDGs), particularly SDG 7 (Affordable and Clean Energy), SDG 11 (Sustainable Cities and Communities), and SDG 13 (Climate Action)
2. Methodology
This study employed a simulation-based methodology [17] to evaluate the impact of WFR, VLT, and SHGC on the daylight performance and potential cooling demand in a tropical educational building.
2.1. Case study description
The simulation study was based on a typical university classroom located in Chiang Mai, Thailand (18.79°N, 98.98°E), which is characterized by a hot and humid tropical climate. The selected room had a high WFR of 30%, which is consistent with the conventional educational building designs in the region. The glazing type in the baseline scenario had a VLT of 88% and an SHGC of 0.82, representing the economic choices that are commonly used in tropical classrooms, as shown in Fig. 1.
Figure 1
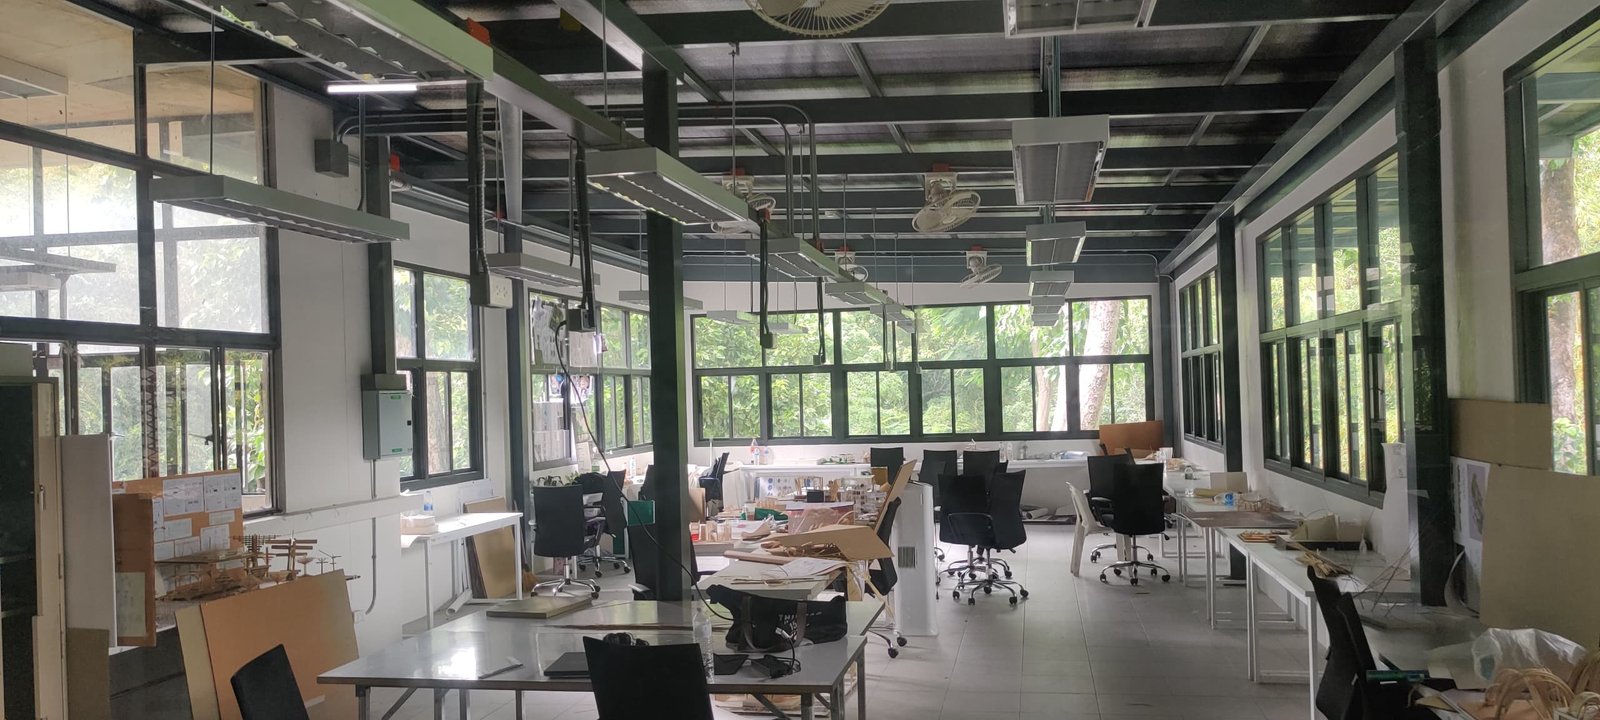
Fig. 1. Case study site photo.
The internal layout of the room was measured at 400.3 m², as shown in Fig. 2. A summary of the areas and window schedules shown in Fig. 3, is as follows: one swinging door and one operable window facing north. One swinging door with three operable windows facing east. Two swinging doors and six operable windows facing southwest. One operable window faces the northwest. One operable window facing northeast.
Figure 2
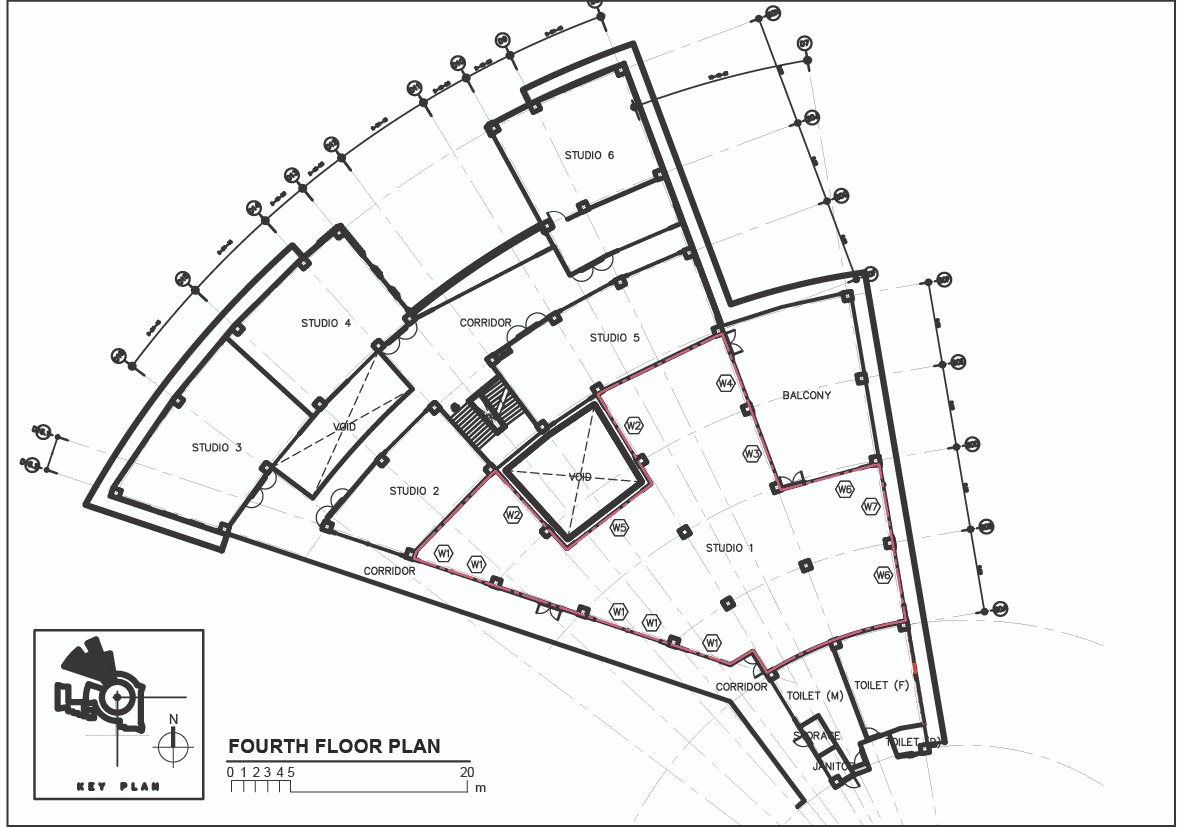
Fig. 2. Case study room floor plan.
Figure 3
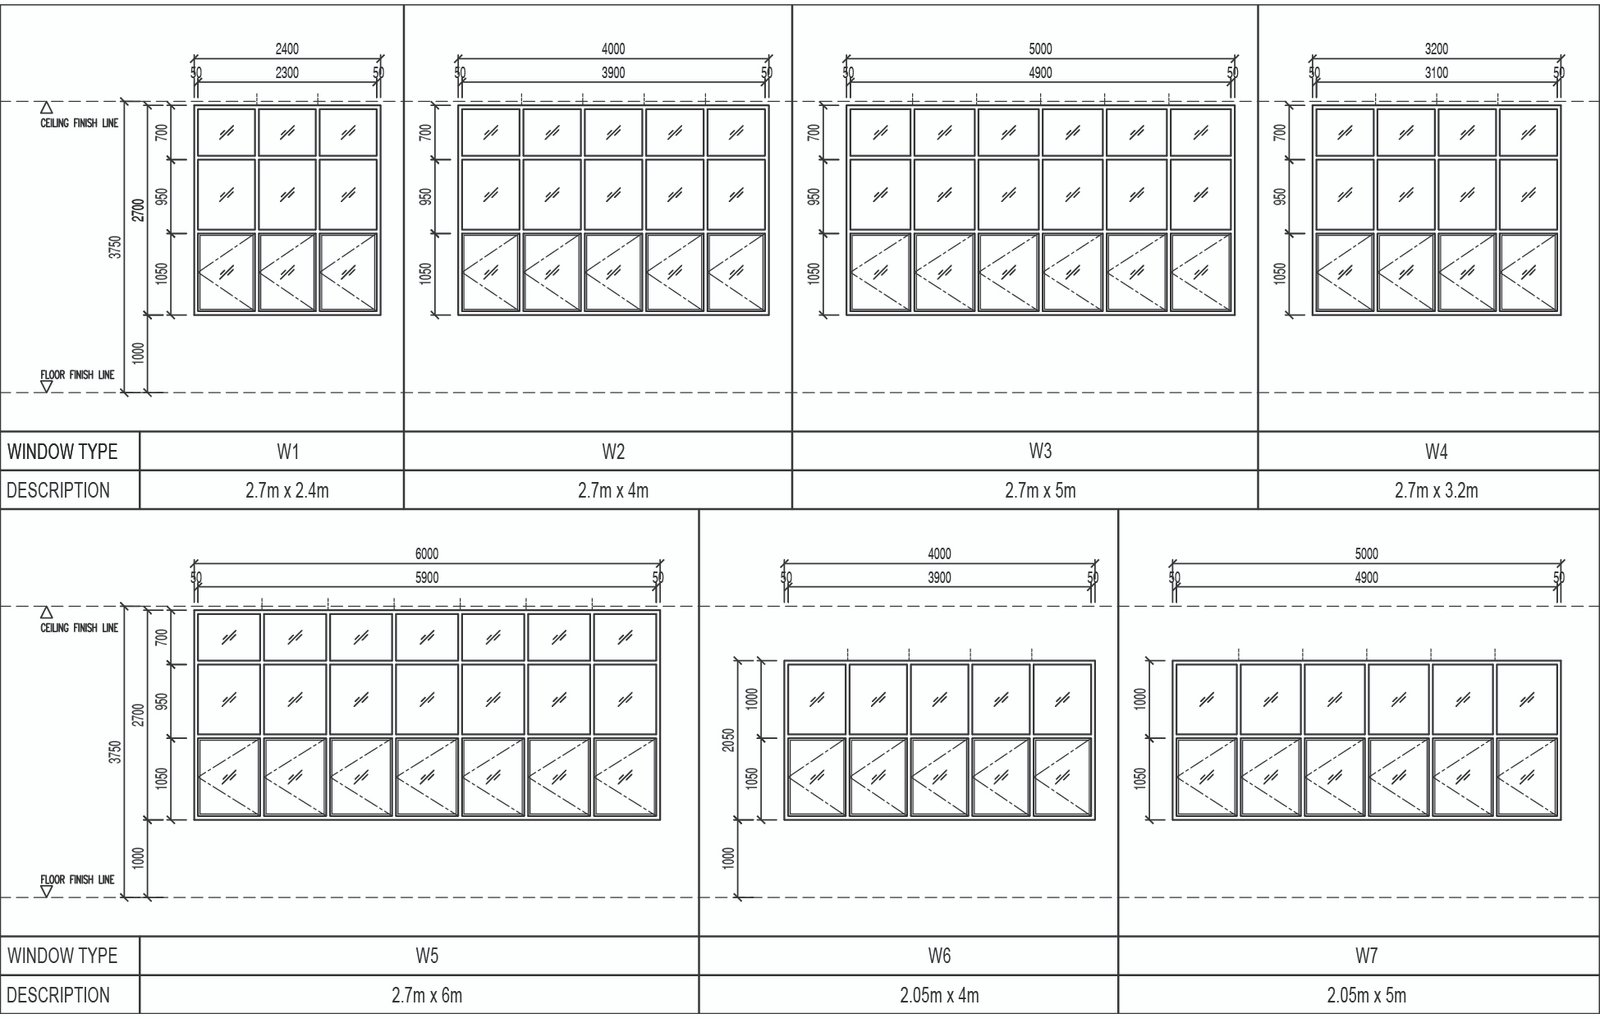
Fig. 3. Window schedule and dimension for case study room.
2.2. Simulation tool
Parametric simulations were conducted using ClimateStudio, which is a Rhino-based building performance analysis tool. ClimateStudio integrates radiance for daylight simulation and solar radiation analysis, thereby enabling comprehensive evaluation of daylight metrics and solar heat gain potential [18]. This tool was selected for its ability to model Spatial Daylight Autonomy (sDA), Annual Sunlight Exposure (ASE), and Surface Solar Exposure with high spatial and temporal resolution [19]. The simulations utilized a standard Typical Meteorological Year (TMY) climate file and EnergyPlus weather file (.epw) for Chiang Mai, Thailand. All daylight simulations were conducted at a work plane height of 0.75 meters above the finished floor level, consistent with standard practice for desk height. The extended dataset enabled a more granular evaluation of the trade-offs between daylight quality, glare risk, and potential cooling demand across different WFR configurations.
2.3. Parametric simulation with glazing models and WFR variations
Twenty extended parametric simulation scenarios, including a case study, were conducted using four distinct glazing models with VLT values of 88%, 77%, 66%, and 56% and SHGC values of 0.82, 0.62, 0.53, and 0.61 across five WFR levels of 30%, 25%, 20%, 15%, and 10%, as shown in detailed section Fig. 4.
Figure 4
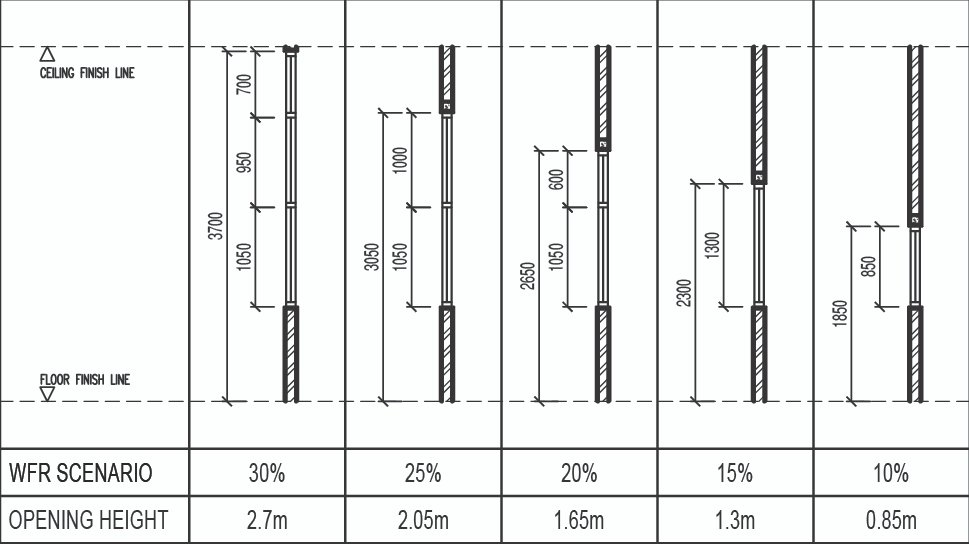
Fig. 4. A detailed section of the propose parametric simulation glazing model with each WFR scenario.
Twenty parametric simulation scenarios, summarized in Table 1, were conducted to assess their impact on daylight performance using Spatial Daylight Autonomy (SDA), Annual Sunlight Exposure (ASE), illuminance, and incident solar radiation on the glazing surfaces. These models represent a broad spectrum of commercially available glazing options that are suitable for tropical climates.
Table 1
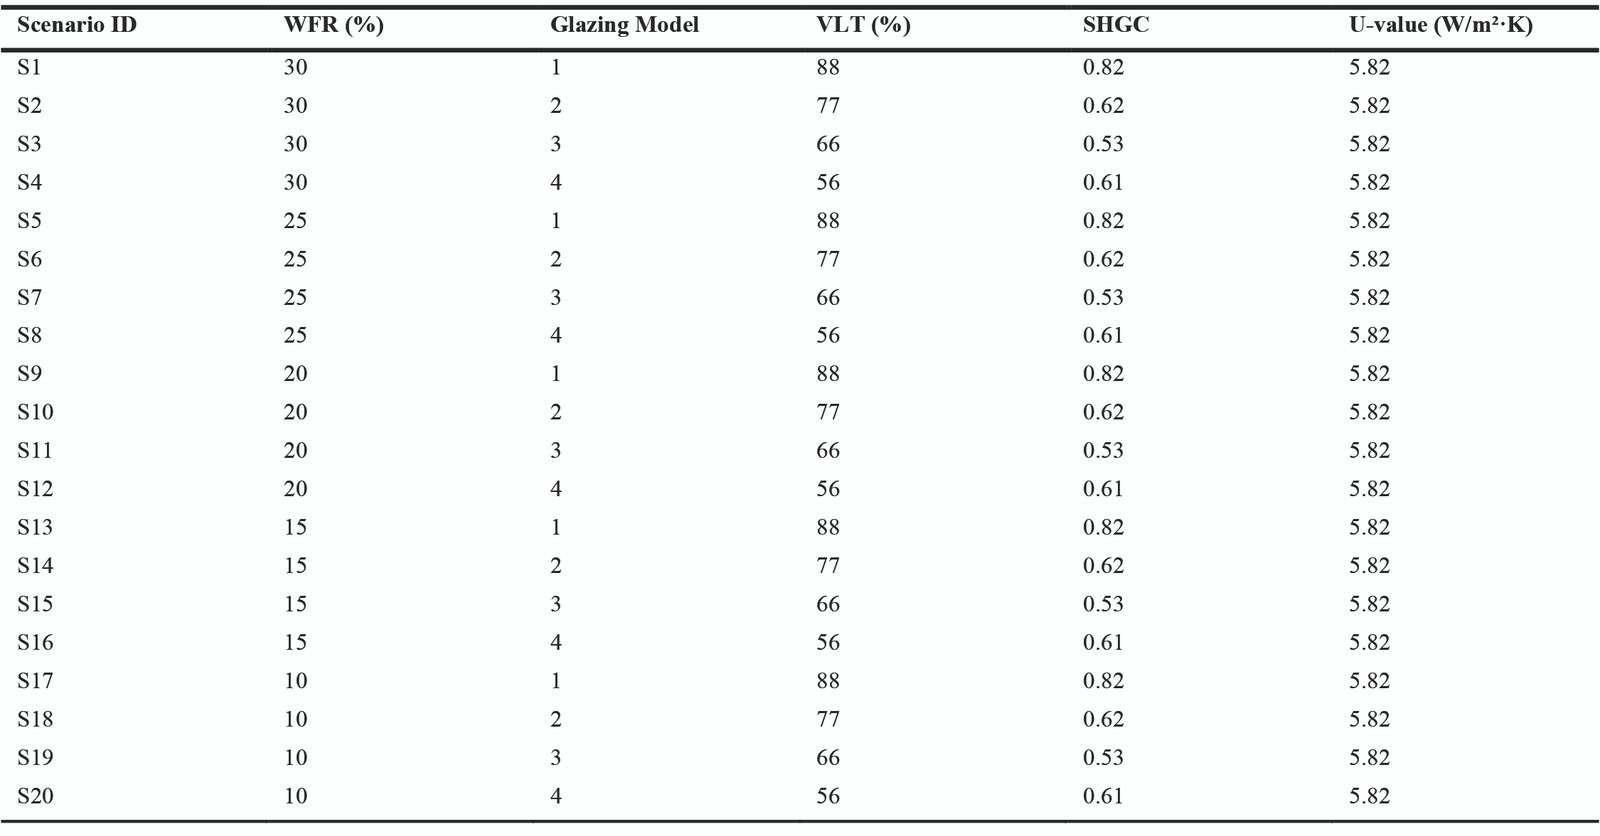
Table 1. Summary of the Twenty Parametric Scenarios Simulated.
2.4. Assessment metrics
The simulation outputs include key performance metrics such as estimated GHG emissions for cooling intensity (EFElec) in kgCO2e/m²·yr; Surface Solar Exposure (kWh/m²·yr), representing the total annual solar radiation received on internal surfaces, was used as the primary metric. This provides a robust proxy for comparative cooling load assessment in the early design stages, as solar heat gain through glazing is a dominant factor driving cooling energy consumption in tropical buildings [3]. While dynamic thermal simulation provides higher precision, this approach is computationally efficient and allows for the rapid screening of facade options. The other metrics evaluated include:
- Spatial Daylight Autonomy (sDA): the percentage of floor area receiving at least 300 lx of daylight for 50% of occupied hours annually.
- Annual Sunlight Exposure (ASE): the percentage of floor area that receives excessive sunlight annually, which may cause glare or overheating.
- Mean Illuminance (lx).
- Daylight Factor (DF): calculated under the standard CIE overcast sky condition.
- Illuminance Uniformity.
- Glazing properties: Visible Light Transmittance (VLT), U-value, and Solar Heat Gain Coefficient (SHGC).
By analyzing the interaction between glazing properties and WFR, this study identifies the optimal combinations that balance daylight performance with passive cooling potential. For example, Model 2 (VLT 0.77, SHGC 0.62) at a WFR of 25% achieves high daylight autonomy (sDA 99.3%), while significantly reducing electric lighting energy use and solar exposure compared to the baseline scenario.
2.5. Simulation assumptions
The simulations assumed static occupancy schedules and did not incorporate dynamic user behavior, adaptive comfort strategies, or real-time lighting controls. External shading devices and dynamic glazing technologies were excluded from analysis. The cooling demand was inferred from solar radiation values rather than simulated using dynamic thermal models such as EnergyPlus. Additionally, the study did not include a cost-benefit analysis or material validation through field measurements, which may have affected the generalizability of the findings.
2.6. Study scope and limitations
This study is explicitly scoped for the early-stage design phase, where rapid, comparative analysis of facade parameters is the most valuable. The methodological choices reflect this scope:
- Cooling Load Proxy: The use of solar radiation as a proxy for cooling demand is a recognized simplification suitable for comparing the relative performance of facade variants and isolating the impact of solar heat gain.
- Absence of Shading: Shading devices were excluded to clearly isolate the individual and combined effects of WFR and glazing properties, providing a foundational understanding before introducing more complex variables.
- Static Assumptions: Fixed occupancy and setpoint temperatures are standard assumptions for benchmarking building performance, and are consistent with the methodology of similar parametric studies.
- Although these limitations mean that the results are not absolute predictions of energy use, they are highly valuable for informing the design direction and identifying optimal parameter combinations relative to a baseline.
2.7. Model validation
To assess the reliability of the simulation model, a preliminary validation was conducted on-site using an illuminance lux meter (Data Logger GM1030) with an accuracy of ± 3% from 0 to 1,999 lx and ± 4% from 2,000 to 199,999 lx. Illuminance measurements were recorded on October 25, 2025, from 9:30am to 5:30pm under clear sky conditions, and measurement points were arranged on the 0.75m work plane in a grid pattern reflecting the sensor points used in the simulation model, as shown in Fig. 5. A comparison between the expected values from the simulation and the actual data is presented in Table 2. The simulated average illuminance value for the baseline model (WFR 30%, VLT 88%, SHGC 0.82) under identical conditions was 2097 lx, which showed a 12% deviation from the measured value of 1865 lx. According to Hirning and Isoardi [20] and the established CIE validation practice [21], a deviation of 10-15% between the simulated and measured illuminance is considered acceptable.
Figure 5
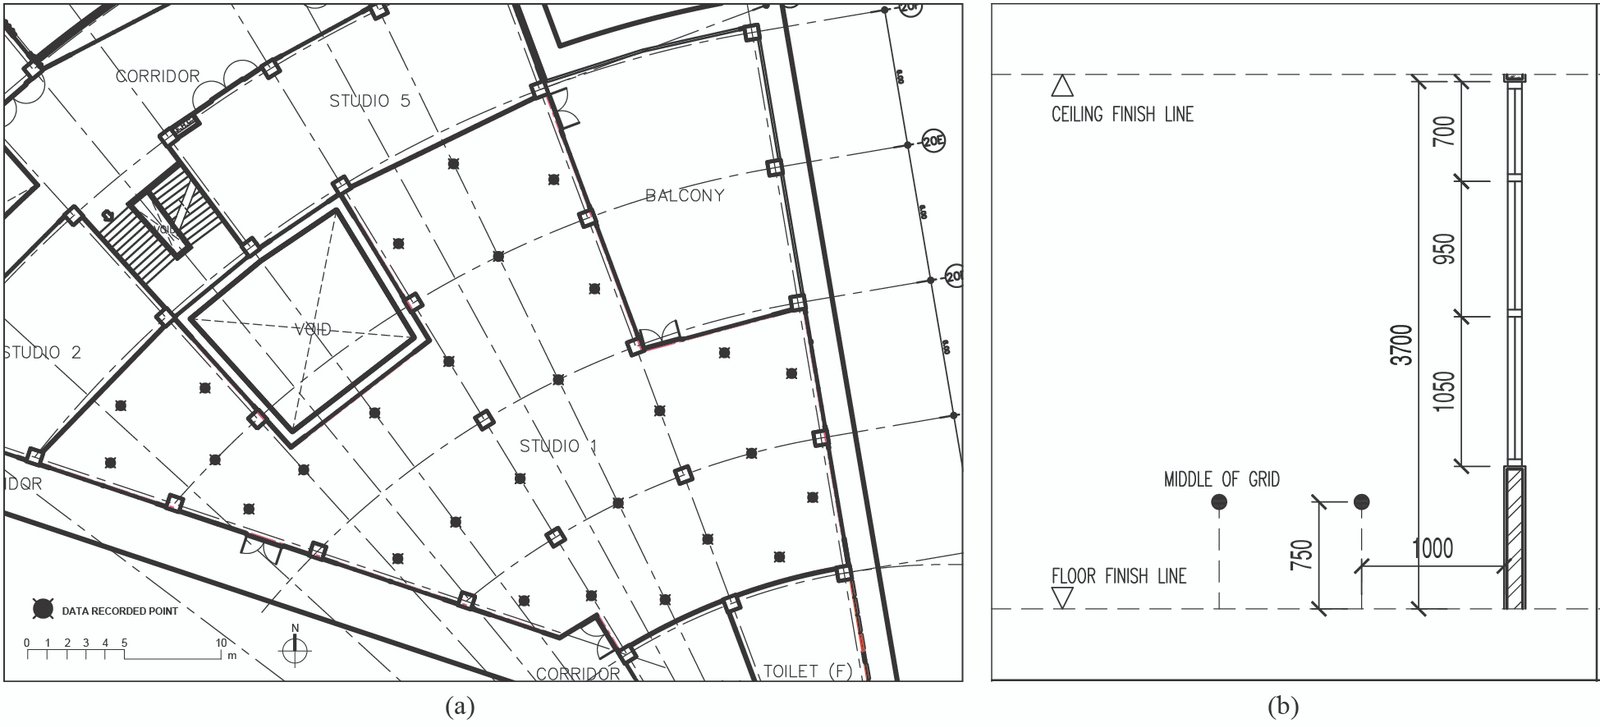
Fig. 5. (a) Validation test room measurement point setting diagram. (b) Validation test measurement point section details.
Table 2
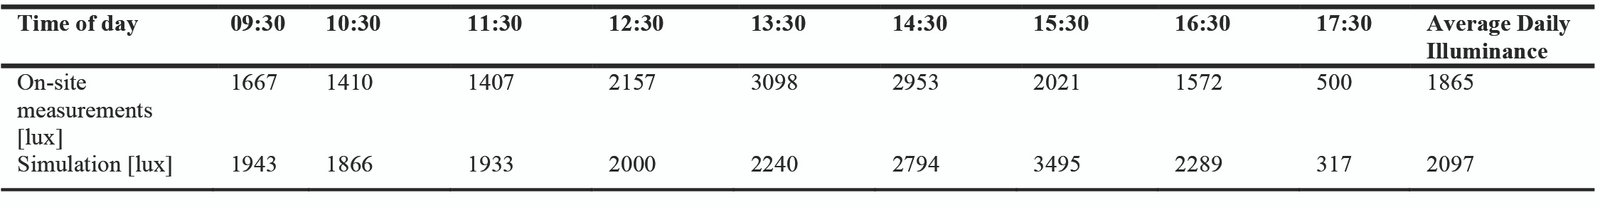
Table 2. Summary of calibrated results between on-site measurements and the anticipated simulation model.
This level of discrepancy is considered acceptable for a comparative parametric study of this nature, and aligns with the validation approaches used in similar field-validated simulation research [22], providing confidence in the relative accuracy of the simulation results across different scenarios. Therefore, the reliability of the model was considered satisfactory for the comparative parametric analysis.
3. Results and discussion
The simulation results were organized according to WFR and glazing configurations to evaluate their impact on daylight performance and potential cooling demand emissions, as shown in Table 3. Table 4 summarizes the key metrics across all parametric simulation scenarios at each WFR level. Figures 6-11, illustrate the trends across the WFR levels.
Table 3
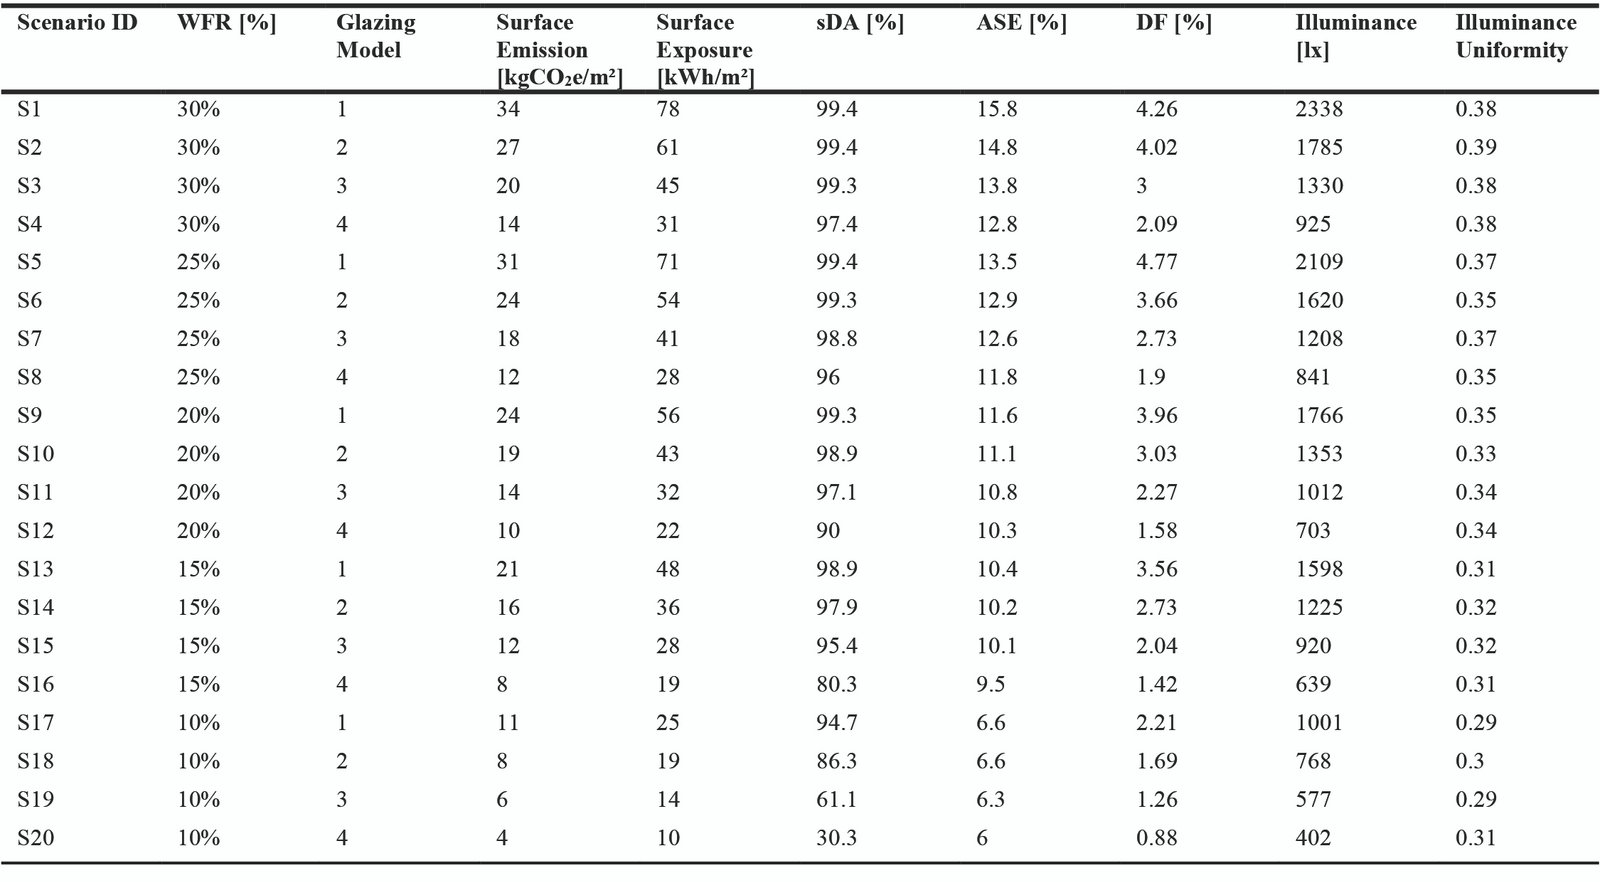
Table 3. The average performance metrics across all parametric simulation scenarios for each WFR level on simulation.
Table 4
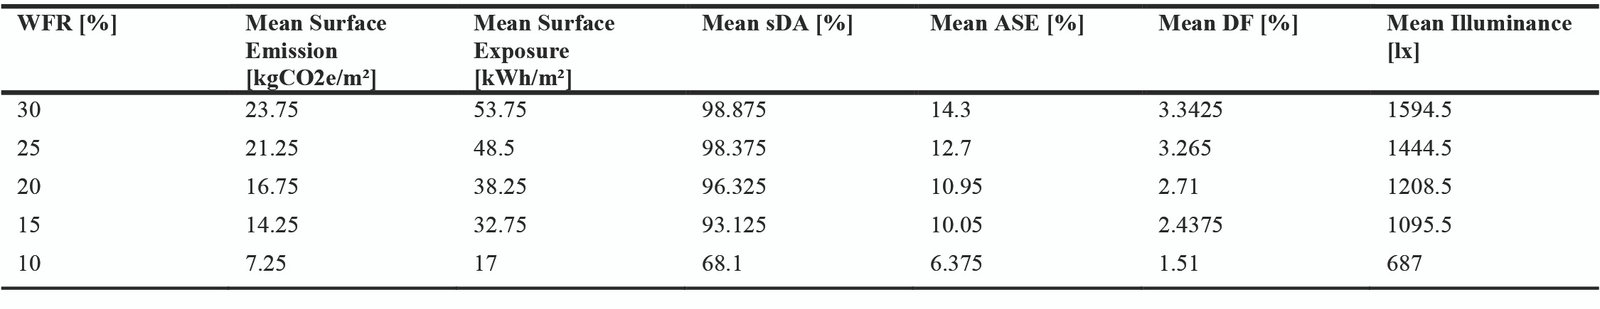
Table 4. The average performance metrics on each WFR level.
Figure 6
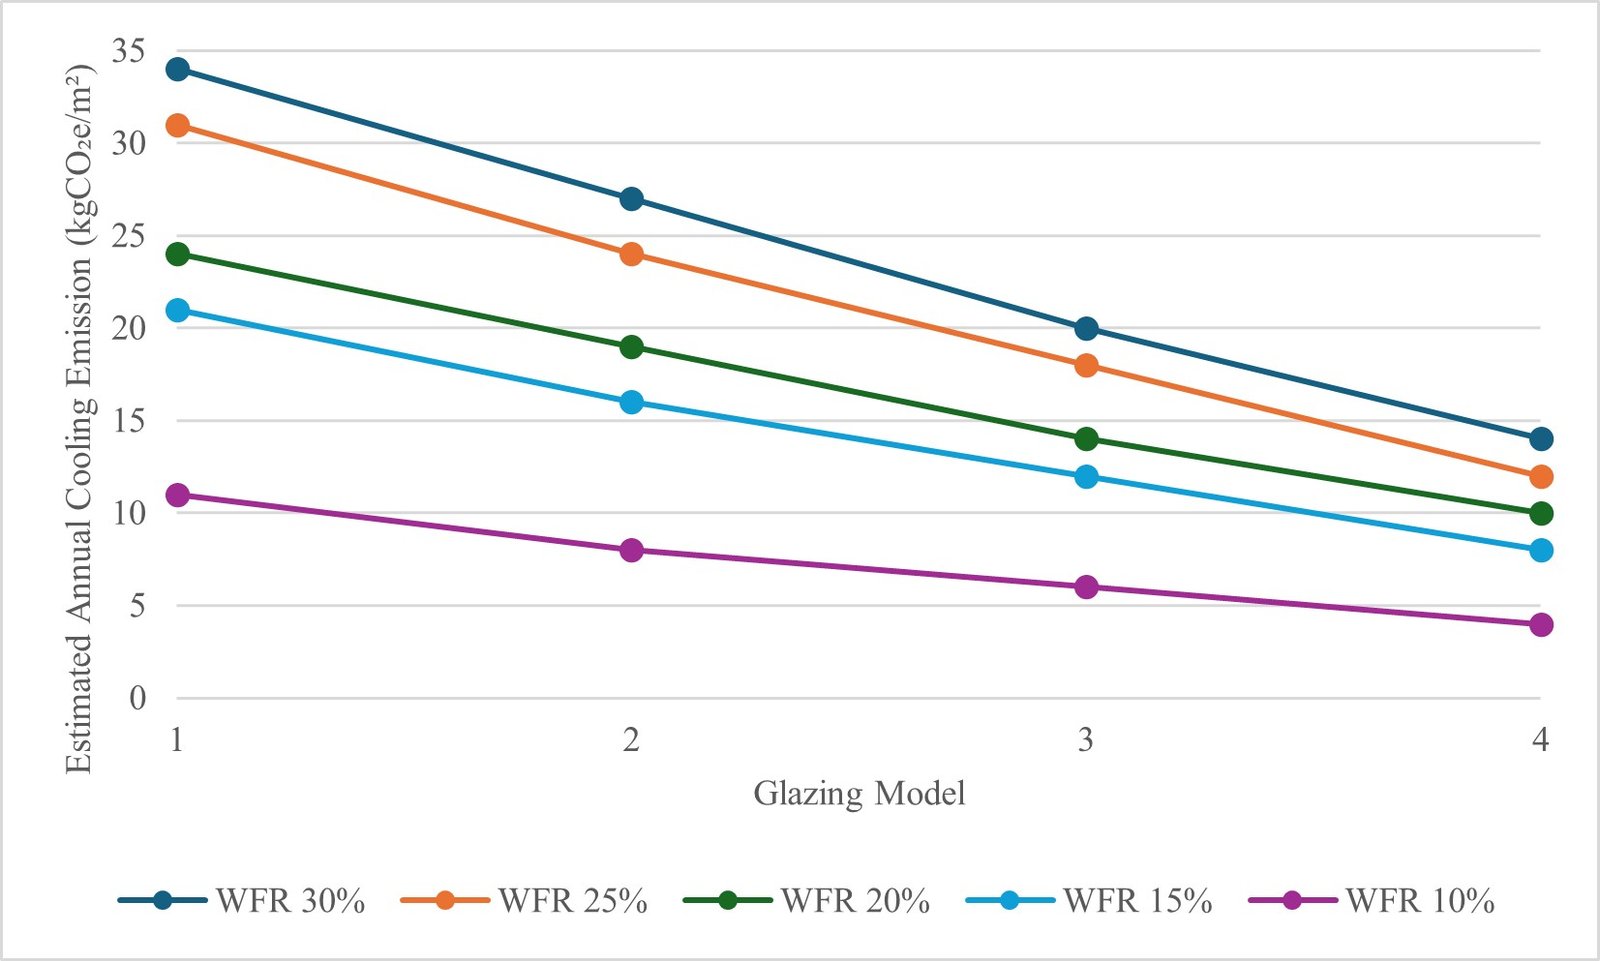
Fig. 6. Average annual cooling emissions across WFR levels, showing a strong linear decrease as the window area is reduced.
Figure 7
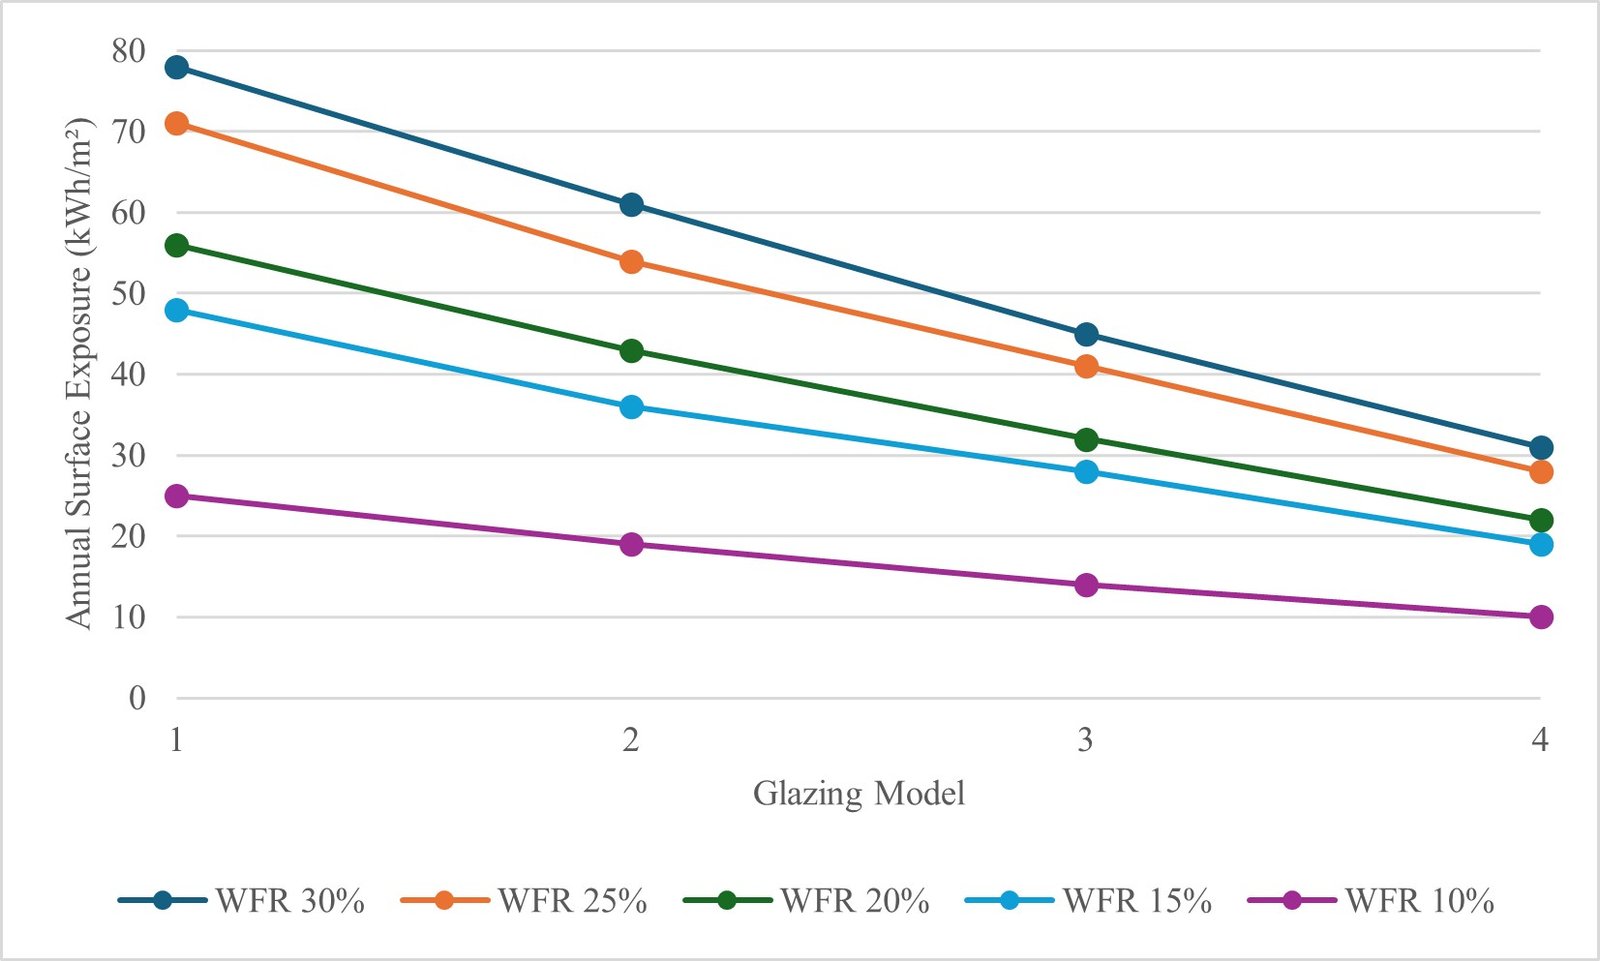
Fig. 7. Average annual surface solar exposure on internal surfaces, demonstrating a direct correlation with increasing WFR.
Figure 8
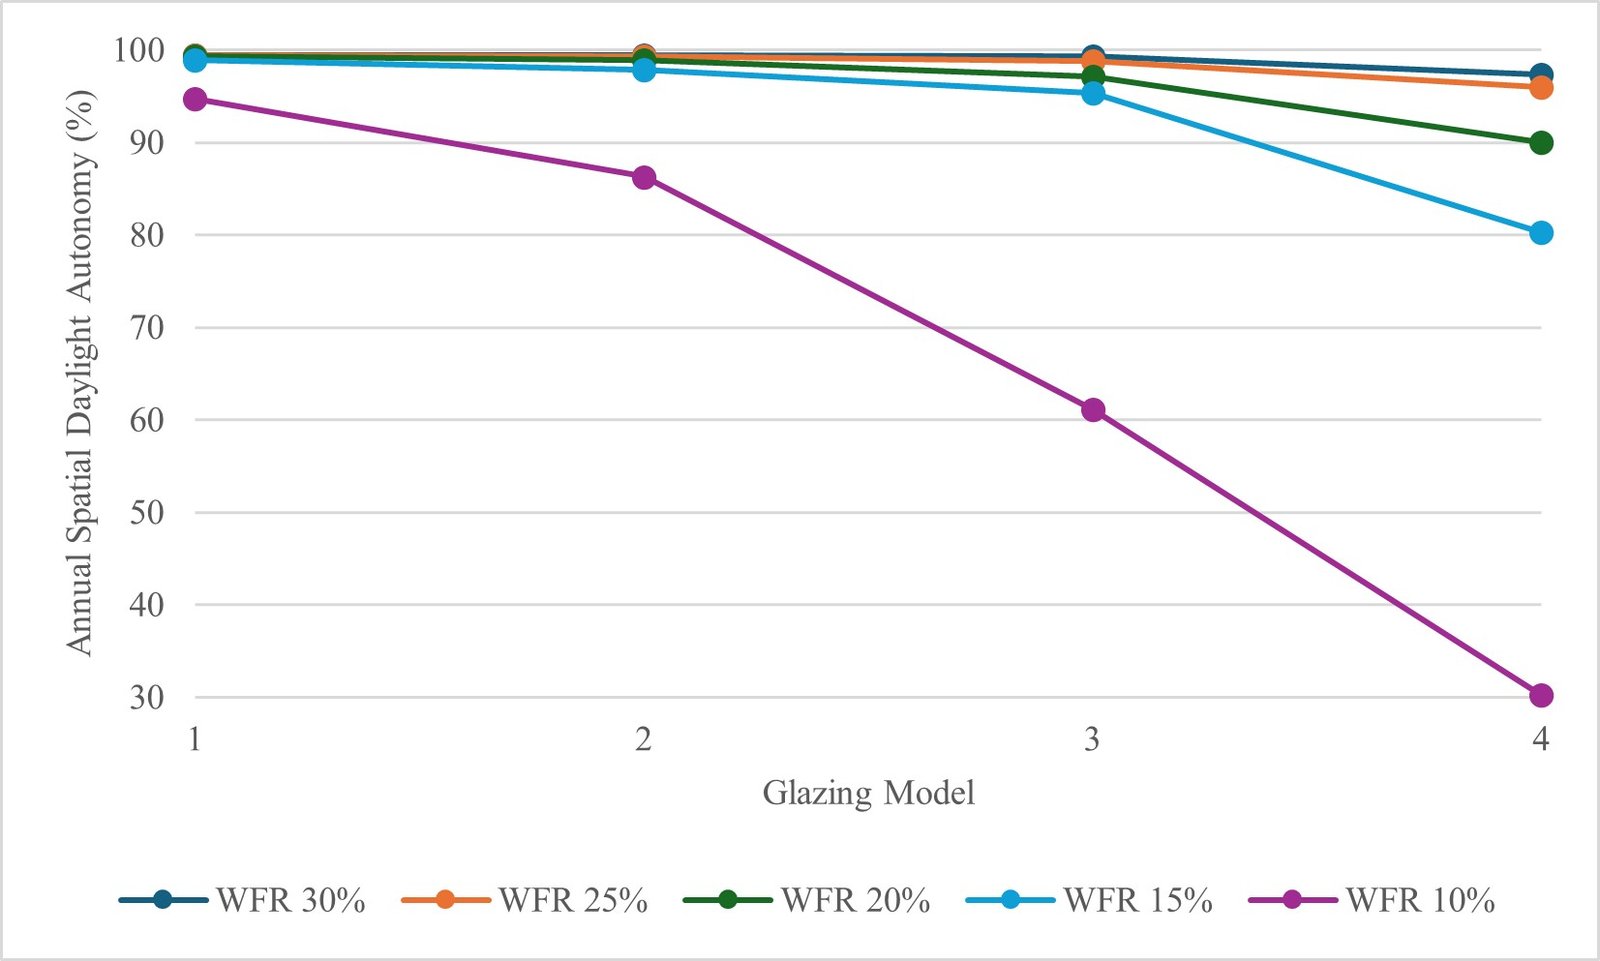
Fig. 8. Average annual Spatial Daylight Autonomy (sDA) across WFR levels. sDA plateaus at over 98% for WFRs above 20%.
Figure 9
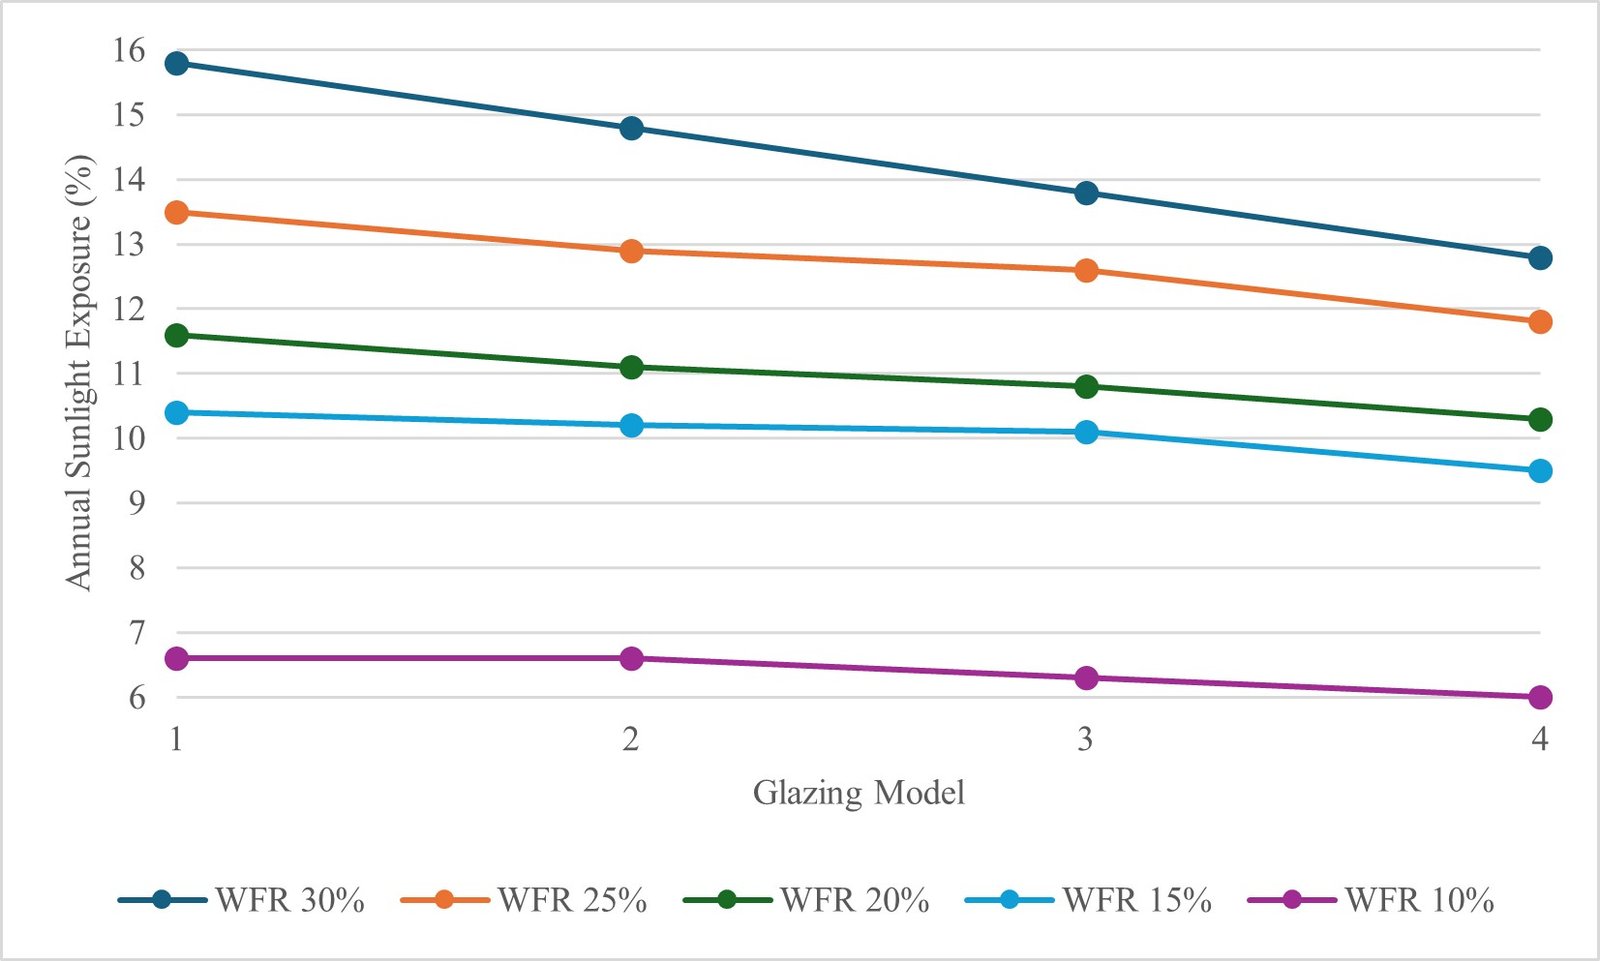
Fig. 9. Average Annual Sunlight Exposure (ASE) across WFR levels. ASE increases notably beyond a 20% WFR, indicating higher glare risk.
Figure 10
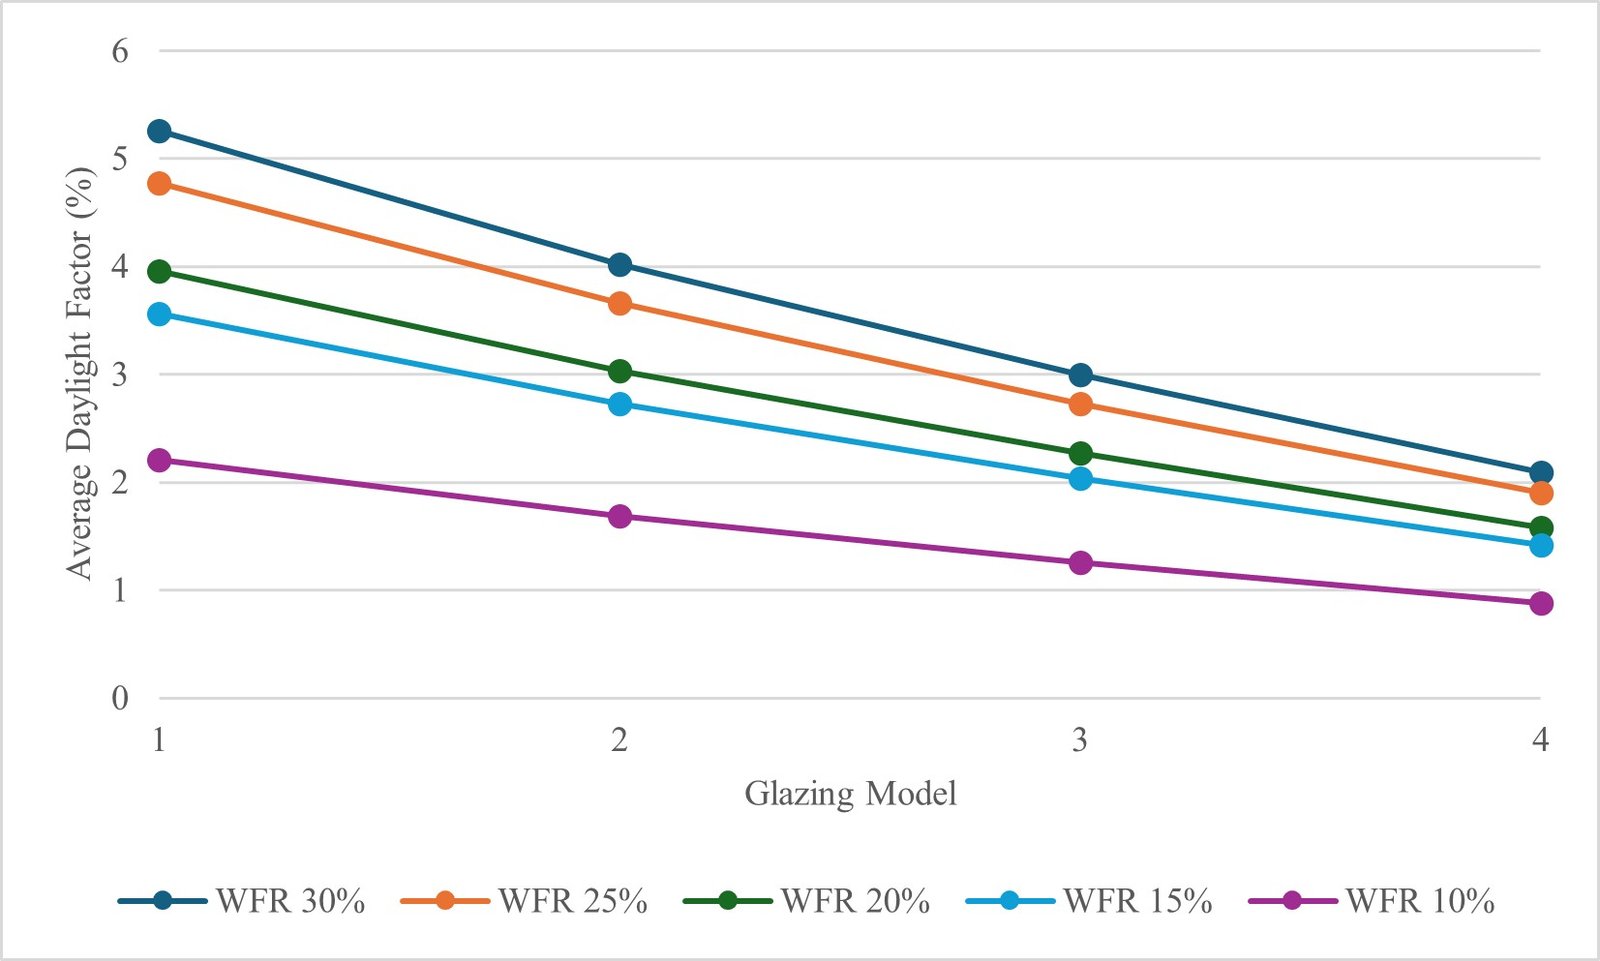
Fig. 10. Daylight Factor (DF) under Overcast Sky Conditions across WFR Levels.
Figure 11
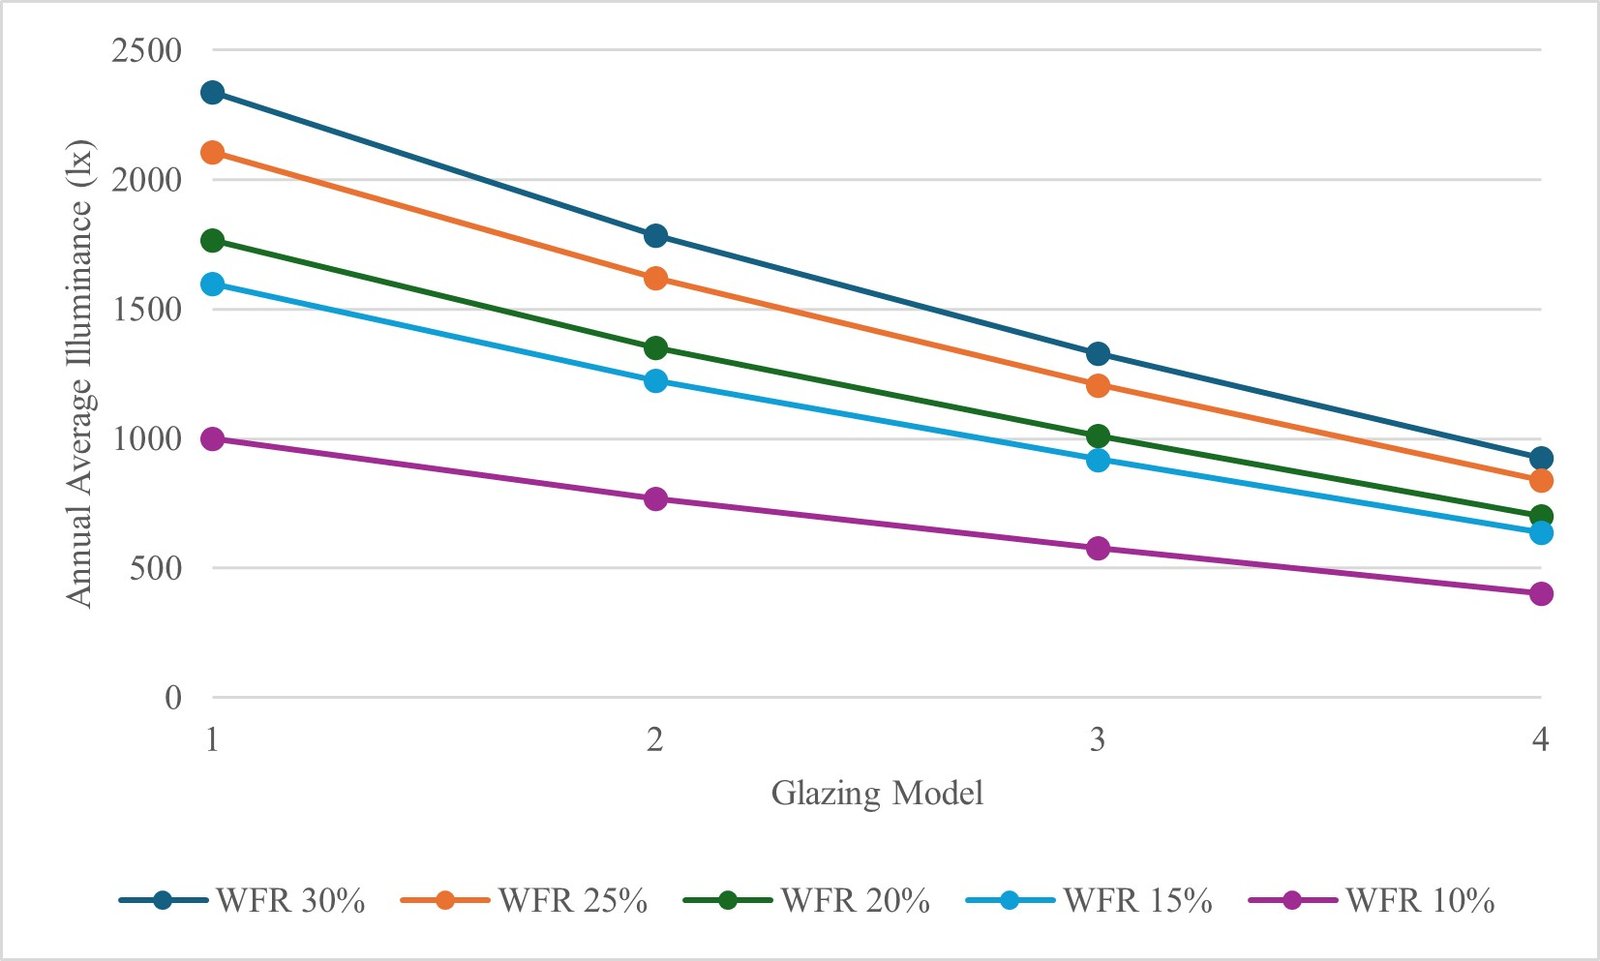
Fig. 11. Annual average illuminance across WFR levels, showing a near-linear increase with larger window areas.
Figure 6 shows the estimated cooling-related carbon emissions across the different WFR values for each glazing model. This trend highlights the direct relationship between glazing area and cooling demand: larger window areas allow more solar heat gain, increasing the energy required for cooling. As WFR decreases from 30% to 10%, the estimated annual cooling emissions drop significantly from approximately 23.75 kgCO₂e/m²·yr to 7.25 kgCO₂e/m²·yr on average as summarize in Table 4. Therefore, reducing WFR is an effective passive strategy for lowering operational carbon emissions in tropical classrooms.
Figure 7 shows the annual solar radiation incident on the internal surface of each glazing model. This confirms that larger glazing areas result in higher solar heat gain, reinforcing the need for careful facade design. In addition, Table 4 summarize that surface exposure increases with WFR, peaking at 53.75 kWh/m²·yr for WFR 30% on average. The data support the use of lower WFR and low-SHGC glazing to reduce the internal heat gain and improve the thermal performance.
Figure 8 shows that the sDA improves with increasing WFR for each glazing model, reaching nearly 99% at a WFR of 25-30%. This indicates that larger window areas provide better daylight coverage during occupied hours. However, the marginal gains in daylight performance beyond a WFR of 15% must be weighed against the corresponding increases in cooling demand and glare risk, as summarized in Table 4.
Figure 9, shows that the ASE also increased with the WFR for each glazing model, indicating an increased risk of glare and visual discomfort. ASE values exceeded acceptable thresholds of 10% beyond a WFR of 20%, as summarized in Table 4, suggesting that while daylight autonomy improves, visual comfort deteriorates. This trade-off emphasizes the importance of balancing daylight access with glare control in facade design.
Figure 10 shows that the DF increased with the WFR for each glazing model, reflecting the improved daylight penetration. However, excessively high DF values may lead to over illumination and discomfort. The results in Table 4 suggest that moderate WFR values (15-20%) provide sufficient daylight without excessive brightness, aligning with optimal visual comfort targets in educational settings.
Figure 11 shows the annual average illuminance levels across all the WFR scenarios. As expected, the illuminance increased with the WFR for each glazing model, with the highest values observed at a WFR of 30%. Although high illuminance supports visual tasks, it may also contribute to glare and overheating, as summarized in Table 4. The trendline demonstrated that an interchangeable performance between a high WFR level and a low SHGC model is achievable to balance the daylight sufficiency and thermal comfort.
3.1. Daylight analysis
The simulation results in Table 3 show that all scenarios maintained acceptable levels of daylight autonomy, with the sDA values exceeding 55% in most cases. The baseline S1 (WFR 30%, SHGC 0.82) configuration achieved the highest daylight autonomy of 99%, but also exhibited elevated levels of Annual Sunlight Exposure, indicating potential glare and overheating risks.
Reducing WFR to 15% (comparing S1 to S13-S15) led to a moderate decline in daylight autonomy (from 99.4% to 95.4%). However, selecting glazing with a lower SHGC significantly reduced ASE values (from 15.8% to 10.1%) to improve visual comfort. The results highlighted that the SHGC values between glazing models had a minimal impact on daylight autonomy, but contributed to reduced glare and overheating.
3.2. Solar exposure analysis
The incident solar radiation on the internal surface varied significantly across scenarios. Baseline case S1 recorded the highest annual solar radiation at approximately 78 kWh/m²·yr, whereas the most optimized scenario S20 (WFR 10%, VLT 56%, SHGC 0.61) reduced this to 10 kWh/m²·yr, representing an 87% reduction in potential heat gain.
This reduction suggests a substantial decrease in cooling demand, even though the exact energy values were not simulated. The correlation between lower WFR/VLT/SHGC and reduced solar radiation supports the effectiveness of facade optimization in tropical climates.
3.3. Discussion
The analysis, based on a simulation model validated with on-site measurements, confirms that increasing the WFR enhances daylight performance, but also raises cooling-related carbon emissions. The validated model reinforces the credibility of these findings and subsequent design recommendations. As the WFR increased, sDA improved significantly, reaching nearly 99% at a WFR of 25-30% in (S1-S7). However, this comes at the cost of higher surface solar exposure, which directly translates into increased cooling emissions rising from approximately 7.25 kgCO₂e/m²·yr at WFR 10% to 23.75 kgCO₂e/m²·yr at WFR 30%.
ASE also increased with WFR, indicating a greater glare potential and thermal discomfort. These trends suggest that, although larger glazing areas improve daylight access, they also intensify the building’s cooling burden and carbon footprint. The analysis identifies an optimal design compromise within the WFR range of 20-25% (e.g., Scenarios S7 and S11). Within this range, daylight autonomy remains excellent (sDA >96%), while cooling emissions and solar exposure are substantially lower approximately 20-30% reduced compared to the conventional 30% WFR baseline.
These reductions imply a lower operational energy use for air conditioning, contributing to carbon neutrality goals. Furthermore, consistent daylight uniformity across models suggests that energy savings can be achieved without compromising the visual comfort. These findings support the integration of passive cooling strategies and daylight-responsive lighting controls, enabling designers to reduce reliance on mechanical systems and enhance the overall building energy performance.
Despite the valuable insights provided by this simulation-based study, several limitations of this study must be acknowledged. The absence of dynamic thermal simulations restricts the precision of cooling load estimations because solar radiation is used as a proxy. The study also did not address the economic feasibility of the proposed retrofit strategies, leaving a gap in understanding their cost-effectiveness. Future research should incorporate dynamic thermal modeling tools such as EnergyPlus, conduct material validation through in situ measurements, and perform cost-benefit analyses to enhance the robustness and practical relevance of the design recommendations.
3.4. Tradeoff and design implications
Although reducing the WFR and SHGC improves the thermal performance, it may compromise daylight availability if not carefully balanced. The scenario with a WFR of 20% (S9-S12) emerged as a balanced solution, maintaining an sDA above 65% while reducing solar radiation by over 30% compared to the baseline.
These findings highlight the importance of integrated design strategies that consider both daylight and thermal performances. Architects and engineers should prioritize moderate WFR values for low-SHGC glazing to achieve energy-efficient and visually comfortable learning environments in tropical regions.
3.4.1. Balancing daylight and thermal performance
Higher WFRs and high-VLT glazing (S1, S5, S9) provided excellent daylight autonomy (sDA 99%) and high illuminance levels. However, they also result in a higher ASE and solar exposure, increasing the risk of glare and cooling loads. Hence, used high-WFR and high-VLT glazing only if glare control (e.g., shading devices) and efficient cooling systems were in place.
3.4.2. Glazing selection tradeoff
Model 1 (VLT 88%, SHGC 0.82) for S1, S5, S9, S13, and S17 was the best for daylight but the worst for thermal control in each WFR scenario. Model 4 (VLT 56%, SHGC 0.61) significantly reduced solar exposure and ASE but compromised daylight quality, especially on S20 with low WFR. Hence, glazing with moderate and low SHGC (e.g., Models 2 and 3) was used to balance daylight and passive cooling.
3.4.3. Optimal WFR range
WFRs between 15% and 20% offer a sweet spot where the sDA remains high on average ( 93%), ASE and solar exposure are significantly reduced, and mean illuminance is sufficient for classroom tasks. Therefore, a WFR of approximately 20% is recommended to achieve optimal performance without excessive cooling demand, whereas a WFR of 15% may be considered if minimizing the cooling load is the highest priority.
3.4.4. Illuminance uniformity
Uniformity remained stable across all models and WFRs (≈0.3-0.38), indicating a consistent light distribution. Hence, designers can focus more on controlling the brightness and glare than on uneven lighting.
3.4.5. Passive cooling strategy
Lower SHGC and WFR values directly reduced solar radiation from glazing across S1-S20. Hence, these parameters should be prioritized in passive cooling strategies, particularly in energy retrofits, in which HVAC upgrades are limited.
3.4.6. Influence of shading devices
While this study focused on the isolated effects of the WFR and glazing properties, the incorporation of shading devices is a critical next step in holistic facade design [16]. External shading, such as overhangs or vertical fins, could potentially allow for larger WFRs by controlling the direct solar gain and mitigating glare, thereby improving the ASE metrics observed in high-WFR scenarios. Future research should parametrically integrate the shading design variables to explore these synergistic effects.
4. Summary and recommendations
This study investigated the impact of varying the WFR and SHGC on daylight performance and potential cooling demand in a tropical classroom using parametric simulations in ClimateStudio. The results demonstrate that reducing both the WFR and SHGC significantly lowers the incident solar radiation on internal surfaces, which serves as a practical proxy for cooling load reduction in early stage designs. While higher WFR values enhance daylight autonomy, they also increase the solar heat gain and glare risk. Conversely, lower WFR and SHGC values reduce thermal loads, but may compromise daylight availability. Among the 20 scenarios analyzed, the configuration with WFR 15% and SHGC 0.53 offered the most balanced performance, maintaining adequate daylight while minimizing solar radiation exposure and estimated cooling-related carbon emissions.
4.1. Key findings summary
- Cooling Emissions: Reducing WFR from 30% to 10% lowers estimated cooling-related carbon emissions from 23.75 to 7.25 kgCO₂e/m²·
- Solar Exposure: Surface solar exposure decreases from 53.75 to 17 kWh/m²·yr as the WFR is reduced.
- Daylight Autonomy (sDA): sDA remains high (>95%) for WFR values between 20% and 30% but drops significantly at 10%.
- Glare Risk (ASE): ASE increases with WFR, exceeding acceptable thresholds beyond 20%, indicating a higher glare potential.
- Optimal Balance: Configurations within a WFR range of 20% to 25% combined with low-SHGC glazing (e.g., SHGC 0.53-0.62) offer the best balance, maintaining excellent daylighting while significantly reducing the cooling demand. A WFR of 15% is recommended only when minimizing the cooling load is the highest priority, accepting a notable reduction in daylight availability.
- Glazing Tradeoffs:
- Model 1 (VLT 88%, SHGC 0.82): Best for daylight and worst for thermal control.
- Model 4 (VLT 56%, SHGC 0.61): Best for thermal control, but compromises daylight.
- Models 2 and 3 (VLT 77-66%, SHGC 0.62-0.53): Offer-balanced performance.
- Uniformity: Illuminance uniformity remains stable across all scenarios (≈0.30-0.38), indicating consistent light distribution.
- Passive Cooling Strategy: Lower SHGC and reduced WFR directly reduce solar radiation, thereby supporting passive cooling in tropical classrooms.
4.2. Recommendations for tropical educational building design
Based on the parametric analysis and validated simulation results, the following specific recommendations are provided to achieve an optimal balance between daylight, visual comfort, and passive cooling in tropical educational buildings, with a summary table for design decision-making in Table 5.
Table 5
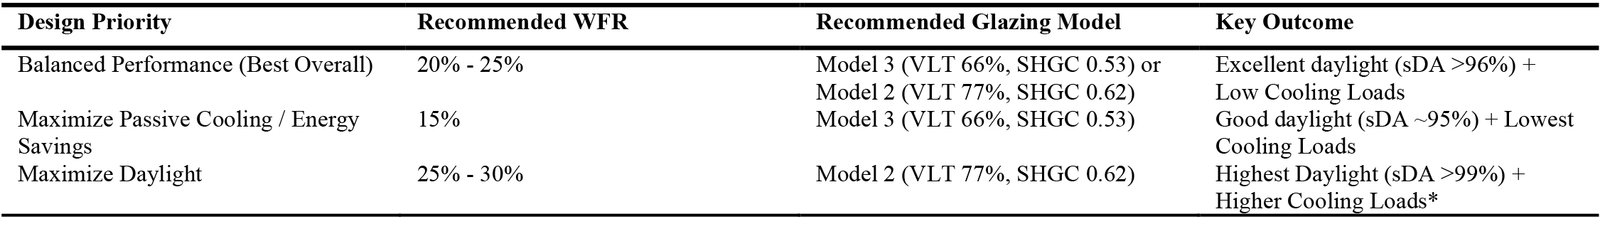
Table 5. Summary Table for Design Decision-Making.
4.2.1. Primary recommendation for new designs & major retrofits
Window-to-Floor Ratio (WFR): Implementation of a WFR of 20%-25%.
Glazing type: Select a low-SHGC glazing with a Solar Heat Gain Coefficient of 0.60. This corresponds to Glazing Model 2 (VLT 77%, SHGC 0.62) or Model 3 (VLT 66%, SHGC 0.53).
Expected performance: This combination provides the most robust balance, ensuring excellent daylight autonomy (sDA 96%), significantly reducing cooling emissions (20-30% lower than a 30% WFR baseline), and maintaining acceptable glare control (ASE 11%).
4.2.2. Recommendation for carbon-conscious retrofits with limited HVAC capacity
Window-to-Floor Ratio (WFR): Reduce the WFR to 15%.
Glazing type: Pair with low-SHGC glazing, prioritizing Glazing Model 3 (VLT 66%, SHGC 0.53) to preserve as much daylight as possible.
Expected performance: This strategy prioritizes passive cooling and energy savings, thereby achieving the lowest solar heat gain and cooling emissions. Designers must accept a moderate reduction in daylight availability (sDA ~93-95%) and be best suited for spaces where HVAC upgrades are not feasible.
4.2.3. Glazing Selection Guide
Avoid unshaded facade: Glazing Model 1 (High VLT 88%, High SHGC 0.82) should be avoided in large window areas, as it leads to the highest cooling loads and glare risk, despite offering the most daylight.
Use with caution: Glazing Model 4 (Low VLT 56%, SHGC 0.61) is highly effective for solar control, but severely compromises daylight quality, especially at lower WFRs. It should only be used in applications in which daylight is a secondary concern.
Ideal choices: Glazing Models 2 and 3 are the most versatile and recommended for most applications, with Model 3 being the superior choice for maximizing energy savings and Model 2 for maximizing daylighting.
4.3. Future research directions
To strengthen the practical applicability and long-term performance of the proposed strategies, future research should address the following issues:
- Advanced Modeling and Extended Validation: Future work should integrate dynamic thermal simulation tools (e.g., EnergyPlus) to precisely quantify cooling energy savings [23-25]. The validation conducted in this study can be extended to include long-term monitoring and thermal measurements.
- Dynamic Occupancy: Dynamic occupancy patterns and adaptive comfort strategies are incorporated to better reflect real-world usage [14].
- Economic Analysis: Conduct cost-benefit analyses of the proposed retrofit strategies to assess their financial viability and scalability.
- Integrated Shading Strategies: Explore the synergistic effects of combining optimal WFR and glazing configurations with external shading devices.
5. Conclusion
This study highlights the critical role of facade design optimization in improving the environmental performance of educational buildings in tropical climates. Through parametric simulations using ClimateStudio, the combined effects of WFR, VLT, and SHGC were systematically evaluated across multiple glazing configurations. The findings demonstrate that reducing WFR and SHGC significantly lowers solar exposure, glare risk, and cooling-related carbon emissions while maintaining acceptable levels of daylight autonomy. Specifically, configurations within the WFR range of 20-25%, combined with glazing of moderate VLT and low SHGC (e.g., VLT 66%, SHGC 0.53), emerged as the most balanced solutions, achieving high daylight autonomy (sDA 96%) while reducing solar exposure by over 40% compared to the baseline and minimizing the estimated cooling emissions.
Supported by empirical validation and despite the absence of dynamic thermal simulations and cost analyses, this study provides actionable, evidence-based insights for architects and engineers engaged in climate-responsive designs. The use of solar radiation as a proxy for cooling demand presents a practical alternative for early stage assessments, especially in resource-constrained contexts. To build upon the robust foundation established here, including the validated simulation approach, future studies should incorporate dynamic thermal modeling tools, cost-benefit analyses, and long-term post-occupancy evaluations.
By advancing the understanding of facade performance in tropical educational buildings, this research contributes to the development of carbon-conscious design practices that align with SDG 7 (Affordable and Clean Energy), SDG 11 (Sustainable Cities and Communities), and SDG 13 (Climate Action). This study provides a practical, evidence-based pathway for architects and engineers to design high-performance, low-carbon educational spaces in the tropics, directly contributing to the creation of a more sustainable built environment.
Funding
The research was supported by the CMU presidential scholarship of the graduate school of Chiang Mai University.
Acknowledgments
The author from the faculty of architecture, Chiang Mai University, under the CMU presidential scholarship, is grateful to the graduate school, Chiang Mai University and the student development committee for their scholarship and invaluable support in completing this study.
Author Contributions
Conceptualization, T.W.L., Y.T., and N.O.; Methodology, T.W.L. and Y.T.; Software, T.W.L.; Validation, T.W.L. and Y.T.; Formal Analysis, T.W.L.; Investigation, T.W.L.; Resources, T.W.L., Y.T., and N.O.; Data Curation, T.W.L.; Writing – Original Draft, T.W.L.; Writing – Review & Editing, T.W.L. and Y.T.; Visualization, T.W.L.; Supervision, Y.T., and N.O.; Project Administration, Y.T.; Funding Acquisition, T.W.L. All authors have read and agreed to the published version of the manuscript.
Declaration of competing interest
The authors declare no conflict of interest.
References
- T. Kubota, D. T. H. Chyee and S. Ahmad, The effects of night ventilation technique on indoor thermal environment for residential buildings in hot-humid climate of Malaysia, Energy and Buildings, 41:8 (2009) 829-839. https://doi.org/10.1016/j.enbuild.2009.03.008
- N. Hashempour, R. Taherkhani and M. Mahdikhani, Energy performance optimization of existing buildings: A literature review, Sustainable Cities and Society, 54 (2020) 101967. https://doi.org/10.1016/j.scs.2019.101967
- N. Nasrollahzadeh, Comprehensive building envelope optimization: Improving energy, daylight, and thermal comfort performance of the dwelling unit, Journal of Building Engineering, 44 (2021) 103418. https://doi.org/10.1016/j.jobe.2021.103418
- F. Fantozzi, H. Hamdi, M. Rocca and S. Vegnuti, Use of Automated Control Systems and Advanced Energy Simulations in the Design of Climate Responsive Educational Building for Mediterranean Area, Sustainability, 11:6 (2019) 1660. https://doi.org/10.3390/su11061660
- N. Delgarm, B. Sajadi, F. Kowsary and S. Delgarm, Multi-objective optimization of the building energy performance: A simulation-based approach by means of particle swarm optimization (PSO), Applied Energy, 170 (2016) 293-303. https://doi.org/10.1016/j.apenergy.2016.02.141
- X. Lv, Q. Meng, H. Mao and J. Wang, Towards Independent Adjustment Technologies for Thermal Insulation and Shading in Transparent Building Envelopes: A Systematic Review and Future Prospects, in Proceedings of ASim Conference 2024: 5th Asia Conference of IBPSA, China, 2024. https://doi.org/10.69357/asim2024.1265
- L. Ortega-Díaz, C. A. Fajardo and G. Osma-Pinto, Performance of energy consumption prediction techniques in classrooms of an educational building in a warm tropical climate, Energy and Buildings, 344 (2025) 115967. https://doi.org/10.1016/j.enbuild.2025.115967
- Y. Bian and Y. Ma, Analysis of daylight metrics of side-lit room in Canton, south China: A comparison between daylight autonomy and daylight factor, Energy and Buildings, 138 (2017) 347-354. https://doi.org/10.1016/j.enbuild.2016.12.059
- B. P. Jelle, S. E. Kalnæs and T. Gao, Low-emissivity materials for building applications: A state-of-the-art review and future research perspectives, Energy and Buildings, 96 (2015) 329-356. https://doi.org/10.1016/j.enbuild.2015.03.024
- K. Konis and S. Selkowitz, A Performance-Based Design and Delivery Process, in Effective Daylighting with High-Performance Facades, Cham, Springer, 2017, pp. 157-198. https://doi.org/10.1007/978-3-319-39463-3_4
- C. F. Reinhart and J. Wienold, The daylighting dashboard - A simulation-based design analysis for daylit spaces, Building and Environment, 46:2 (2011) 386-396. https://doi.org/10.1016/j.buildenv.2010.08.001
- Atthaillah, R. A. Mangkuto and A. Bintoro, Sensitivity Analysis and Optimization of Facade Design to Improve Daylight Performance of Tropical Classrooms with an Adjacent Building, Journal of Daylighting, 12 (2025) 235-251. https://doi.org/10.15627/jd.2025.13
- Z. Wu, Y. Xu and Z. Wang, Multi-objective optimization of energy, view, daylight and thermal comfort for building's fenestration and shading system in hot-humid climates, PLoS One, 20:6 (2025) 0325290. https://doi.org/10.1371/journal.pone.0325290
- V. Ahmed, S. Saboor, F. A. Almarzooqi, H. A. Alshamsi, M. A. Alketbi and F. A. A. marei, A Comparative Study of Energy Performance in Educational Buildings in the UAE, Construction Economics and Building, 21:3 (2021) 33-57. https://doi.org/10.5130/AJCEB.v21i3.7681
- C. Jim and L. L. Peng, Weather effect on thermal and energy performance of an extensive tropical green roof, Urban Forestry & Urban Greening, 11:1 (2012) 73-85. https://doi.org/10.1016/j.ufug.2011.10.001
- M. Nagasue, H. Kitagawa, T. Asawa and T. Kubota, A Systematic Review of Passive Cooling Methods in Hot and Humid Climates Using a Text Mining-Based Bibliometric Approach, Sustainability, 16:4 (2024) 1420. https://doi.org/10.3390/su16041420
- A. Bhatia, S. A. R. Sangireddy and V. Garg, An approach to calculate the equivalent solar heat gain coefficient of glass windows with fixed and dynamic shading in tropical climates, Journal of Building Engineering, 22 (2019) 90-100. https://doi.org/10.1016/j.jobe.2018.11.008
- J.-H. Kim, S.-K. Son, G.-S. Choi, Y.-T. Kim, S.-B. Kim and W.-K. Choi, A Fundamental Study on the Development of New Energy Performance Index in Office Buildings, Energies, 14:8 (2021) 2064. https://doi.org/10.3390/en14082064
- M. Mohsenin and J. Hu, Assessing daylight performance in atrium buildings by using Climate Based Daylight Modeling, Solar Energy, 119 (2015) 553-560. https://doi.org/10.1016/j.solener.2015.05.011
- M. Hirning, G. Isoardi and V. Garcia-Hansen, Prediction of discomfort glare from windows under tropical skies, Building and Environment, 113 (2017) 107-120. https://doi.org/10.1016/j.buildenv.2016.08.005
- AHSRAE, ASHRAE Guideline 14-2014 Measurement of Energy, Demand, and Water Savings, Atlanta, USA: The American Society of Heating, Refrigerating and Air-Conditioning Engineers, 2014.
- F. Kharvari, A Field-validated Multi-objective Optimization of the Shape and Size of Windows Based on Daylighting Metrics in Hot-summer Mediterranean and Dry Summer Continental Climates, Journal of Daylighting, 7 (2020) 222-237. https://doi.org/10.15627/jd.2020.19
- J. V. Bhote and T. R. Chauhan, A review of multi objective optimization in sustainable architecture: enhancing energy efficiency through dynamic facades, Asian Journal of Civil Engineering, 26 (2025) 2319-2330. https://doi.org/10.1007/s42107-025-01331-w
- N. S. Fadhila, M. F. Alkadri and O. C. Dewi, Bio-cooling façade in tropical climate, Sustinere: Journal of Environment and Sustainability, 8:2 (2024) 166-181. https://doi.org/10.22515/sustinere.jes.v8i2.400
- W. N. Hien, T. P. Yok and C. Yu, Study of thermal performance of extensive rooftop greenery systems in the tropical climate, Building and Environment, 42:1 (2007) 25-54. https://doi.org/10.1016/j.buildenv.2005.07.030
2383-8701/© 2026 The Author(s). Published by solarlits.com. This is an open access article distributed under the terms and conditions of the Creative Commons Attribution 4.0 License.

2597
Total views
Citations
SHARE ON


