
Article | 5 September 2026
Volume 13 Issue 2 pp. 507-520 • doi: 10.15627/jd.2026.28
Passive Design Optimisation for Energy Performance of Naturally Cross-Ventilated Building Spaces in the Tropics
Muhammad Iqbal,1,* Atthaillah,1 Mochamad Donny Koerniawan,2 Yulius Rief Alkhaly 3
Author affiliations
1 Architecture Program, Faculty of Engineering, Universitas Malikussaleh, Jl. Cot Teungku Nie, Aceh Utara 24355, Indonesia
2 Architecture Department, School of Architecture, Planning and Policy Development, Institute Technology Bandung, Jl. Ganesa No. 10 Bandung 40132, Indonesia
3 Civil Engineering Department, Faculty of Engineering, Universitas Malikussaleh, Jl. Cot Teungku Nie, Aceh Utara 24355, Indonesia
*Corresponding author.
miqbal.arch@unimal.ac.id (M. Iqbal)
atthaillah@unimal.ac.id (Atthaillah)
donny@ar.itb.ac.id (M. D. Koerniawan)
yr.alkhaly@unimal.ac.id (Y. R. Alkhaly)
History: Received 20 May 2026 | Revised 29 July 2026 | Accepted 3 August 2026 | Published online 5 September 2026
Copyright: © 2026 The Author(s). Licensee Solarlits Limited (Hong Kong). This is an open access article distributed under the terms and conditions of the Creative Commons Attribution 4.0 License.
Citation: Muhammad Iqbal, Atthaillah, Mochamad Donny Koerniawan, Yulius Rief Alkhaly, Passive design optimisation for energy performance of naturally cross-ventilated building spaces in the tropics, Journal of Daylighting, 13:2 (2026) 507-520. doi: 10.15627/jd.2026.28
Figures and tables
Abstract
The increased energy demand due to rapid economic growth and urbanisation has led to buildings becoming among the largest energy consumers, particularly in tropical climates. This study develops and validates an integrated simulation–prediction framework to identify optimal passive design strategies for a naturally cross-ventilated tropical building space. Seven passive design variables were investigated, including window-to-wall ratio, window orientation, glazing type, shading depth, wall thickness, external wall insulation and roof insulation thicknesses. From 16,384 possible design combinations, 4,915 alternatives were generated using Latin hypercube sampling. Dynamic thermal simulations were performed using the THERB for HAM. Sensitivity analysis was later conducted to understand the influential input variables. The findings of the study demonstrate that the window-to-wall ratio exhibits the most significant positive influence on cooling energy consumption, while roof insulation thickness shows the opposite trend. The optimal passive design configuration achieved an annual energy consumption of 32.86 kWh/m2/year, representing a 74.1% reduction compared to the baseline scenario of 127.11 kWh/m2/year. Therefore, it is recommended that building designers focus on these key input variables to achieve the most optimal passive design in terms of energy performance in the tropics.
Keywords
naturally cross-ventilated space, passive design optimisation, sensitivity analysis, energy performance, tropics
Nomenclature
| FEMP | The measurement and verification of federal energy projects |
| IPMVP | The international performance measurement and verification protocol |
| LHS | Latin hypercube sampling |
| TMY | Typical Meteorological Year |
| MBE | Mean bias error [%] |
| RMSE | Root mean squared error [%] |
| SRC | Standardised regression coefficients [-] |
| X2 | Chi square [-] |
| X1 | Window-to-wall-ratio [%] |
| X2 | Window orientation [°] |
| X3 | Glazing type [W/m2. K] |
| X4 | Shading depth [mm] |
| X5 | Wall thickness [mm] |
| X6 | Wall insulation Thickness [mm] |
| X7 | Roof insulation thickness [mm] |
| Y | Energy consumption [kWh/m2/year] |
1. Introduction
Rapid urbanisation, economic growth, and rising living standards have significantly increased global energy demand, with the building sector emerging as one of the largest contributors to worldwide energy consumption and carbon emissions [1]. According to the International Energy Agency (IEA), building construction and operation account for approximately 36% of global final energy consumption and nearly 40% of energy-related CO2 emissions [2]. This continues to represent a significant challenge on a global scale in the present era, particularly with regard to the ongoing rise in global temperatures.
The challenge is particularly critical in tropical regions, where consistently high temperatures and relative humidity potentially increase the demand for cooling requirements throughout the year [3-4]. In such climates, cooling energy demand constitutes the dominant share of operational building energy consumption [5]. Simultaneously, energy poverty is an issue in many tropical countries, where limited access to electricity affects the capacity of vulnerable people to maintain comfortable indoor thermal conditions [6-7]. This combination of increasing cooling demand and constrained energy access suggests the importance of low-energy building solutions that are both environmentally sustainable and socially accessible [8].
The passive design strategies have the potential to offer effective and low-cost approaches for reducing thermal loads and minimising dependence on mechanical cooling systems [9-10]. By adapting building form, orientation, and envelope characteristics to local climatic conditions, passive design strategy can significantly reduce cooling energy consumption while improving indoor thermal comfort [11]. Previous studies have shown that variables such as window-to-wall ratio (WWR), façade orientation, and shading depth strongly influence solar heat gain and cooling demand [12]. In addition, envelope properties including wall thickness, wall insulation, roof insulation, and glazing performance play critical roles in limiting conductive and radiative heat transfer [13]. When strategically integrated, these passive design variables have been shown to substantially improve building energy performance [14].
Despite these advances, most existing studies have evaluated passive design individually or through limited parametric analyses involving only a small number of variables [15-18]. For instance, Perera et al. [15] conclude that careful selection of passive design strategies can save about 40.1% of the average annual energy demand of high-rise residential buildings in an extremely hot-humid climate. Then, Axaopoulos et al. [16] evaluated the effects of appropriate insulation thicknesses for exterior walls and roofs and found that they significantly reduced annual heating and cooling loads by more than 66% and 99%, respectively. Next, Amani [17] conducted a separate analysis of external wall and roof insulation to evaluate the building's energy performance. In addition, Ma et al. [18] evaluated WWR without taking into account shading or insulation variables. As a result, the combined interaction effects among multiple passive design variables remain insufficiently understood, particularly in tropical building contexts [19]. In addition, few studies have integrated systematic sampling techniques with predictive modelling to efficiently explore passive design spaces while reducing computational burden. Furthermore, although building performance simulation has been extensively utilised to evaluate passive design strategies in tropical residential buildings [20-24], relatively few studies have integrated systematic sampling techniques with predictive modelling to efficiently explore passive design spaces. Specifically, Elwy and Hagishima [20] reviewed surrogate model-based building optimisation approaches and highlighted the growing adoption of machine learning techniques to improve computational efficiency. Similarly, Cruz et al. [22] demonstrated that surrogate-assisted optimisation has become an effective approach for sustainable building design but identified the need for more robust methodologies capable of handling high-dimensional design problems. Nugroho et al. [23] reviewed passive design strategies for Indonesian vernacular houses, emphasising climate-responsive design principles without quantitatively evaluating the relative influence of multiple design variables. Likewise, Binarti and Kubota [24] comprehensively reviewed passive cooling techniques for hot-humid climates but reported that existing studies primarily evaluate individual passive strategies rather than their combined effects. In addition, Niknami and Masoud [21] compared the performance of passive cooling strategies across different climates, demonstrating their effectiveness while indicating the need for more comprehensive evaluation frameworks to support design decision-making. Consequently, comprehensive methodologies that integrate systematic sampling, predictive modelling, and sensitivity analysis to systematically evaluate passive design spaces remain limited, particularly for naturally ventilated building spaces in hot-humid tropical climates.
In order to address this research gap, this study evaluates the combined effects of seven key passive design variables on annual energy consumption in a representative naturally cross-ventilated tropical building space. The selected input variables include WWR, window orientation, glazing type, shading depth, wall thickness, external wall insulation and roof insulation thicknesses. These input variables were selected because they directly influence solar heat gain, envelope thermal resistance, and indoor thermal conditions, which are the determinants of cooling energy demand in tropical climates [25]. Beyond assessing individual parameters, this study generates new insights into how these seven passive design variables collectively influence cooling energy demand in a tropical context and identifies their relative contributions to energy reduction.
Moreover, a simplified box-model building was developed and evaluated using dynamic thermal simulation to estimate annual cooling energy demand. To efficiently explore the large number of possible design combinations, Latin hypercube sampling (LHS) method was integrated with thermal simulation to generate the design alternatives.
The LHS guarantees that each interval of every input variable is sampled once, thereby preserving marginal stratification, but it does not explicitly control the spatial arrangement of sample points within the multidimensional design space. Consequently, clusters and poorly represented regions may occur, particularly when dealing with nonlinear problems. The maximin criterion introduces an additional space-filling objective by maximising the minimum Euclidean distance between any pair of sample points [26]. This approach produces a more uniform distribution of samples throughout the design space, reduces sample clustering, and improves the ability to capture interactions among variables. As a result, the generated dataset becomes more representative of the overall parameter space and provides a stronger basis for sensitivity analysis, surrogate modelling, and optimisation. The resulting dataset was then utilised for the following purposes: (1) the identification of the most energy-efficient passive design combinations, (2) the quantification of the relative influence of each passive design variable through sensitivity analysis, and (3) the determination of optimal design configurations.
Therefore, the novelty of this study relative to the existing literature are threefold. Firstly, the analysis is performed on seven interdependent passive design variables, thus providing a substantially more comprehensive evaluation than the one to four variable studies commonly reported in the literature. Secondly, it identifies and quantifies the interaction effects among these variables in a naturally cross-ventilated space under Indonesia's tropical conditions. This is a context that remains less discussed in literature. Finally, this study provides multi-optimum solutions, thereby offering a design guidance that extends beyond the identification of a single optimum solution. Through this integrated framework, this study advances evidence-based passive design strategies for a guidance to develop low-energy, climate-responsive building spaces in tropical regions.
2. Methodology
This study consists of four main stages including field measurement and baseline model validation, simplified model and passive design variables, data sampling and calculation of cooling loads, and analysis, as demonstrated in Fig. 1.
Figure 1
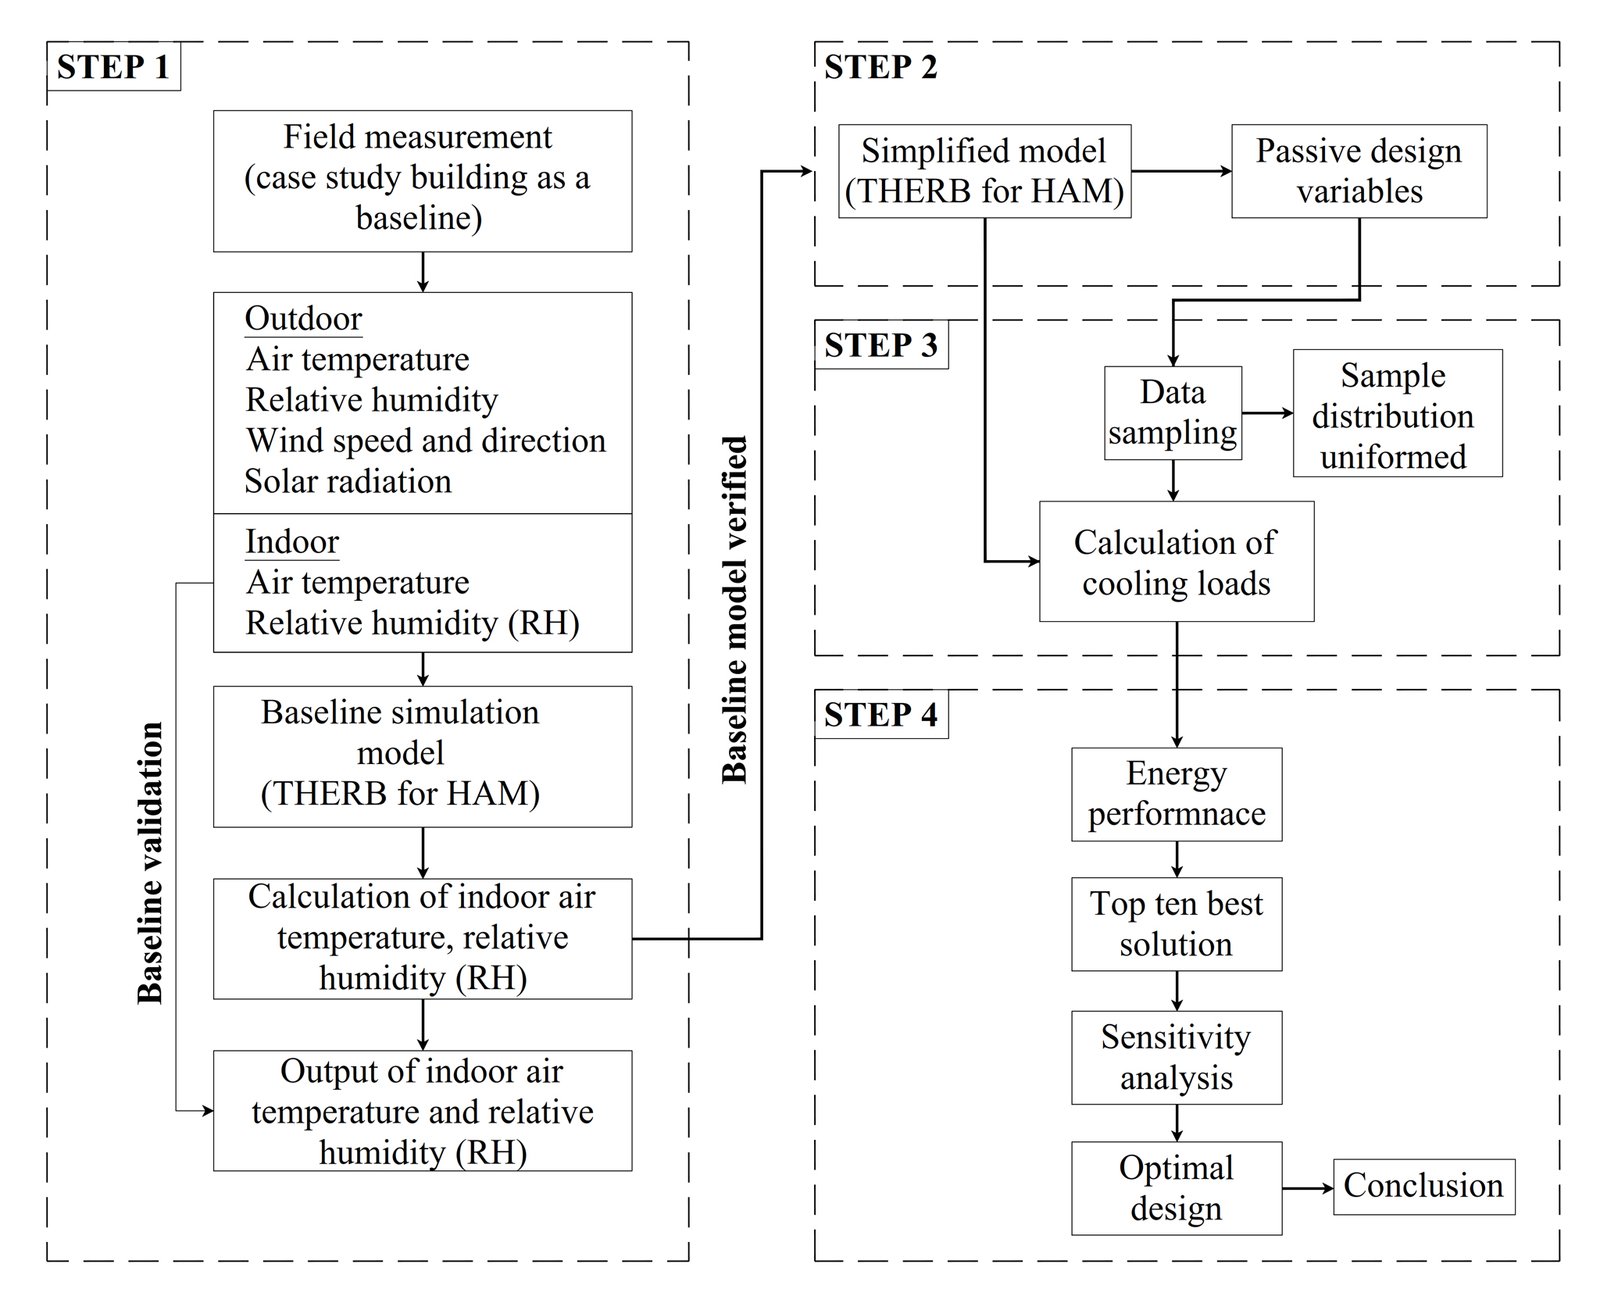
Fig. 1. Research framework in this study.
The framework under consideration can be regarded as a structured and reproducible process. However, it should be noted that not all techniques are entirely novel. In the context of engineering and architectural research, there are substantial publications and citations concerning frameworks that integrate established components into a validated, context-specific workflow. The rationale behind this framework is that the scientific value lies in demonstrating the applicability and effectiveness of an integrated workflow for passive design optimisation tropical building spaces, where comprehensive multi-objective optimisation studies are still limited.
2.1. Field measurements
Field measurement was conducted in an experimental space located in Lhokseumawe, Indonesia ). The climatic of the study area reveals typical sub-equatorial characteristics, with relatively high air temperatures and consistently elevated relative humidity throughout the year.
The average outdoor air temperature ranges between approximately 26°C and 32°C, while relative humidity remains above 70% for most of the time annually. These conditions indicate a strong cooling demand and emphasise the critical role of passive design strategies to mitigate solar heat gain, enhancing natural ventilation, maintaining acceptable indoor thermal comfort, and reducing cooling energy demand, thereby contributing to more energy-efficient building spaces in tropical climates. The relatively small diurnal air temperature variation reduces the cooling potential of thermal mass because limited night-time temperature drops restrict the release of stored heat. Therefore, passive design measures that minimise solar heat gain and optimise natural ventilation are generally regarded as more preferable strategies for reducing cooling energy demand in tropical climates. Figure 2 presents the climatic characteristics of the reference location based on historical weather data for the period range from 2020 to 2025 [27].
Figure 2
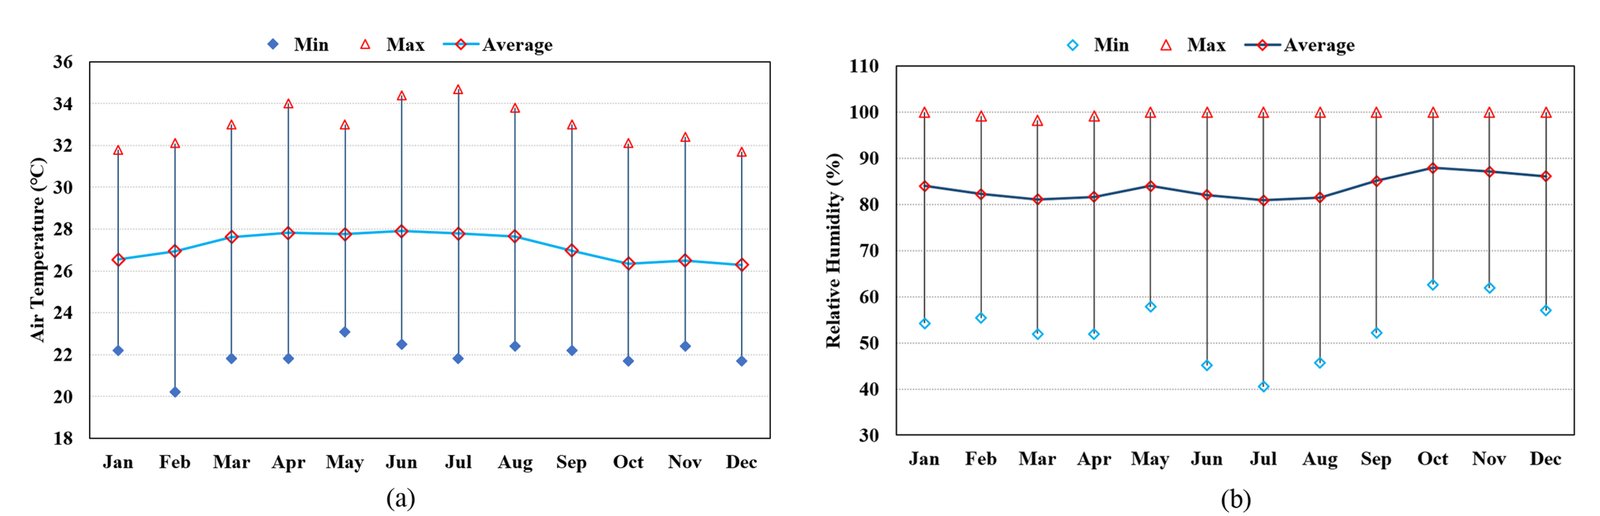
Fig. 2. Weather data of the baseline location; (a) air temperature, (b) relative humidity.
In this study, field measurements are conducted to validate the baseline model, as illustrated in Fig. 3. The monitored parameters included indoor air temperature and relative humidity, as well as outdoor air temperature, relative humidity, solar radiation, wind speed, and wind direction. Indoor air temperature and relative humidity were recorded using an Elitech GSP-6 data logger. Outdoor environmental variables, including air temperature, relative humidity, wind velocity, and wind direction, were measured using a Davis 6263 Wireless Vantage Pro2 weather station. Solar radiation was measured using a Lutron SPM-1116SD solar power meter. All instruments were configured with a 5-minute logging interval to ensure the consistency between indoor and outdoor measurements. In addition, indoor air temperature and relative humidity were measured at three horizontal locations within the room, with all sensors installed at a uniform height of 1.0 m above the floor. The measurement points were located near the inlet (1.57 m from the external wall), at the centre of the room (3.14 m from the external wall), and near the outlet (4.71 m from the external wall, adjacent to the internal wall). Outdoor climatic parameters were simultaneously monitored using instruments positioned near the external openings of the experimental room.
Figure 3
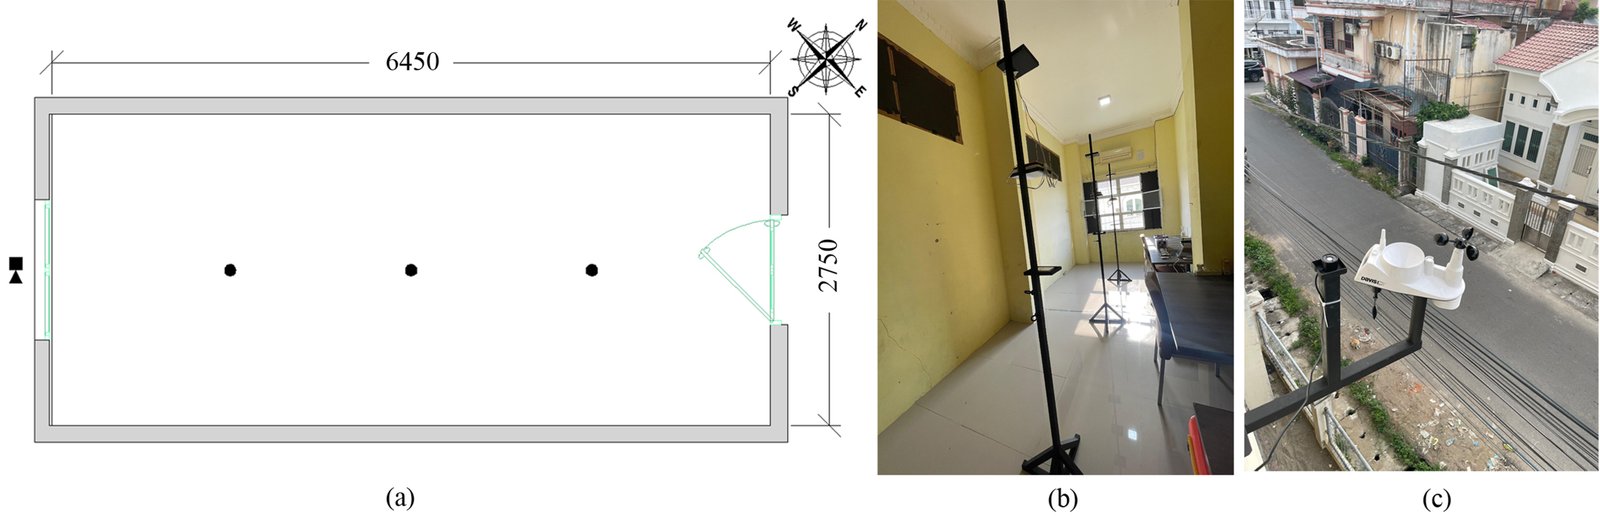
Fig. 3. Experiment settings in case study building for validation of (a) floorplan configuration, (b) indoor view, and (c) weather station installation.
2.2. Baseline and simplified model
The baseline model employed was developed using THERB for HAM, which predicts whole-building heating and cooling loads, indoor air temperature, and relative humidity by accounting for coupled heat, air, and moisture (HAM) processes. THERB for HAM is a building simulation tool that has been officially certified, approved by the Japanese government, and is widely utilised in Japan [28-29]. In order to evaluate passive design optimisation, a simplified model was developed. The floor area of this model was 25 m2 (5 m × 5 m) and its height 3 m, as demonstrated in Fig. 4.
Figure 4
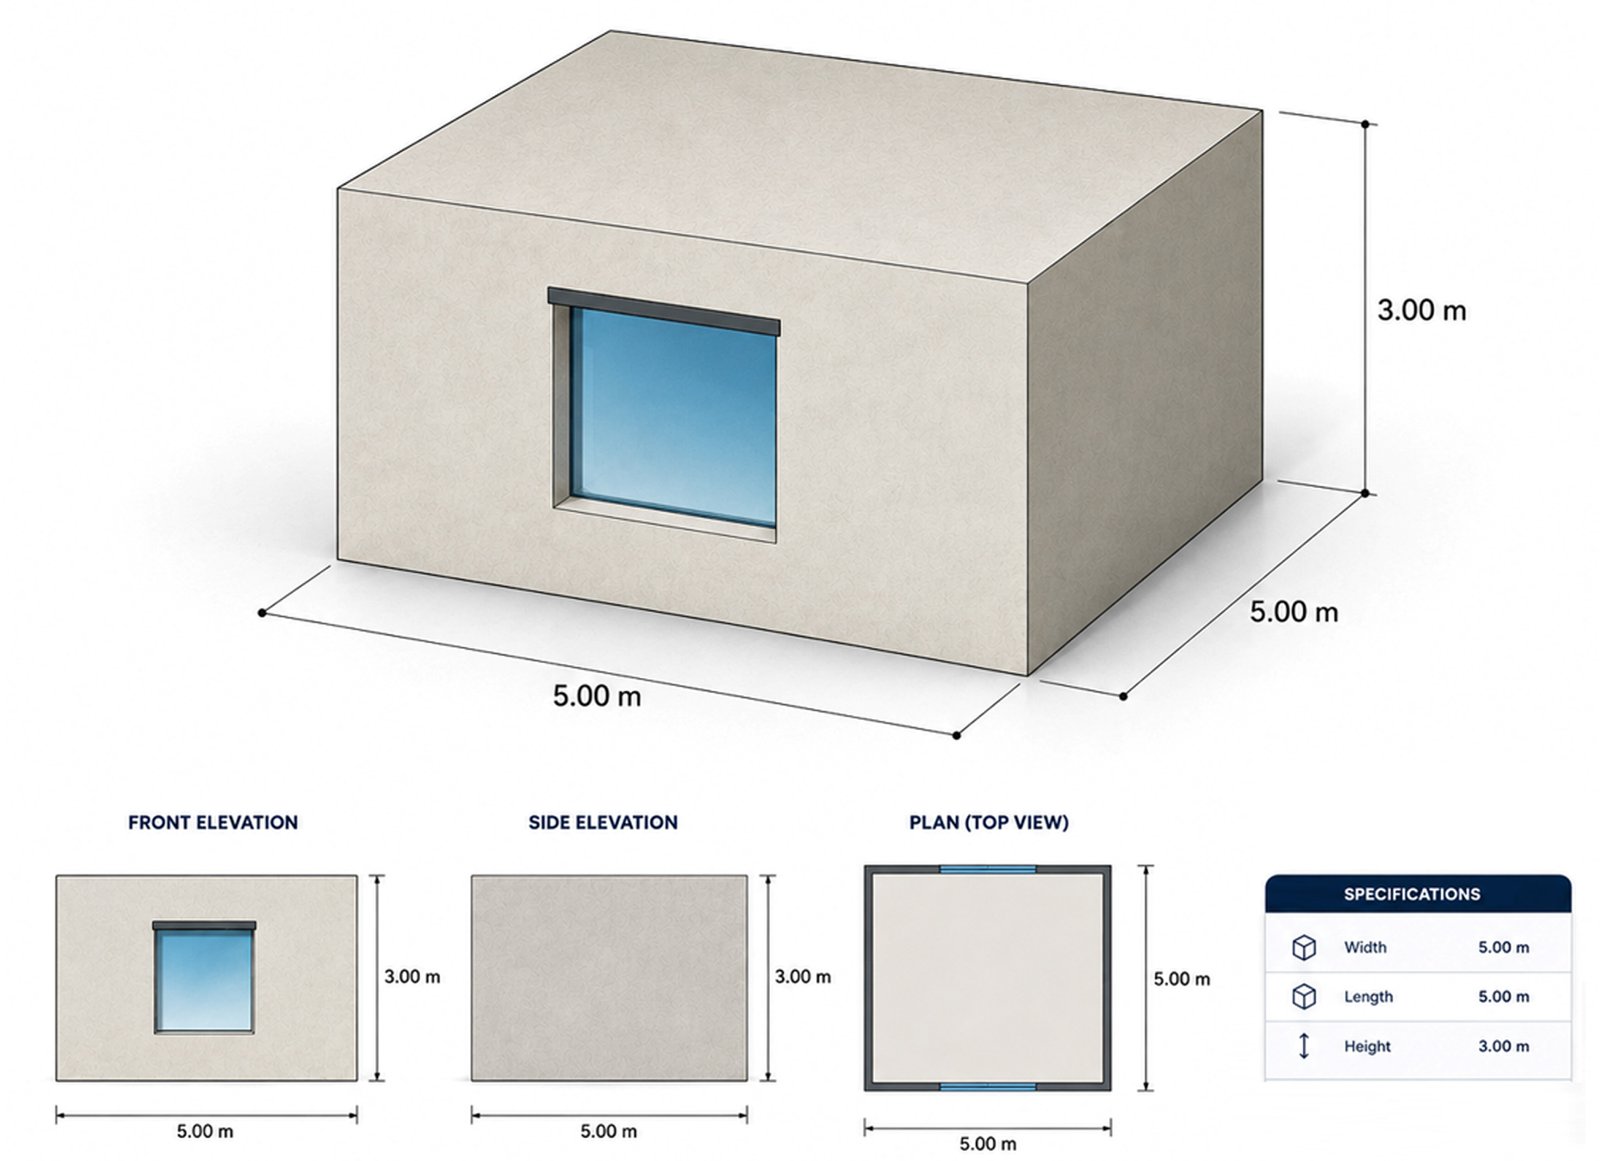
Fig. 4. Simplified model for simulation and optimization.
This simplified model configuration was selected to minimise computational complexity whilst preserving the representation of thermal performance characteristics. The material specifications employed in the model are adopted from case study building as outlined in Table 1.
Table 1
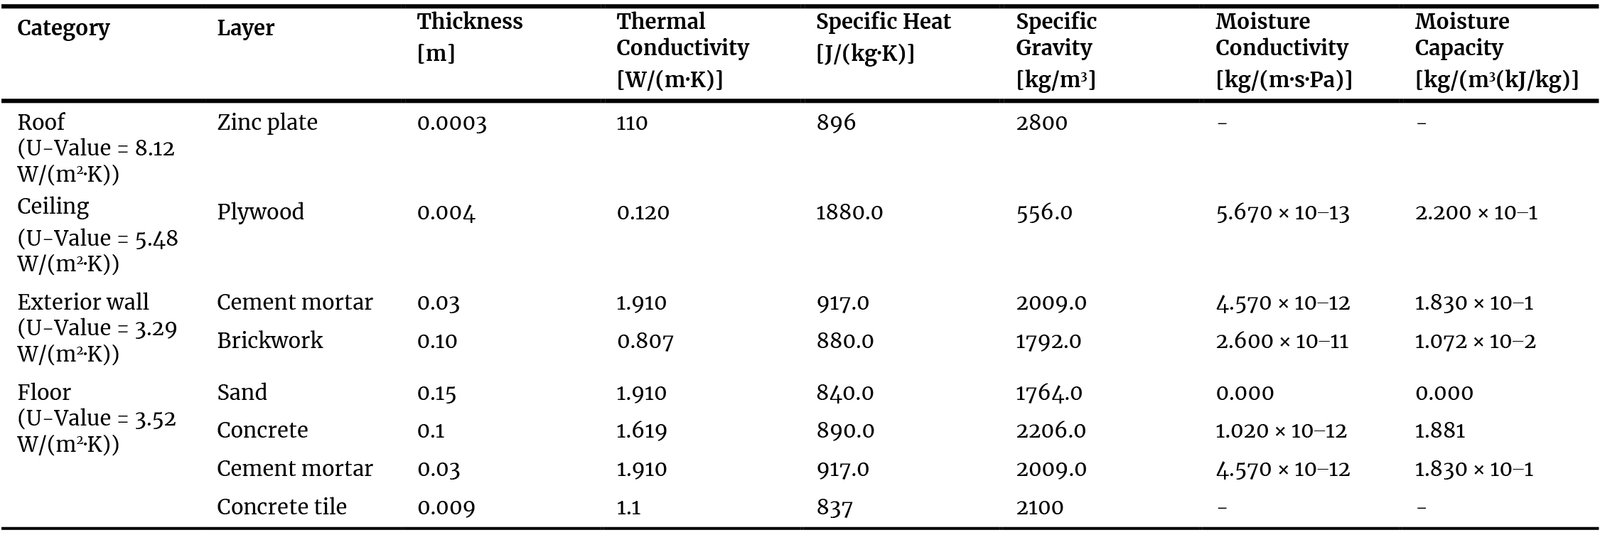
Table 1. Material configurations for the simplified model in this study.
2.3. Model validation
To ensure model reliability, validation was performed by comparing simulation outputs with field measurement data. The accuracy of the simulation model was evaluated by comparing the simulated outputs with field measurement data through the calculation of the mean bias error (MBE) and root mean square error (RMSE) of indoor air temperature and relative humidity, in accordance with the standards recommended by ASHRAE [30], the international performance measurement and verification protocol (IPMVP) [31], and the measurement and verification of Federal Energy Management program (FEMP) [32]. The field measurements were conducted from 1 to 6 August 2025, corresponding to one of the hottest periods of the year in Lhokseumawe. As shown in Fig. 2, August is characterised by among the highest average and maximum outdoor air temperatures, while outdoor relative humidity remains consistently above 80%, representing conditions of elevated thermal stress and cooling demand. This period was therefore intentionally selected to validate the simulation model under representative peak thermal conditions. Although the six-day measurement does not capture seasonal climatic variability, it provides an assessment of the model under the most demanding operating conditions.
The model's ability to reproduce the measured indoor thermal response during this period was confirmed by satisfying the statistical acceptance criteria recommended by ASHRAE, IPMVP, and FEMP [30-32]. Furthermore, the discharge coefficient and wind pressure coefficient are adopted from some previous studies [33-35]. The simulation parameters and conditions under consideration are outlined in Table 2.
Table 2
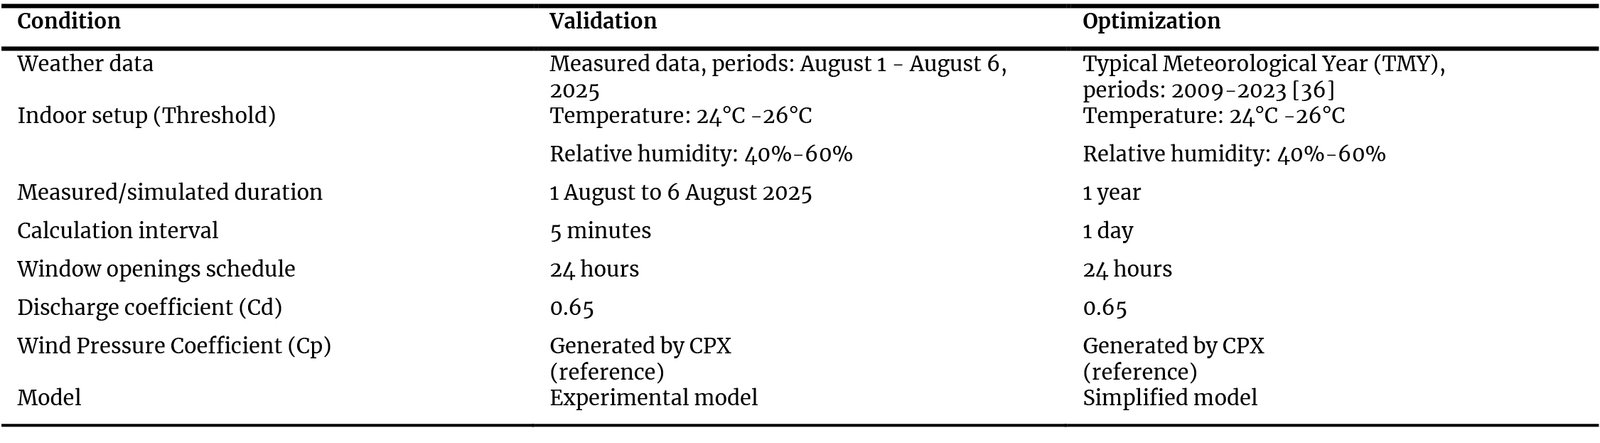
Table 2. Simulation configuration employed in this study.
The MBE and CV (RMSE) were calculated using Equations (1) and (2). In addition, the simulation model was considered acceptable when the calibration indicators satisfied the established thresholds of MBE within ±10% (ASHRAE/IPMVP) or ±5% (FEMP) and CV(RMSE) below 30% (ASHRAE/IPMVP) or below 20% (FEMP).
where Mi and Si are the measured and simulated data, and N is the total number of data.
2.4. Passive design variables
The passive design variables investigated in this study comprised variations in the WWR, window orientation, glazing type, shading depth, wall thickness, external wall insulation thickness and roof insulation thickness. These variables and their symbols are depicted in Table 3.
Table 3
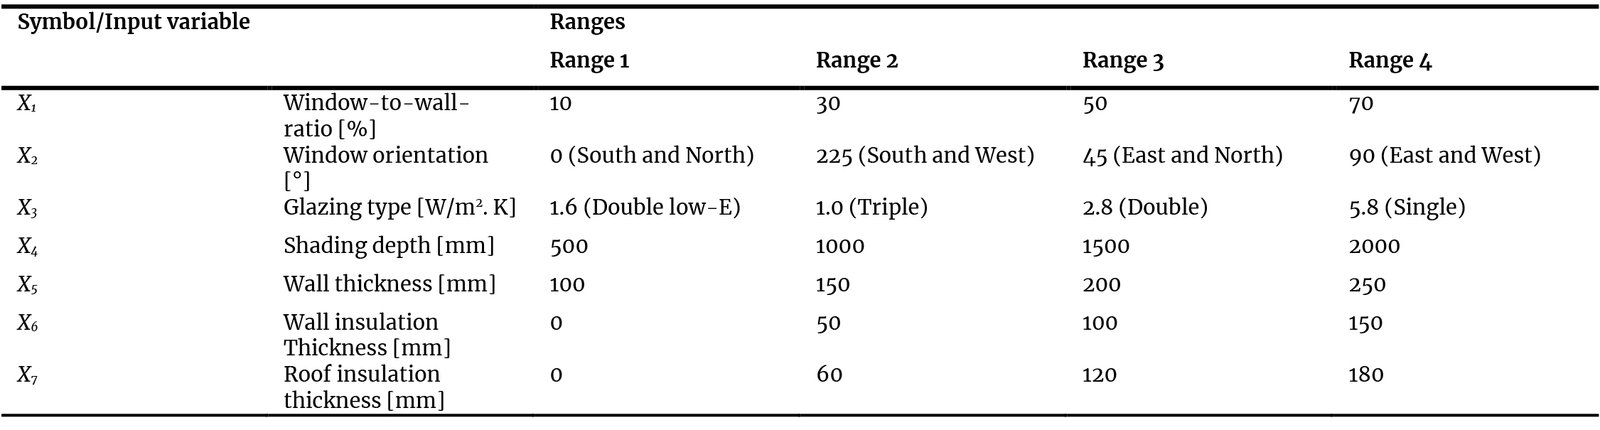
Table 3. Design/input variables, symbols and their ranges in this study.
2.5. Data sampling
To efficiently explore the multidimensional design space, a stratified sampling strategy based on LHS method was employed [37]. In this approach, each variable was divided into discrete levels, and samples were generated such that all levels were proportionally represented, ensuring that no category was overlooked. The sampling process incorporated randomisation in the combination of input variables while applying constraints to preserve balanced representation across both categorical and numerical parameters [38]. To improve the space-filling characteristics of the sampling design and minimise clustering in the multidimensional parameter space, a maximin distance criterion was adopted [39]. The objective of the maximin approach is to maximise the minimum distance between any two sample points, which can be expressed as Equation (3):
where d(xi, xj) represents the Euclidean distance between sample points xi, xj and in the multidimensional parameter space.
A total of 30% of all possible design combinations were selected, resulting in 4,915 design alternatives out of 16,384 configurations. The selection of this sampling proportion was guided by a convergence analysis, which indicated that increasing the sample size beyond this threshold produced negligible changes in key statistical indicators and optimal solution identification.
This confirms that the reduced sample set is sufficient to represent the overall design space while significantly improving computational efficiency [40].
The statistical representativeness of the sampled dataset was further validated using a chi-square goodness-of-fit test and proportional distribution analysis. To confirm the robustness of the sampling framework, ten independent LHS runs with different random seeds were performed. The resulting optimal energy consumption values varied by less than ±2% of the reported optimum, and the highest-ranked configuration (X1=10%, X2=0°, X3=1.0 W/m².K, X4=1500 mm, X5=250 mm, X6=150 mm, X7=180 mm) appeared consistently in the top three across all ten runs. This confirms that the LHS results are not sensitive to the random seed at the selected sample size of 30%. The chi-square statistic is defined as Equation (4):
where Oi represents the observed frequency of each level, Ei denotes the expected frequency under a uniform distribution, and k is the end value.
The test evaluates whether the observed distribution significantly deviates from the expected uniform distribution. In previous study, the results indicate that input variables exhibit no statistically significant deviation (p > 0.05), confirming balanced representation across all parameter and demonstrating that the sampling strategy effectively avoids bias [41]. The design alternatives were subsequently evaluated using building performance simulations to estimate annual cooling energy consumption (kWh/m²/year). The simulation results were systematically compared, and the optimal passive design configuration was identified as the alternative with the minimum energy consumption.
2.6. Sensitivity analysis
It is crucial to note that the input and output variables consists of different units. To ensure the comparability of the variables, it was necessary to standardise all variables prior to analysis. The resulting coefficients are known as standardised regression coefficients (SRCs). These range from −1 to +1, where higher absolute values indicate stronger sensitivity of the output variable to changes in the corresponding input variable. This enables direct comparison of the relative influence of each variable within the regression model.
In this study, the SRCs are further used as a sensitivity analysis tool to quantify the relative influence of each passive design variable on building energy consumption. The standardisation procedures for both input and output variables are presented in Eq. (5) and Eq. (6), respectively, where and denote the i-th input and output variables.
3. Result
3.1. Simulation validation
The validation result demonstrated a strong consistency between the measured data and the simulation results for both indoor air temperature and indoor relative humidity, as shown in Fig. 5.
Figure 5
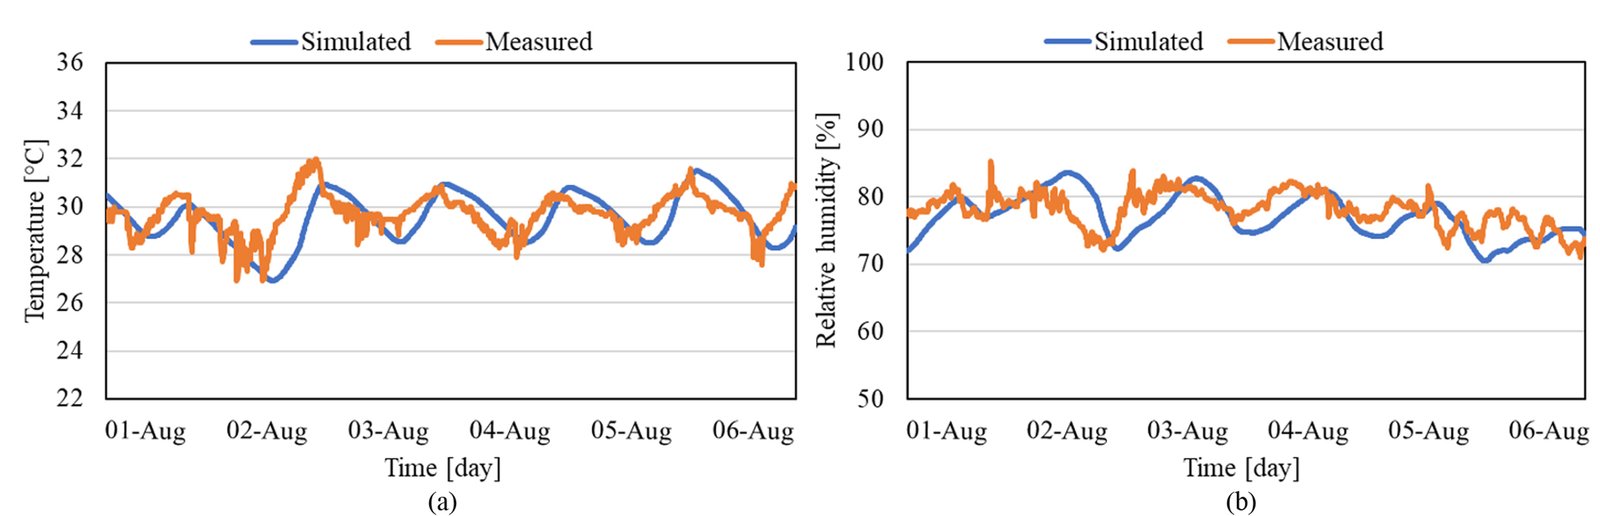
Fig. 5. Comparison of simulation and experiment data of (a) indoor air temperature, (b) indoor relative humidity.
The simulation of indoor air temperature and indoor relative humidity fluctuation patterns demonstrated a strong correlation with the experiment data. Quantitatively, the error values were relatively low, with an MBE of 2.53% for indoor air temperature and 3.40% for indoor relative humidity, and CV (RMSE) values of 2.92% and 2.09%, respectively, as presented in Table 4. These results showed that THERB's numerical simulation accuracy has complied with ASHRAE, IPMVP, and FEMP standard thresholds, confirming that the simulation is valid and reliable for a naturally cross-ventilated space in a tropical region, as intended within this study.
Table 4

Table 4. Validation results against several international standard thresholds.
3.2. Sample distribution
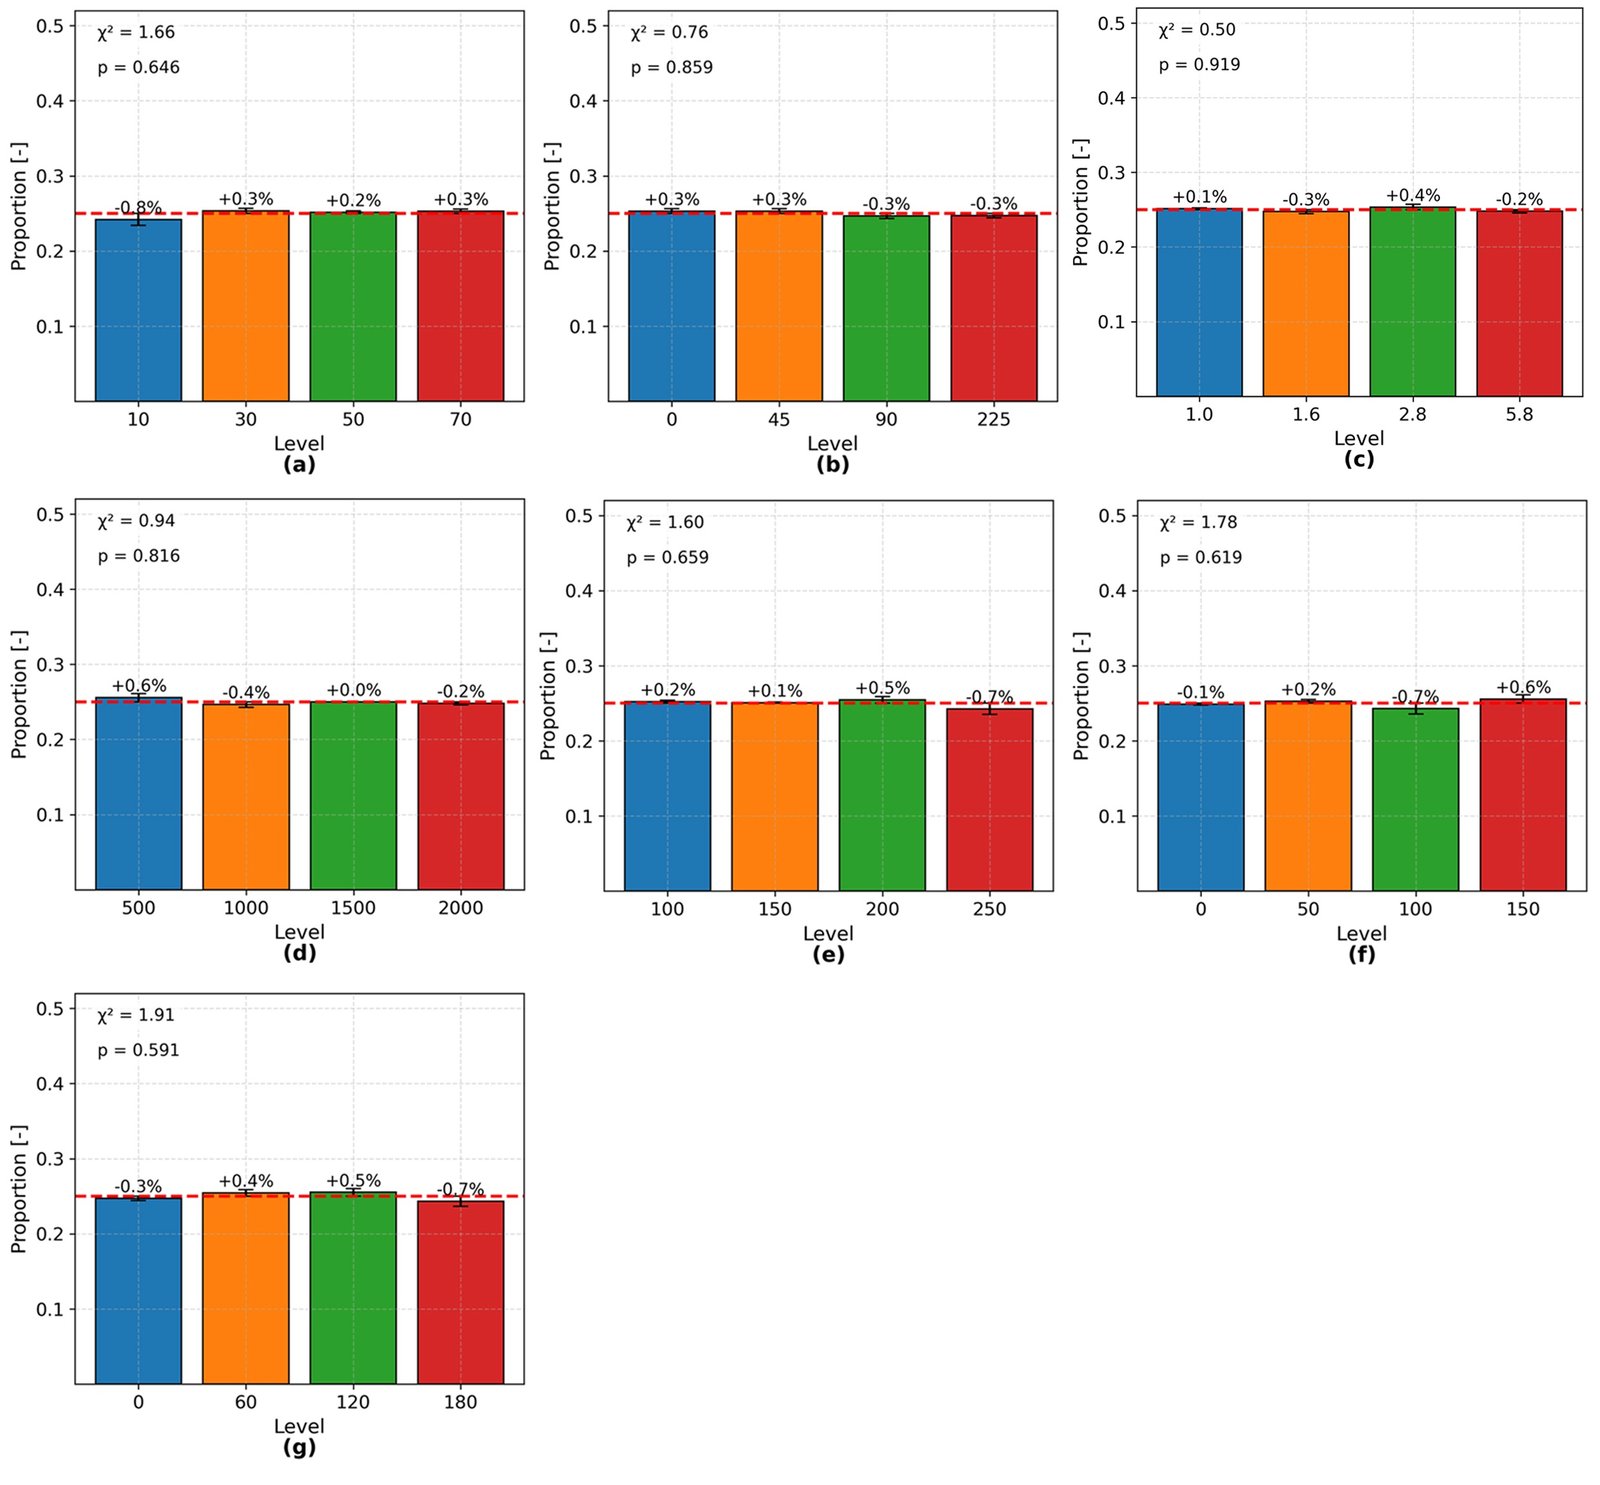
The distribution of sampled across all parameter levels is presented in Fig. 6. Each subplot (a–g) illustrates the proportion of samples assigned to each level for the seven passive design variables. The results indicate that all variables exhibit nearly uniform distributions, with proportions closely approximating the expected value of 0.25. The deviation values displayed above each bar remain relatively small (generally within ±1–2%), demonstrating that the sampling process successfully maintained balanced representation across all levels.
Figure 6
X1 = Window-to-wall-ratio [%]; X2 = Window orientation [°]; X3 = Glazing type [W/m2.K]; X4 = Shading depth [mm]; X5 = Wall thickness [mm]; X6 = Wall insulation thickness [mm]; X7 = Roof insulation thickness [mm]
Fig. 6. The distribution of sampled design variables, (a) X1, (b) X2, (c) X3, (d) X4, (e) X5, (f) X6, (g) X7.
Furthermore, the error bars representing the deviation from the expected uniform distribution are minimal and consistently distributed, confirming the absence of clustering or under-representation within the sampled design space. Statistical validation using the chi-square ( ) goodness-of-fit test further supports these observations. The computed p-values for all variables exceed the significance threshold of 0.05, indicating no statistically significant difference between the observed and expected distributions. This confirms that the sampling results are statistically consistent with a uniform distribution and that the LHS method effectively preserves proportional representation across all parameter levels.
3.3. Energy performance
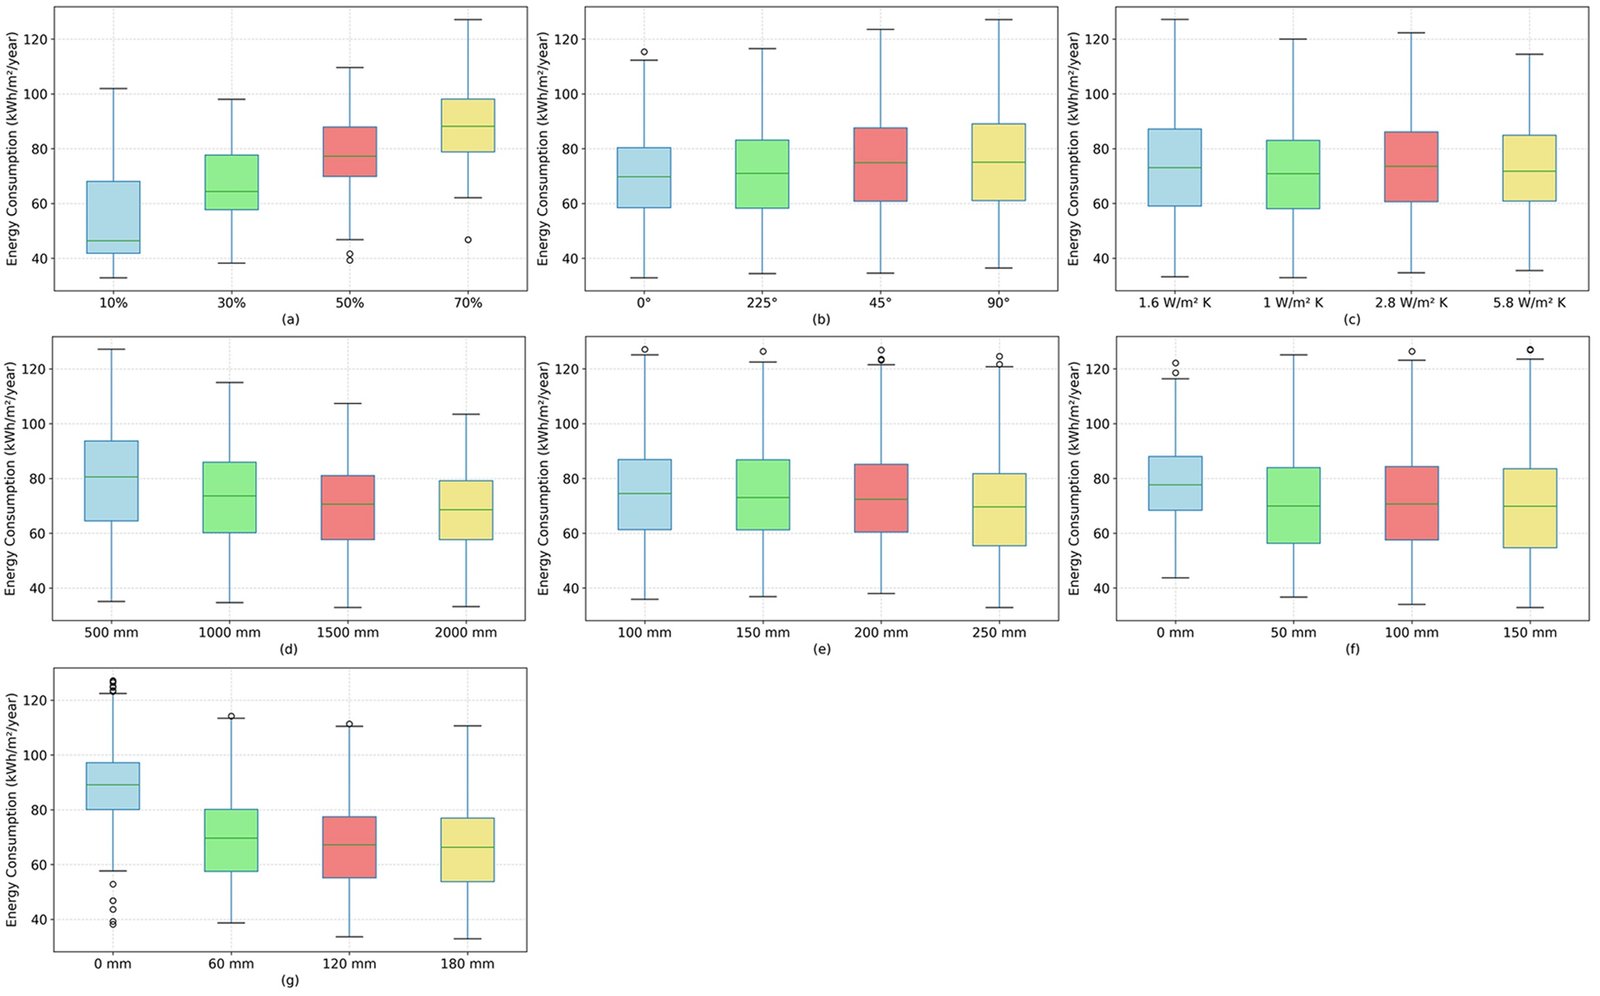
The trend of energy consumption, based on the simulation results, is illustrated in Fig. 7. The X1 appeared as the most influential variable responsible for energy consumption. A higher X1 consistently leads to increased building energy demand. In addition, X3 has also been demonstrated to be a significant input variable to the reduction of energy consumption, with glazing u value of 1.6 W/m2. K and 1.0 W/m2. K exhibiting a lower energy consumption rate in contrast to conventional glazing types ( value of 2.8 W/m2. K to 5.8 W/m2. K).
Figure 7
X1 = Window-to-wall-ratio [%]; X2 = Window orientation [°]; X3 = Glazing type [W/m2.K]; X4 = Shading depth [mm]; X5 = Wall thickness [mm]; X6 = Wall insulation thickness [mm]; X7 = Roof insulation thickness [mm]
Fig. 7. Energy consumption trends based on passive variables, (a) X1, (b) X2, (c) X3, (d) X4, (e) X5, (f) X6, (g) X7.
Similarly, the X6 and X7 input variables contributed to a significant reduction in energy consumption, with a clear and consistent decrease in median values as the thickness of insulation increased (Figs. 7f and 7g).
Other variables such as X2, X4 and X5 exhibited relatively smaller impacts. Nevertheless, the increased of X4 and X5 still contributed to energy reduction, although their influences are less pronounced than X1 and X4. These findings confirmed that passive design strategies focused on controlling window openings, adopting energy-efficient glazing, and optimising roof and wall insulation are key measures for minimising energy consumption of the naturally cross-ventilated space in tropical regions.
Moreover, from the 4,915 passive design combinations that were simulated, the baseline and average of energy consumption (Y) were 127.11 kWh/m²/year and 72.30 kWh/m²/year, respectively. Subsequently, the top ten best solutions with the lowest energy consumption (Y) were identified, as demonstrated in Table 5.
Table 5
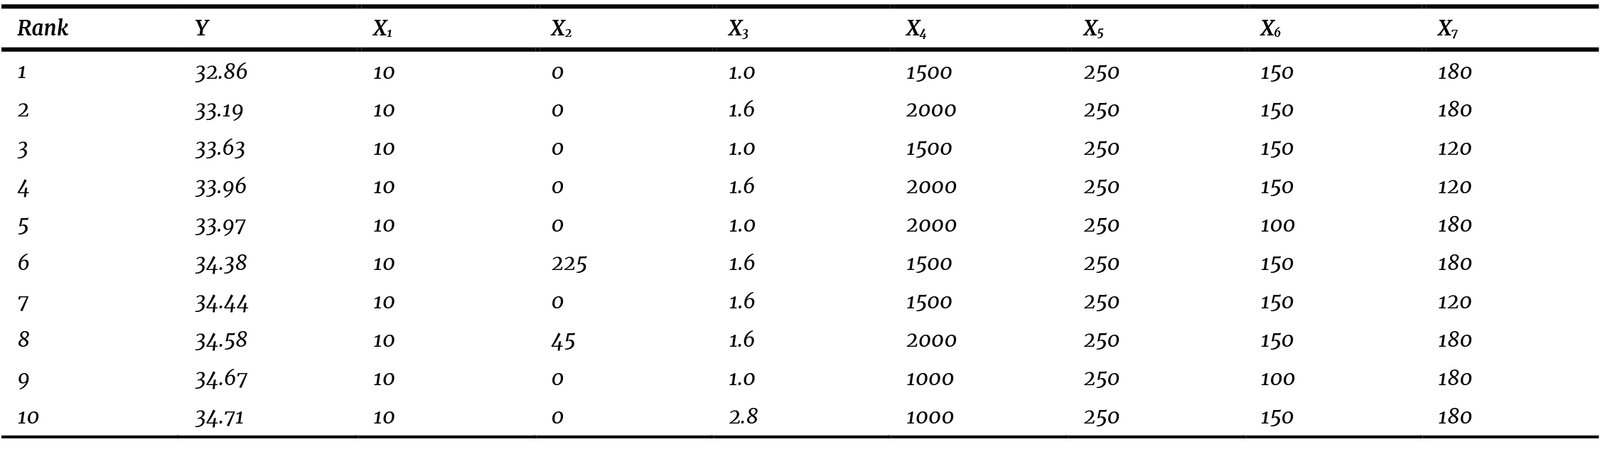
Table 5. The top ten best solutions with the lowest energy consumption.
The identification of the ten best design solutions indicated that configurations with the lowest energy consumption consistently apply passive strategies aimed at reducing cooling loads. All solutions adopted a X1 of 10%, which significantly limits heat gains from direct solar radiation. The most prevalent X2 was south–north (0°), as it provided relatively more stable exposure under tropical solar conditions.
In addition, for X3, the use of triple glazing and double low-e glazing was shown to be effective in controlling heat transfer, while shading depths of 1500–2000 mm enhanced solar protection without compromising daylighting.
On the other hand, the best results also highlight the importance of X5 and X6. All best-performing solutions showed X5 = 250 mm, which acts as a thermal buffer against outdoor temperature fluctuations, along with X6 of 100–150 mm that further strengthened control over lateral heat transfer. Meanwhile, X7 maintained values ranging between 120 to 180 mm, underscoring that the roof was the primary pathway for heat exchange in tropical spaces. Accordingly, passive design strategies for a cross-ventilated space that consider minimised openings, appropriate opening orientation, high performance glazing, optimal shading, and optimised thermal insulation of walls and roofs were proven to be effective solutions for achieving maximum energy efficiency.
3.4. Sensitivity analysis
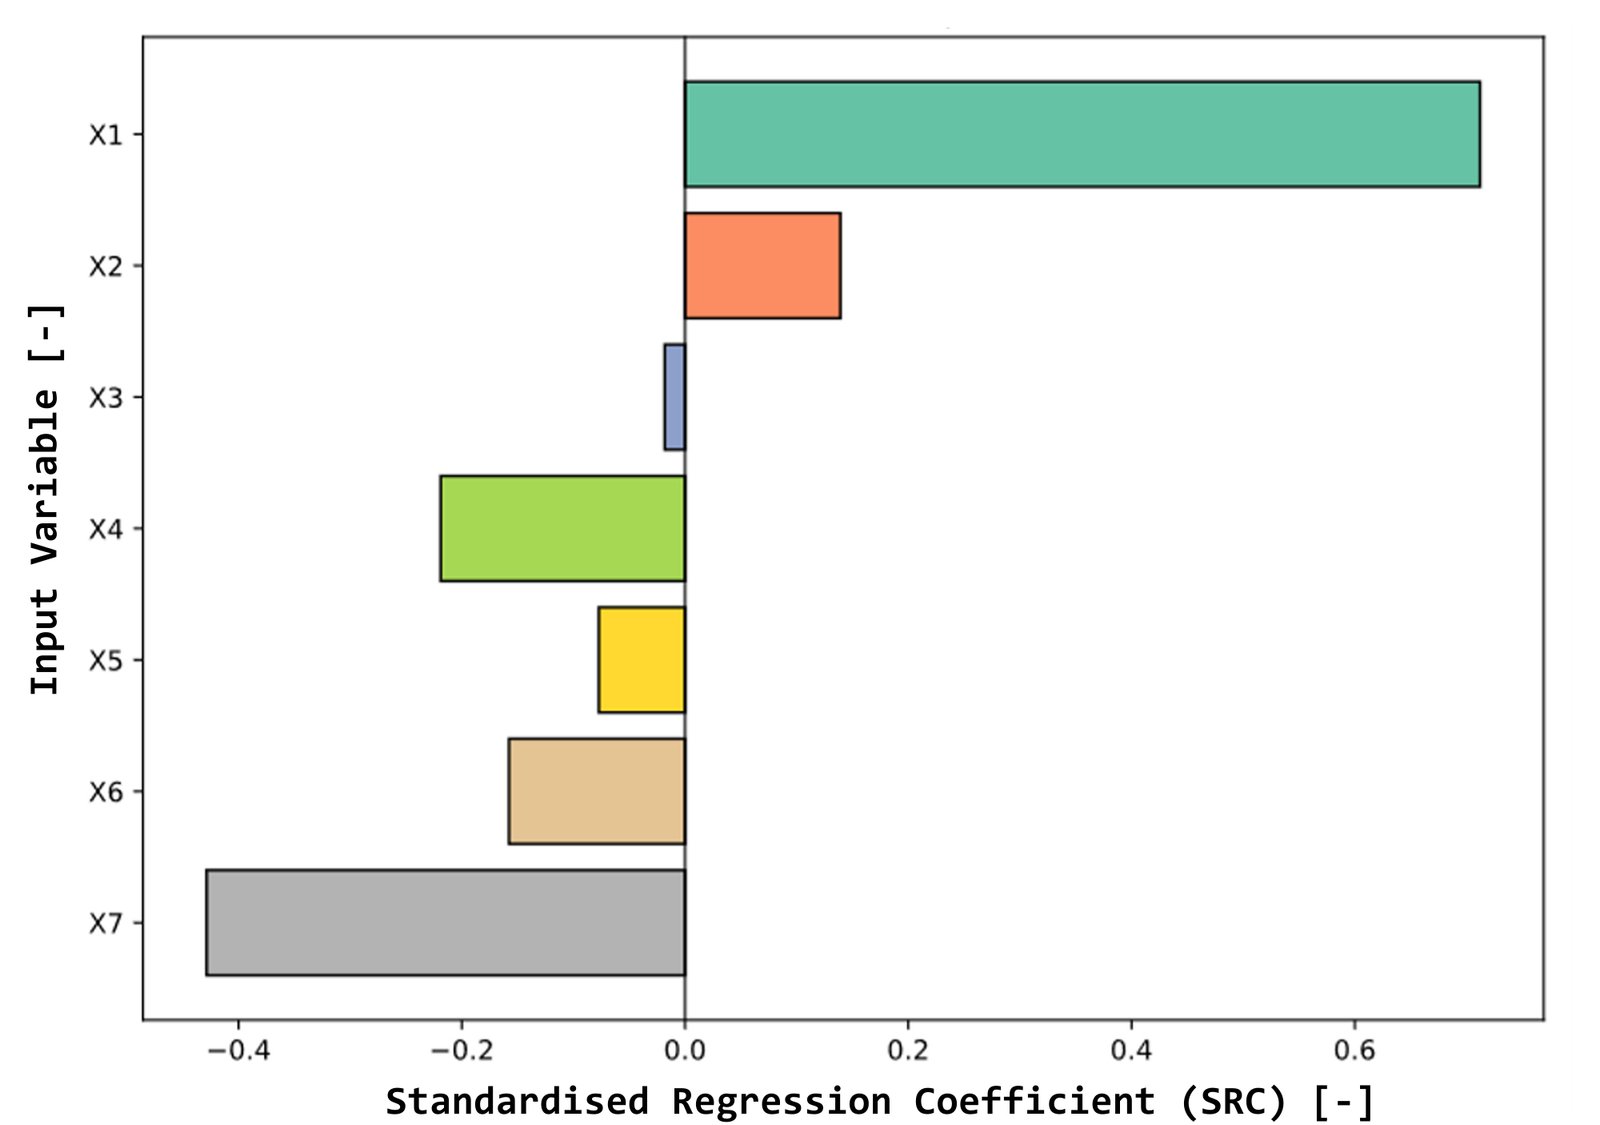
The sensitivity analysis using SRC reveals the relative influence of each passive design variable on energy consumption. Figure 8 illustrates the sensitivity levels of each input variable (X1–X7) with respect to specific energy consumption (Y). The analysis results indicated that X1 was the most influential input variable, exhibiting the largest positive influence. This implied that an increase in WWR leads to a significant rise in energy consumption. In contrast, X7 was discovered to have the strongest negative influence, highlighting its critical role in reducing energy demand. Other input variables, such as X2, showed a positive but relatively minor influence, while X4, X5, and X6 exhibited moderate negative influences. Meanwhile, X3 demonstrated a very limited influence. These findings emphasised that controlling X1 and implementing thermal insulation particularly for the X7 were key strategies for optimising the energy efficiency of the naturally cross-ventilated space in the tropics.
Figure 8
X1 = Window-to-wall-ratio [%]; X2 = Window orientation [°]; X3 = Glazing type [W/m2.K]; X4 = Shading depth [mm]; X5 = Wall thickness [mm]; X6 = Wall insulation thickness [mm]; X7 = Roof insulation thickness [mm]
Fig. 8. Standardised regression coefficient of all input variables.
3.5. Optimal design
The optimal design configuration achieves a minimum energy consumption of 32.86 kWh/m2/year, characterised by a low WWR, South-North orientation, triple glazing, adequate shading, and high insulation levels, as demonstrated in Table 6. This combination effectively reduces solar heat gain and improves thermal resistance, leading to improve energy performance. In terms of performance improvement, the optimised design demonstrates a substantial reduction in energy consumption compared to the baseline scenario. The baseline energy consumption of 127.11 kWh/m2/year is reduced to 32.86 kWh/m2/year, representing an approximate 74.1% reduction. This significant decrease highlights the effectiveness of integrating multiple passive design strategies in reducing cooling demand in tropical building space.
Table 6
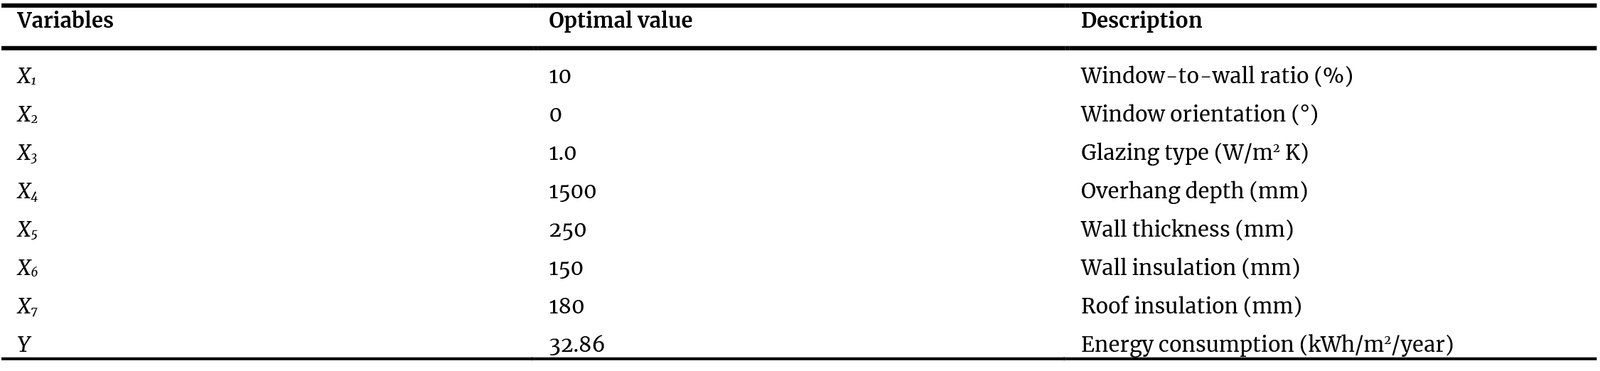
Table 6. Optimal passive design configuration.
4. Discussion
The validated THERB for HAM simulation result demonstrated strong agreement with field measurements, thus confirming its capability to reliably reproduce indoor thermal conditions in naturally ventilated tropical building spaces. The low validation error values indicate that the developed simulation framework provides a robust basis for evaluating passive design performance through simulation. This finding is consistent with recent studies highlighting the effectiveness of calibrated building performance simulation tools for predicting thermal behaviour and energy demand in warm-humid climates [42].
The implemented sampling strategy also demonstrated strong statistical robustness. The findings demonstrate that the implemented sampling strategy effectively achieves a uniform and unbiased representation of the multidimensional design space. The uniformity of proportions across all variables, with deviations generally within ±1%, indicates a high degree of sampling stability. This is of particular importance in the context of parametric building performance analysis, where the presence of uneven sampling has been shown to introduce bias and compromise the reliability of conclusions derived from simulation-based methods [38,40]. The high p-values obtained from the chi-square goodness-of-fit tests (p > 0.05) confirm that the observed distributions are statistically consistent with the expected uniform distribution. This finding suggests that the stratified sampling approach, when combined with constraints designed to ensure balanced representation of categorical variables, effectively mitigates the risk of over- or under-sampling specific parameter levels. This finding aligns with the results of recent studies, which have demonstrated that balanced sampling strategies significantly improve the robustness of building performance simulations [38]. The utilisation of LHS has been demonstrated the improvement of space-filling characteristics in high-dimensional problems, as highlighted in recent studies [26]. Moreover, the minimal variation observed across all variables supports the convergence analysis presented in the methodology section, indicating that the selected sampling size (30% of the total combinations) is sufficient to capture the variability of the full design space. This finding consistent with recent research demonstrating the effectiveness of optimised sampling strategies in achieving reliable convergence with fewer simulations, thereby improving computational efficiency [40-41].
From a design perspective, the results clearly demonstrate that passive design variables have varying levels of influence on energy consumption. The sensitivity analysis based on SRC, as illustrated in Fig. 6, provides a quantitative assessment of the relative importance of each variable. The WWR has the highest positive coefficient (SRC ≈ 0.7), which signifies it has the greatest influence on increased energy consumption. This finding confirms that larger glazing areas significantly increase solar heat gains, leading to higher cooling demand in tropical climates, as also reported in recent studies on façade design and energy performance [43,[44]]. Conversely, the roof insulation thickness had the most significant negative coefficient (SRC ≈ −0.4), highlighting its important role in reducing energy consumption [37]. This suggests the importance of minimising heat transfer through the roof, as this is usually the part of a building that is most exposed to solar radiation in tropical regions. These results reinforce the findings of [45], who reported that increasing thermal mass and implementing effective insulation can reduce energy consumption by up to 30% in buildings located in hot arid climates. It is evident that other variables, including shading depth, wall thickness, and wall insulation, demonstrate moderate negative influences, indicating their contribution to reducing heat gain. However, it is important to note that their effects are less significant compared to WWR and roof insulation thickness. The window orientation exhibited a relatively minor positive influence, while glazing type demonstrated negligible influence on energy consumption. The findings of this study indicate that solar control and thermal resistance are the predominant strategies that govern energy performance. This finding is consistent with recent studies on the optimisation of passive design in warm climates [46].
The combined passive design configuration demonstrates a substantial improvement in energy performance. The optimal design achieved a minimum energy consumption of 32.86 kWh/m2/year, compared to the baseline value of 127.11 kWh/m2/year, representing a reduction of approximately 74.1%. This considerable reduction serves to demonstrate the effectiveness of integrated passive design strategies in reducing cooling demand in tropical buildings. The 74.1% reduction achieved in the present study substantially exceeds values reported in comparable tropical climate studies [12], [19], [43]. Tong et al. [43] reported 18–32% cooling load reductions through façade optimisation in residential buildings in Singapore. Cheng et al. [19] achieved 31–47% cooling energy reductions for a tropical, mixed-mode building using calibrated simulations. Gigasari et al. [12] reported 40–55% energy savings across five distinct climates using combined window-to-wall ratio and shading optimisation. The higher magnitude of savings obtained in the present study reflects two contributing factors: first, the baseline scenario adopted, representing a high window–to–wall ratio (30% average), uninsulated, single-glazed building with no shading, which maximises the achievable improvement margin; and second, the simultaneous seven-variable optimisation employed here, which captures additive and synergistic savings across all envelope components rather than isolating individual measures. Furthermore, the optimal value is substantially lower than the simulated average of 72.30 kWh/m2/year, indicating strong interactions among passive design variables. This outcome agrees with the findings reported in [47], which indicated that multi-parameter envelope configuration yielded considerably greater energy savings in comparison to single-variable modifications.
The interaction between WWR and glazing type is revealed by the SRC results. Although the SRC of the glazing type is low, its effect is amplified when the WWR is high. This demonstrates a non-obvious multiplicative interaction that cannot be seen from single-variable analyses. This finding is consistent with previous optimisation studies reporting that the effect of glazing properties depends strongly on the proportion of glazed façade area, and that WWR and glazing characteristics should therefore be evaluated as coupled design variables rather than independently [11]. Notably, the unexpected finding that wall thickness showed a moderate but consistent negative impact, despite the prevailing assumption that thermal mass plays a minimal role in continuously hot-humid tropical climates compared to diurnal swing climates. However, recent studies have suggested that the effectiveness of thermal mass depends on its interaction with the overall building envelope, occupancy pattern, and cooling strategy, indicating that wall thickness can still contribute to reducing cooling loads under appropriate design conditions [48]. In addition, the observation that shading depth exhibits diminishing returns beyond 1500 mm, an insight that has direct cost-benefit implications for tropical building design [43]. Furthermore, a comparison of the achieved 74.1% energy reduction with values reported in comparable tropical climate studies (ranging from 20–45% for single-variable optimisations and 40–60% for multi-variable studies) demonstrates that the integrated strategy yields superior savings.
The simplified building model employed in this study incorporated the following specific simplifications, each adopted for a defined methodological reason: (1) a single-zone geometry (5 m × 5 m × 3 m) without internal partitions, which omits inter-room heat transfer and was adopted to isolate the thermal effect of the seven targeted input variables without confounding from internal zoning; (2) the exclusion of furniture, occupant metabolic rates, and internal equipment heat gains, adopted to isolate envelope-driven thermal performance from occupancy-pattern variability; (3) the assumption of uniform, defect-free construction quality throughout, adopted because construction-quality variation was outside the scope of the seven targeted design variables; and (4) the evaluation of cooling energy demand only, without simultaneous heating or mixed-mode HVAC operation, consistent with the focus on passive (non-mechanical) cooling strategies appropriate to the tropical climate context.
5. Conclusions
The present study developed and validated an integrated simulation-prediction framework for evaluating and optimising passive design strategies in naturally cross-ventilated tropical building spaces. The proposed framework integrates field-validated numerical simulation, LHS, and sensitivity analysis. This combination enables systematic exploration of multidimensional passive design alternatives with high computational efficiency.
The validation results confirmed that the THERB for HAM simulation model satisfies the accuracy criteria specified by ASHRAE, IPMVP, and FEMP, thereby ensuring the reliability of the simulation outputs. The implementation of LHS successfully generated a statistically balanced and representative dataset, allowing efficient coverage of the design space while reducing computational burden.
A sensitivity analysis was conducted, which identified the WWR as the most influential parameter contributing to increased energy consumption. In contrast, roof insulation thickness was identified as the most influential input variable for reducing cooling demand. The findings of this study demonstrate that the most effective passive strategies for tropical building applications are the control of solar heat gain through reduced glazing exposure and the improvement of thermal resistance through roof insulation. Notably, non-obvious interactions were also identified. Glazing performance exhibits a more significant influence as the glazing area increases, and there is a more pronounced effect when the WWR is larger. Additionally, wall thickness functions more like a roof insulation in alternating indoor thermal variations when combined with roof insulation. These insights that extend beyond the single-variable findings reported in prior research.
The optimal passive design configuration achieved a minimum annual energy consumption of 32.86 kWh/m2/year, representing a 74.1% reduction compared with the baseline scenario of 127.11 kWh/m2/year. This performance was achieved through a combination of smaller WWR of 10%, south-north window orientation, triple glazing, shading depth of 1500 mm, improved wall thermal mass, and increased wall and roof insulation thicknesses. Critically, a near-optimal cluster of configurations attains energy consumption within 5% of the identified minimum (28.8–30.4 kWh/m²/year), thus offering architects and engineers practical design flexibility. For instance, Rank 2 (29.1 kWh/m²/year) varies from the optimum only in shading depth (2000 mm vs. 1500 mm) and glazing type, while achieving near-identical performance. This design flexibility is particularly relevant in contexts where specific materials or geometries are constrained by cost or availability.
It is recommended that future studies incorporate additional performance indicators and apply them across a broader range of tropical climate zones and building typologies. The following specific directions are suggested for future work: (1) the integration of daylighting performance metrics, specifically useful daylight illuminance, daylight autonomy (DA), spatial daylight autonomy (sDA), and annual sunlight exposure (ASE), is employed to evaluate the trade-off between solar heat gain reduction and natural light provision, (2) multi-objective optimisation incorporating thermal comfort metrics alongside energy consumption, (3) validation and application of the framework across the eight main tropical climate subtypes in Indonesia, namely equatorial, sub-equatorial, highland tropical, very highland tropical, monsoonal, sub-monsoonal, savanna, and sub-savanna, and (4) the application of this concept to multi-zone and multi-storey building typologies is intended to account for inter-floor heat transfer and stacked ventilation effects.
Funding
This research is supported by The Ministry of Higher Education, Science, and Technology of the Republic of Indonesia through the Institute of Research and Community Services (LPPM) of Universitas Malikussaleh under the Fundamental Research Scheme 2025, under contract number 084/C3/DT.05.00/PL-MULTITAHUN LANJUTAN/2026, and sub-contract number 0013/UN45.3.1/AL.04/IV/2026.
Author Contributions
Muhammad Iqbal: Conceptualization, Methodology, Software, Validation, Formal analysis, Investigation, Resources, Data curation, Writing-original draft preparation, Writing-review and editing, Visualization, Funding acquisition. Atthaillah: Methodology, Software, Validation, Formal analysis, Investigation, Resources, Data curation, Writing-original draft preparation, Writing-review and editing. Mochamad Donny Koerniawan: Investigation, Writing-review and editing, Supervision, Project administration. Yulius Rief Alkhaly: Investigation, Writing-review and editing, Supervision, Project administration.
Acknowledgement
We would like to express our gratitude to Muhammad Dastur, Farhan Naufal, Lena Indriani, and Nazla Rahadatul Akifah Azmi for their contribution during the field experiment and simulation work. In addition, appreciation is extended to Qanitatul Isra Qamal and Abdul Razak Nawaf for their assistance with administrative tasks.
Declaration of competing interest
The authors declare that they have no known competing financial interests or personal relationships that could have appeared to influence the work reported in this paper.
References
- T. Bakirtas, A.G. Akpolat, The relationship between energy consumption, urbanization, and economic growth in new emerging-market countries, Energy, 147 (2018) 110-121. https://doi.org/10.1016/j.energy.2018.01.011
- I.E.A. (IEA), An Energy Sector Roadmap to Net Zero Emissions in Indonesia., Paris, France, (2023). [Online]. https://iea.blob.core.windows.net/assets/b496b141-8c3b-47fc-adb2-90740eb0b3b8/AnEnergySectorRoadmaptoNetZeroEmissionsinIndonesia.pdf?utm_source=chatgpt.com
- J. Panisilvam et al., Experimental study on the application of a Passive Displacement Dual Coil Cooling system in a tropical climate, Journal of Building Engineering, 104 (2025) 112252. https://doi.org/10.1016/j.jobe.2025.112252
- C.Y. Lee, S. Kaneko, A. Sharifi, Effects of building types and materials on household electricity consumption in Indonesia, Sustainable Cities and Society, 54 (2020) 1-3. https://doi.org/10.1016/j.scs.2019.101999
- D. Kajjoba, R. Wesonga, J.D. Lwanyaga, H. Kasedde, P.W. Olupot, J.B. Kirabira, Assessment of thermal comfort and its potential for energy efficiency in low-income tropical buildings: a review, Sustainable Energy Research, 12 (2025) 25. https://doi.org/10.1186/s40807-025-00169-9
- M.T. Sambodo, R. Novandra, The state of energy poverty in Indonesia and its impact on welfare, Energy Policy, 132 (2019) 113-121. https://doi.org/10.1016/j.enpol.2019.05.029
- A.B. Setyowati, Mitigating Energy Poverty: Mobilizing Climate Finance to Manage the Energy Trilemma in Indonesia, Sustainability, 12 (2020). https://doi.org/10.3390/su12041603
- G. Falchetta, E. De Cian, F. Pavanello, I.S. Wing, Inequalities in global residential cooling energy use to 2050, Nature Communications, 15 (2024) 7874. https://doi.org/10.1038/s41467-024-52028-8
- M. Hu, K. Zhang, Q. Nguyen, T. Tasdizen, The effects of passive design on indoor thermal comfort and energy savings for residential buildings in hot climates: A systematic review, Urban Climate, 49 (2023) 101466. https://doi.org/10.1016/j.uclim.2023.101466
- M. Zune, L. Rodrigues, M. Gillott, Vernacular passive design in Myanmar housing for thermal comfort, Sustainable Cities and Society, 54 (2020) 101992. https://doi.org/10.1016/j.scs.2019.101992
- V. Gupta, C. Deb, Envelope design for low-energy buildings in the tropics: A review, Renewable and Sustainable Energy Reviews, 186 (2023) 113650. https://doi.org/10.1016/j.rser.2023.113650
- A.R. Gigasari, M. Cañada-Soriano, C. Aparicio-Fernández, J.-L. Vivancos, Impact of Window-to-Wall Ratio (WWR) and shading on energy demand in a residential building across five distinct climates, Results in Engineering, 28 (2025) 107518. https://doi.org/10.1016/j.rineng.2025.107518
- N. Tahan, S. Banihashemi, F. Bagheri-Moghaddam, Passive design strategies and innovative materials for Net-Zero Energy Buildings, Green Technologies and Sustainability, 4 (2026) 100399. https://doi.org/10.1016/j.grets.2026.100399
- S. Hu, X. Zhou, D. Yan, F. Guo, T. Hong, Y. Jiang, A systematic review of building energy sufficiency towards energy and climate targets, Renewable and Sustainable Energy Reviews, 181 (2023) 113316. https://doi.org/10.1016/j.rser.2023.113316
- U.S. Perera, A.U. Weerasuriya, X. Zhang, R. Ruparathna, M.G.I. Tharaka, C.S. Lewangamage, Selecting suitable passive design strategies for residential high-rise buildings in tropical climates to minimize building energy demand, Building and Environment, 267 (2025) 112177. https://doi.org/10.1016/j.buildenv.2024.112177
- P.J. Axaopoulos, E.I. Sakellariou, G.P. Panayiotou, S. Kalogirou, Evaluation of the optimum insulation thickness of building external walls and roof based on human thermal comfort criterion, Renewable Energy, 247 (2025) 123058. https://doi.org/10.1016/j.renene.2025.123058
- N. Amani, Energy efficiency of residential buildings using thermal insulation of external walls and roof based on simulation analysis, Energy Storage and Saving, 4 (2025) 48-55. https://doi.org/10.1016/j.enss.2024.11.006
- R. Ma, R. Ma, E. Long, Analysis of the rule of window-to-wall ratio on energy demand of residential buildings in different locations in China, Heliyon, 9 (2023) e12803. https://doi.org/10.1016/j.heliyon.2023.e12803
- S. Cheng, Y. Heo, W. Xin, A. Chong, Assessing passive cooling strategies for a tropical mixed-mode building using calibrated simulations, Energy and Buildings, 360 (2026) 117376. https://doi.org/10.1016/j.enbuild.2026.117376
- I. Elwy, A. Hagishima, The artificial intelligence reformation of sustainable building design approach: A systematic review on building design optimization methods using surrogate models, Energy and Buildings, 323 (2024) 114769. https://doi.org/10.1016/j.enbuild.2024.114769
- M. Niknami, S. Masoud, A comparative climate-based assessment of passive cooling strategies in buildings, Energy Conversion and Management: X, 31 (2026) 102014. https://doi.org/10.1016/j.ecmx.2026.102014
- A.S. Cruz, L.R. Caldas, V.M. Mendes, J.C. Mendes, L.E.G. Bastos, Multi-objective optimization based on surrogate models for sustainable building design: A systematic literature review, Building and Environment, 266 (2024) 112147. https://doi.org/10.1016/j.buildenv.2024.112147
- A.M. Nugroho, T. Kubota, M.N.F. Alfata, F.A. Putri, W. Iyati, Passive design strategies of vernacular houses in the hot-humid climate of Indonesia, VITRUVIO - International Journal of Architectural Technology and Sustainability, 11 (2026). https://doi.org/10.4995/vitruvio-ijats.2026.24735
- F. Binarti, T. Kubota, A Review of Passive-Cooling Techniques for Buildings in Hot-Humid Climate Zones, Buildings, 16 (2026). https://doi.org/10.3390/buildings16122288
- M. Ali et al., AI-driven analysis of window-wall systems: Predicting energy consumption in educational buildings, Case Studies in Thermal Engineering, 78 (2026) 107591. https://doi.org/10.1016/j.csite.2025.107591
- M. Boschini, D. Gerosa, A. Crespi, M. Falcone, "LHS in LHS": A new expansion strategy for Latin hypercube sampling in simulation design, SoftwareX, 31 (2025) 102294. https://doi.org/10.1016/j.softx.2025.102294
- BMKG, Profil Stasiun Meteorologi Malikussaleh - Lhokseumawe.,. Accessed: Jan. 10, 2026. [Online]. https://www.bmkg.go.id/
- A. Ozaki, T. Tsujimaru, Prediction of hygrothermal environment of buildings based upon combined simulation of heat and moisture transfer and airflow, IBPSA 2005 - International Building Performance Simulation Association 2005, (2005) 899-906.
- Y. Choi, W. Cho, A. Ozaki, H. Lee, Influence of the moisture driving force of moisture adsorption and desorption on indoor hygrothermal environment and building thermal load, Energy and Buildings, 253 (2021) 111501. https://doi.org/10.1016/j.enbuild.2021.111501
- ASHRAE 14, Measurement of Energy, Demand, and Water Savings, ASHRAE Guideline 14-2014, 4 (2014) 1-150.
- Efficiency Valuation Organization, International Performance Measurement & Verification Protocol, Handbook of Financing Energy Projects, I (2016) 122.
- U.S. Department of Energy-Federal Energy Management Program, M&V guidelines: measurement and verification for performance-based contracts -Version 4.0, U.S. Department of Energy, 3 (2015) 1-108.
- Q. Yi, G. Zhang, M. König, D. Janke, S. Hempel, T. Amon, Investigation of discharge coefficient for wind-driven naturally ventilated dairy barns, Energy and Buildings, 165 (2018) 132-140. https://doi.org/10.1016/j.enbuild.2018.01.038
- P. Heiselberg, M. Sandberg, Evaluation of discharge coefficients for window openings in wind driven natural ventilation, International Journal of Ventilation, 5 (2006) 43-52. https://doi.org/10.1080/14733315.2006.11683723
- M. Iqbal, A. Ozaki, Y. Choi, Y. Arima, T. Hamashima, Investigation of discharge coefficient of louvre openings in naturally ventilated buildings, E3S Web of Conferences, 396 (2023) 1-8. https://doi.org/10.1051/e3sconf/202339602030
- Climate One Building, Repository of free climate data for building performance simulation,. [Online]. https://climate.onebuilding.org/WMO_Region_5_Southwest_Pacific/IDN_Indonesia/index.html
- C. Li, Y. Chen, Modeling and optimization method for building energy performance in the design stage, Journal of Building Engineering, 87 (2024) 109019. https://doi.org/10.1016/j.jobe.2024.109019
- Y. Choi, D. Song, S. Yoon, J. Koo, Comparison of Factorial and Latin Hypercube Sampling Designs for Meta-Models of Building Heating and Cooling Loads, Energies, 14 (2021). https://doi.org/10.3390/en14020512
- J. Sun, G. Lv, X. Ma, An improved typhoon simulation method based on Latin hypercube sampling method, Scientific Reports, 12 (2022) 9313. https://doi.org/10.1038/s41598-022-13151-y
- W. Tian, M. Jin, P. de Wilde, X. Fu, G. Li, Uncertainty analysis of building energy analysis based on replicated Latin Hypercube sampling, Sep. 2021. https://doi.org/10.26868/25222708.2021.30246
- A.Y. Seidu, E. Twumasi, E.A. Frimpong, Hybrid optimized artificial neural network using Latin hypercube sampling and Bayesian optimization for detection, classification and location of faults in transmission lines, AIMS Electronics and Electrical Engineering, 8 (2024) 508-541. https://doi.org/10.3934/electreng.2024024
- M. Iqbal, A. Ozaki, Y. Choi, Y. Arima, Performance Improvement Plan towards Energy-Efficient Naturally Ventilated Houses in Tropical Climate Regions, Sustainability (Switzerland), 15 (2023). https://doi.org/10.3390/su151612173
- S. Tong, J. Wen, N.H. Wong, E. Tan, Impact of facade design on indoor air temperatures and cooling loads in residential buildings in the tropical climate, Energy & Buildings, 243 (2021) 110972. https://doi.org/10.1016/j.enbuild.2021.110972
- M. Iqbal, Atthaillah, A. Nayan, L. Indriani, The Effect of Openings Type on Indoor Temperature of Naturally Ventilated Buildings in The Tropical Climate, Journal of Applied Science and Engineering, 28 (2024) 1769-1777.
- E. Alayed, D. Bensaid, R. O'Hegarty, O. Kinnane, Thermal mass impact on energy consumption for buildings in hot climates: A novel finite element modelling study comparing building constructions for arid climates in Saudi Arabia, Energy and Buildings, 271 (2022) 112324. https://doi.org/10.1016/j.enbuild.2022.112324
- N. Ziasistani, A. Meana-Fernández, A.J. Gutiérrez-Trashorras, Optimization of the Performance of Double-Skin Façades Across Six Climates: Effects of Orientation, Blinds, and Overhangs on Energy Efficiency and Carbon Emissions, Thermo, 5 (2025). https://doi.org/10.3390/thermo5040053
- J. Xu et al., Optimization of a Design Process and Passive Parameters for Residential Nearly Zero Energy Building Envelopes Based on Energy Consumption Targets, Energy, 165 (2018) 591-613. https://doi.org/10.1016/j.energy.2018.09.019
- K.A. Quagraine, E.W. Ramde, Y.A.K. Fiagbe, D.A. Quansah, Evaluation of time lag and decrement factor of walls in a hot humid tropical climate, Thermal Science and Engineering Progress, 20 (2020) 100758. https://doi.org/10.1016/j.tsep.2020.100758
Disclaimer/Publisher’s Note: The statements, opinions and data contained in all publications are solely those of the individual author(s) and contributor(s) and not of Solarlits and/or the editor(s). Solarlits and/or the editor(s) disclaim responsibility for any injury to people or property resulting from any ideas, methods, instructions or products referred to in the content.
 Get PDF (8.16 MB)
717
Total views
Citations
SHARE ON


