
Article | 14 October 2026
Volume 13 Issue 2 pp. 646-659 • doi: 10.15627/jd.2026.35
Optimizing the Tree Allocation Problem for Sustainable Neighborhoods Using Surrogate Models for Daylight, Solar Radiation, Outdoor Comfort, and View Assessment
Ilgın Çataroğlu Coğul,* Zehra Tuğçe Kazanasmaz, Berk Ekici
Author affiliations
Department of Architecture, Faculty of Architecture, Izmir Institute of Technology, 35430 Urla, Izmir, Türkiye
*Corresponding author.
ilgincataroglu@iyte.edu.tr (I. Çataroğlu-Coğul)
tugcekazanasmaz@iyte.edu.tr (Z. T. Kazanasmaz)
berkekici@iyte.edu.tr (B. Ekici)
History: Received 29 June 2026 | Revised 12 August 2026 | Accepted 26 August 2026 | Published online 14 October 2026
Copyright: © 2026 The Author(s). Licensee Solarlits Limited (Hong Kong). This is an open access article distributed under the terms and conditions of the Creative Commons Attribution 4.0 License.
Citation: Ilgın Çataroğlu Coğul, Zehra Tuğçe Kazanasmaz, Berk Ekici, Optimizing the Tree Allocation Problem for Sustainable Neighborhoods Using Surrogate Models for Daylight, Solar Radiation, Outdoor Comfort, and View Assessment, Journal of Daylighting, 13:2 (2026) 646-659. doi: 10.15627/jd.2026.35
Figures and tables
 Table 8
Abstract
Designing sustainable neighborhoods involves conflicting objectives. The complex parameters of neighborhoods make it challenging for designers to achieve these objectives. While trees provide shading for pedestrians and increase thermal comfort, they reduce solar radiation by shading building facades. They affect the amount of daylight entering indoors and the outdoor view. In addition to trees, it is necessary to consider building parameters and their effects on neighborhood performance while designing sustainable neighborhoods. Existing studies offer limited approaches to integrating tree allocation and building parameters, and further research is necessary to achieve multiple performance objectives using machine learning while overcoming the computational load of neighborhood simulation. This study aims to quantify the impacts of building parameters and tree placement on daylighting, solar radiation, view, and Universal Thermal Climate Index (UTCI). It generates a parametric model in Rhino/Grasshopper, including L-shaped, rectangular, and square buildings with random and grid tree allocation parameters. It uses an Artificial Neural Network (ANN) model to reduce the computational load of simulations and to provide a decision-support system that addresses complex neighborhood problems arising from combinations of tree allocation and building parameters. 1000 samples for each model, obtained from simulation, were used to train the ANN. The model successfully predicted incident solar radiation and UTCI with R² values exceeding 0.99. The optimization highlighted that grid allocation decreased UTCI to 31.15 °C, while random allocation performed 31.30 °C. The grid system minimized UTCI to 31.15 °C, increasing solar radiation to 1.33 kWh/m². L-shaped buildings decreased UTCI, while rectangular buildings increased the green view ratio to 97%. Furthermore, rectangular buildings receive daylight more uniformly than square or L-shaped forms. There is no single solution for neighborhood design; however, creating design alternatives enables designers to make data-driven decisions during the conceptual design process to identify building and tree parameters for sustainable neighborhoods.
Keywords
sustainable neighborhoods, solar radiation, daylight, machine learning
1. Introduction
Sustainability prioritizes energy efficiency while improving the quality of the living environment for occupants [1]. Daylight is a significant resource for sustainability in supporting renewable energy. It provides necessary natural lighting and passive heating energy for both indoor and outdoor spaces [2]. Daylight has benefits, including increasing the perception of time, improving sleep quality and mood, and reducing stress for occupants. It is beneficial for both the physical environment and overall human health [3],[4].
Designers aim to use daylight efficiently as a renewable energy source and maximize the solar potential of buildings [5],[6]. However, considering buildings separately from their context prevents the collection of comprehensive data. Surrounding buildings, open spaces, and trees affect daylight capacity and energy consumption [4], [7]. Therefore, buildings should be evaluated together with other elements in the neighborhood. Urban characteristics such as building typologies, heights, placement, and orientation affect daylight and other objectives [8]. Conflicting objectives and the complex morphological factors of the urban environment make performance simulations difficult [9], [10].
Considering urban characteristics, including tree placement, is necessary in the design process to create sustainable environments. While trees enhance the green view ratio, increase occupant satisfaction, and reduce stress, they can also block daylight from entering indoors [11]. Designing buildings around daylight may negatively affect the green view ratio. Besides improving green view, trees enhance outdoor thermal comfort through their shading and moisture effects, especially during the summer [12]. However, their shading can block the façade, reducing the potential for incident solar radiation.
These conflicting effects of trees cause a trade-off between indoor daylighting and visual comfort, incident solar radiation, green view ratio, and outdoor comfort. Therefore, tree designs require evaluating the effects of different placements, heights, and numbers together with buildings. This study seeks a solution to the question: “How can we allocate trees to maximize incident solar radiation, daylighting, and green view ratio while bringing UTCI into the comfort zone in sustainable neighborhoods by using artificial intelligence?” in İzmir, which has a hot-summer Mediterranean climate. The study aims to minimize UTCI and maximize incident solar radiation while maintaining daylighting and the green view ratio within optimal ranges, and it contributes to the literature by providing a decision-support system for sustainable neighborhood design.
2. Theoretical background
2.1. Daylighting in neighborhoods
Daylight availability and quality impact indoor daylight performance. Daylight availability is the amount of daylight received and is related to the quantity of daylight [13]. Daylight quality refers to indoor daylight conditions, including uniformity, glare, and visual comfort. Daylight quality can be measured by metrics such as Spatial Daylight Autonomy (sDA), defined in the IES LM-83 daylight standards [14]. sDA aims to provide a floor area percentage that receives daylight over 300 lux in 50% of the time spent indoors. Another metric, Annual Sunlight Exposure (ASE), is defined in the standard as the percentage of floor area exposed to more than a specified amount of direct sunlight over a certain number of hours annually [14]. Useful daylight illuminance (UDI) is a metric that ensures more effective use of daylight. It measures the percentage of the time that provides sufficient daylight (mostly 100-2000 lx) without glare [15]. These metrics help measure indoor daylighting conditions and depend on building and neighborhood design characteristics. One design characteristic of neighborhoods is the presence of obstructions in the surrounding environment of buildings. Buildings located on both sides of streets are considered geometric obstructions; as building heights increase, they narrow the view of the sky, directly affecting metrics such as solar radiation and UTCI [16], [17]. They reduce the amount of daylight that reaches the ground and indoors. Higher obstructions reduce availability by blocking daylight and shortening daylight hours due to shadowing. According to a study, as the heights of surrounding buildings increased, the obstruction angle also increased, blocking access to direct sunlight. An increase in obstruction angle from 25° to 40° reduced available sunlight hours from 8 to 3.28 h. When the angle reached 65°, the buildings did not receive direct sunlight, underscoring the importance of accounting for surrounding buildings as obstructions that block daylight [18]. A study conducted in China in the Northern Hemisphere concluded that daylight can be maximized by optimizing the placement of high-rise buildings in the north and low-rise buildings in the south. This ensures that the ground floors of the buildings in the north also receive daylight. Therefore, reducing shading from surrounding buildings increases passive solar heat gain while heating and lighting energy loads decrease [8]. According to a study conducted in China, in a severe cold climate zone in the Northern Hemisphere, building forms also affect daylight performance. Square buildings increase daylight availability compared to rectangular ones. While rectangular buildings create long, uninterrupted rows, causing more shadowing and obstructing surrounding buildings, square buildings experience no obstruction even when sunlight arrives at oblique angles in winter, resulting in more sunlight hours. The orientation of these buildings impacts indoor daylight levels.
Buildings facing south-east or south-west receive more sunlight during winter, while west-facing buildings get excessive sunlight during the summer. The north side cannot benefit from daylight [19]. Denser neighborhood layouts also obstruct daylight. The lower and middle floors of the buildings get less daylight than the upper floors. According to a study, shadows by surrounding buildings reduce the vertical daylight factor from 35%-40% on the upper floors to 10% on the lower floors. [19]. Surrounding vegetation causes obstruction as well. Ignoring trees as obstructions and excluding them from simulations overestimates indoor daylight levels and yields inaccurate simulation results [20]. A study concludes that a negative correlation exists between sDA and Green View Index, showing that higher tree density reduces the amount of daylight entering through windows [11]. Another one evaluating the distance of trees from the building showed that trees reach their fully leafed form in summer. In this form, they reach their maximum blocking glare capacity. When trees are located 10 meters away from the building, useful daylight illuminance decreases while glare decreases from 1.83% to 0.33% in the northern hemisphere. Therefore, even though they reduce the amount of useful daylight entering as they approach it, they prevent excessive daylight and improve visual comfort [21].
2.2. Indoor comfort and green view ratio
Daylight affects occupants’ indoor comfort, which can be measured using daylight metrics. Since daylight is intense during midday, indoor glare levels increase as well. Particularly in places without trees, the Daylight Glare Probability (DGP) exceeded 38% for 6% of working hours during the summer months, creating an uncomfortable environment for occupants [21]. Trees can reduce glare by blocking the light, thereby improving visual comfort. Incorrect placement of trees or their distance to the building can block most of the daylight and result in low UDI. For example, in Slovakia (Northern Hemisphere), in a scenario with no trees, the autonomous UDI (UDIa) covered 61.31% of the occupied hours, but this dropped to 45.54% when trees were placed 10 meters away from the building [21], [22]. Therefore, a balance is necessary between glare reduction and adequate daylighting. While trees block daylight, they also create a view for indoor occupants. When occupants look out the window and see green spaces and trees, their stress levels decrease, leading to positive psychological effects, including improved mental health and sleep quality [15]. Therefore, an interior space with optimal daylighting levels, free of distractions, and with a view of trees positively affects users.
2.3. Solar radiation and outdoor comfort
Daylight is not only a light source, but also a visible component of solar radiation. In dense urban environments, the solar radiation on facades decreases due to the shadow effects of surrounding buildings [23]. Trees also affect incident solar radiation by casting shadows. A study conducted in Canada, which has a cold climate, showed that during the summer, tall trees on the west and east sides of the building cause significant losses of up to 32%, while those on the north side have no impact. The shorter trees (10-15m) have less effect compared to the tall ones [24]. Therefore, designing optimal distances, numbers, and arrangements of trees is important during the neighborhood design process. Tree placement affects solar energy production and is also important for outdoor use [12]. The Universal Thermal Climate Index (UTCI) is an indicator of outdoor thermal comfort [25]. UTCI is calculated by measuring air temperature, relative humidity, wind speed, and mean radiant temperature. 9 °C to 26 °C is the thermal comfort zone for outdoors [12]. The UTCI stress categories and comfort threshold values are given in Table 1.
Table 1
![UTCI stress categories and comfort threshold values [26].](figures/13-646-10.jpg)
Table 1. UTCI stress categories and comfort threshold values [26].
Optimal tree allocation reduces overheating outdoors and increases thermal comfort. An increased number of trees alone is not enough to achieve this. Placing the right number and density of trees lowers UTCI values [12]. As outdoor shadows increase, perceived temperature decreases, and outdoor use increases in summer [11], [27]. In Australia, in a region with a humid subtropical climate, dense clustering of trees along walkways and common spaces was found to reduce UTCI levels above 39°C by 22% and increase thermal comfort by 18% [12]. In another study in a Mediterranean city, a deciduous tree planted 3 meters from the west facade reduced heating energy by 40%, with 2 or 3 trees being optimal. On the north facade, planting multiple evergreen trees would block sunlight and increase heating loads; therefore, a single tree placement is suitable for this facade [28]. In Cairo (hot desert), optimization showed that, instead of a randomly arranged 43 trees, using 33 trees arranged in an ordered pattern, accounting for common areas and wind speed, reduced the UTCI from 38°C to 37.55°C [29]. In the same city, a high-density tree arrangement of 50% along sidewalks in east-west oriented canyons reduced the thermal comfort index by 13-14 degrees [30]. In the Beijing example, trees arranged asymmetrically with gaps in certain areas blocked the west sun and allowed the east sun to enter the interiors, increasing sDA by 6% and improving outdoor UTCI by 1.31% [11]. Table 2 provides information on the variables, locations, climates, dependent variables, and simulation tools used in the previous literature.
Table 2
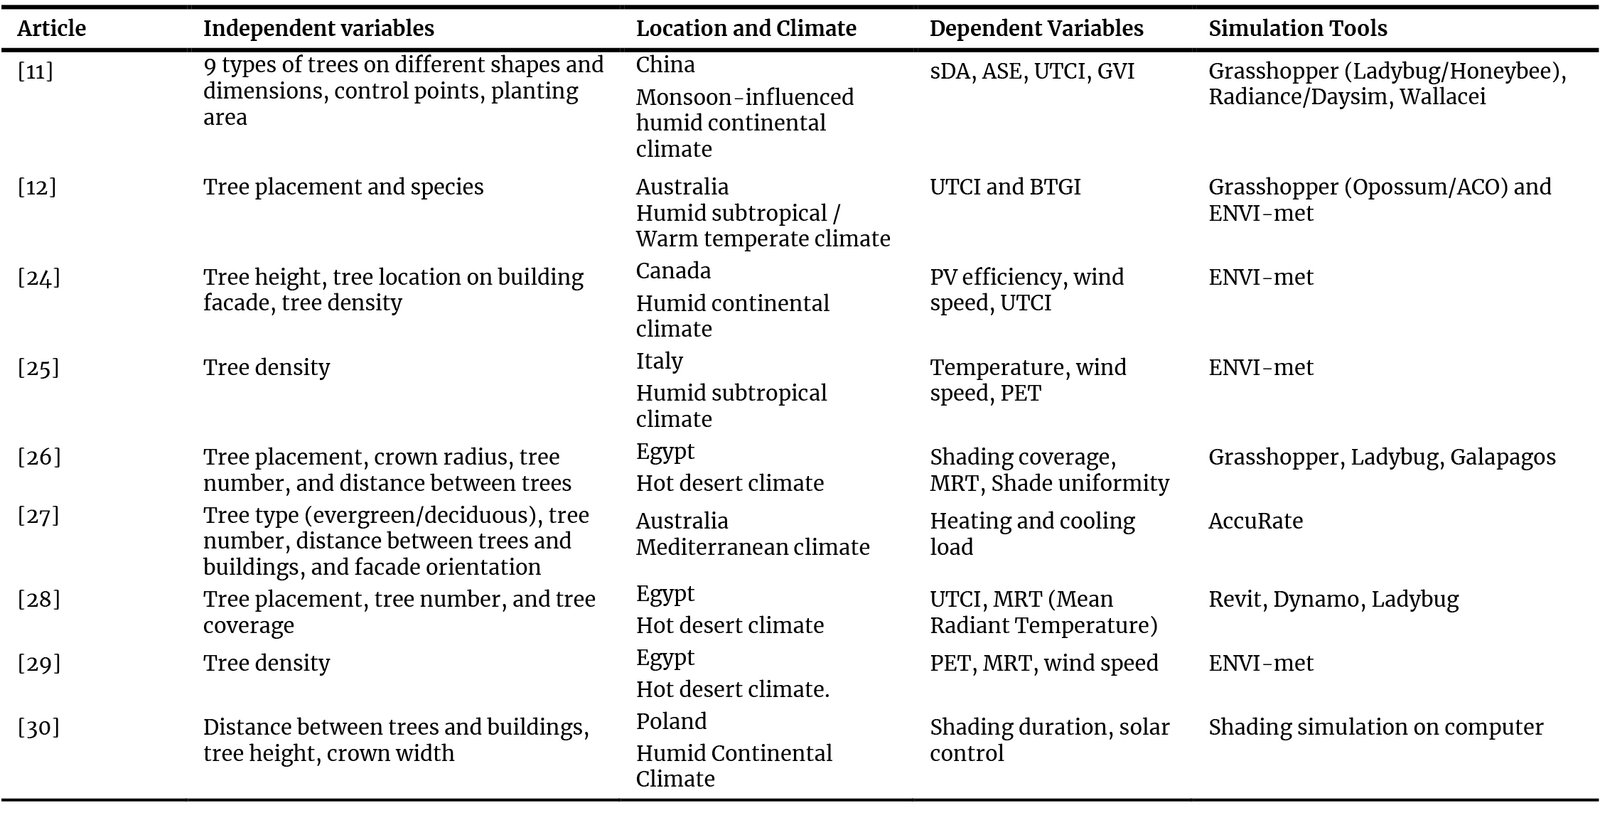
Table 2. Summary of previous literature including tree variables.
While the studies included in this table focus on detailed research on trees, the literature lacks a comprehensive approach that considers tree allocations and building typologies as variables in relation to conflicting performance objectives at the neighborhood scale, particularly in hot-summer Mediterranean climates like İzmir. These conflicting objectives have been addressed previously in the literature, but solar radiation, UTCI, daylight, and view have not been considered simultaneously. To fill this gap, this study aims to provide a solution that uses machine learning (ANN) to resolve conflicting objectives by combining building typologies and tree allocation scenarios at the neighborhood scale. This integrated approach offers designers a way to evaluate complex neighborhood parameters while reducing simulation time.
3. Methodology
This study employs a five-step methodology as shown in Figure 1. Establishing a grid system representing a hypothetical neighborhood in Grasshopper is necessary to generate design variations. The grid model includes parametrically adjustable trees and buildings. Performance simulations, including daylight, solar radiation, outdoor comfort, and green view ratio, are conducted. The model enables the generation of a dataset of design alternatives, with parameters as inputs and performance results as outputs. The dataset is used to train an artificial intelligence algorithm, Artificial Neural Network (ANN). The ANN model learns how changes in neighborhood variables affect performance. The multi-objective optimization algorithm investigates the most efficient configurations using ANN predictions. Optimal design alternatives on the Pareto front are identified and compared. The research utilizes Rhino/Grasshopper for the parametric model, Honeybee for daylight and UTCI, Ladybug for solar radiation, Isovist for view, and Wallacei for optimization. Further sub-headings explain the methodology in detail.
Figure 1
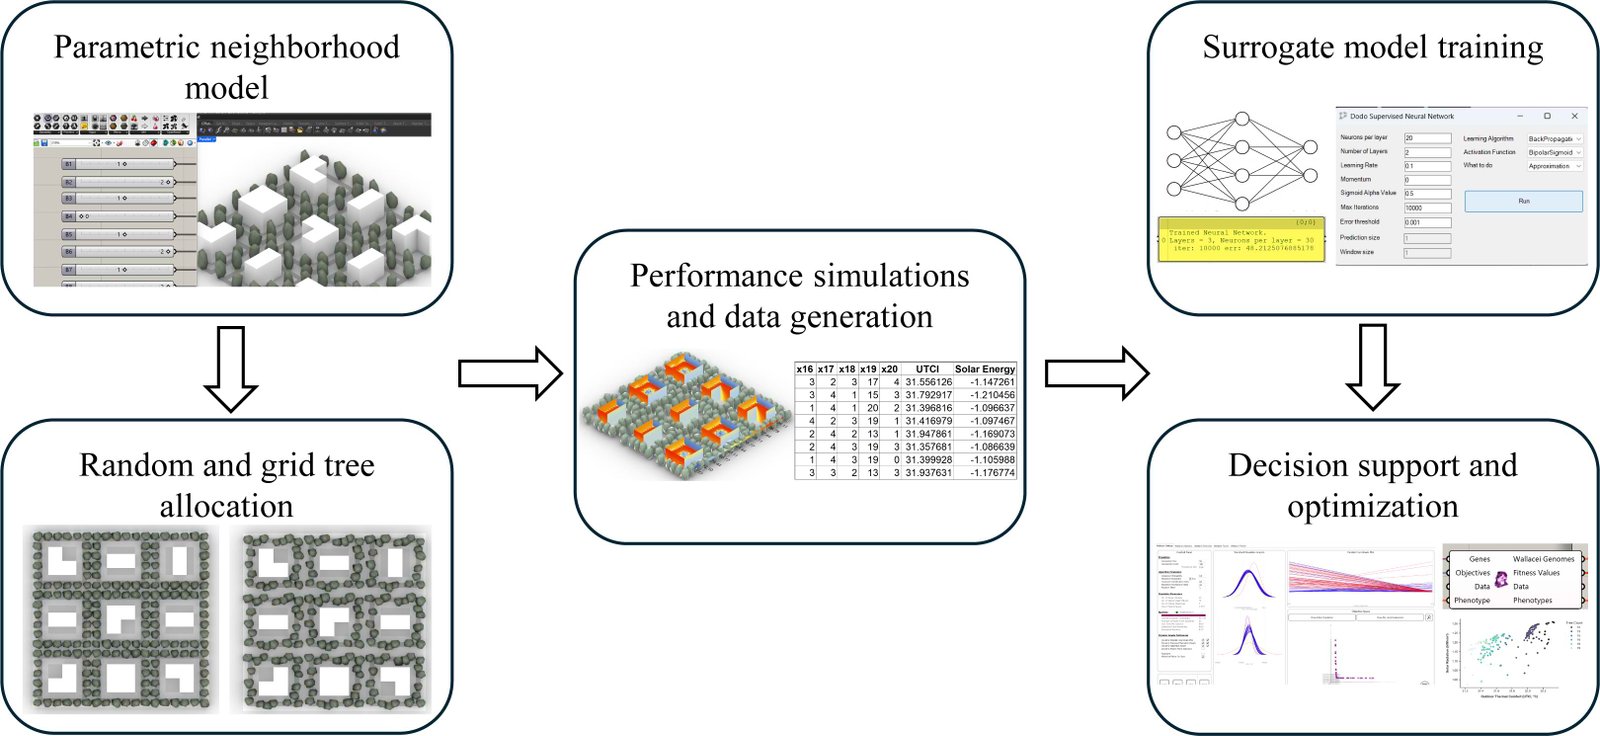
Fig. 1. Methodological flowchart.
3.1. Parametric neighborhood model
This study aims to generate neighborhood variations by creating a parametric model in Rhino-Grasshopper. The model represents a hypothetical neighborhood in İzmir, based on a 3x3 grid. The model generation method is useful for simplifying complex site conditions and enabling more controlled analysis [32]. Each grid is 50x50 meters. The parcel size is 46 x 46 meters, with a 4-meter offset in the grid. Trees are located within a 3-meter perimeter in these parcels. Buildings are placed 5 meters offset from the tree perimeter. Figure 2 demonstrates the L-shaped, square, and rectangular building typologies and parametric model dimensions. These buildings are parametric and placed on each parcel. L-shaped buildings have four variations: north-facing, south-facing, east-facing, and west-facing. Rectangular buildings can be oriented in two directions: north-south and east-west.
Figure 2
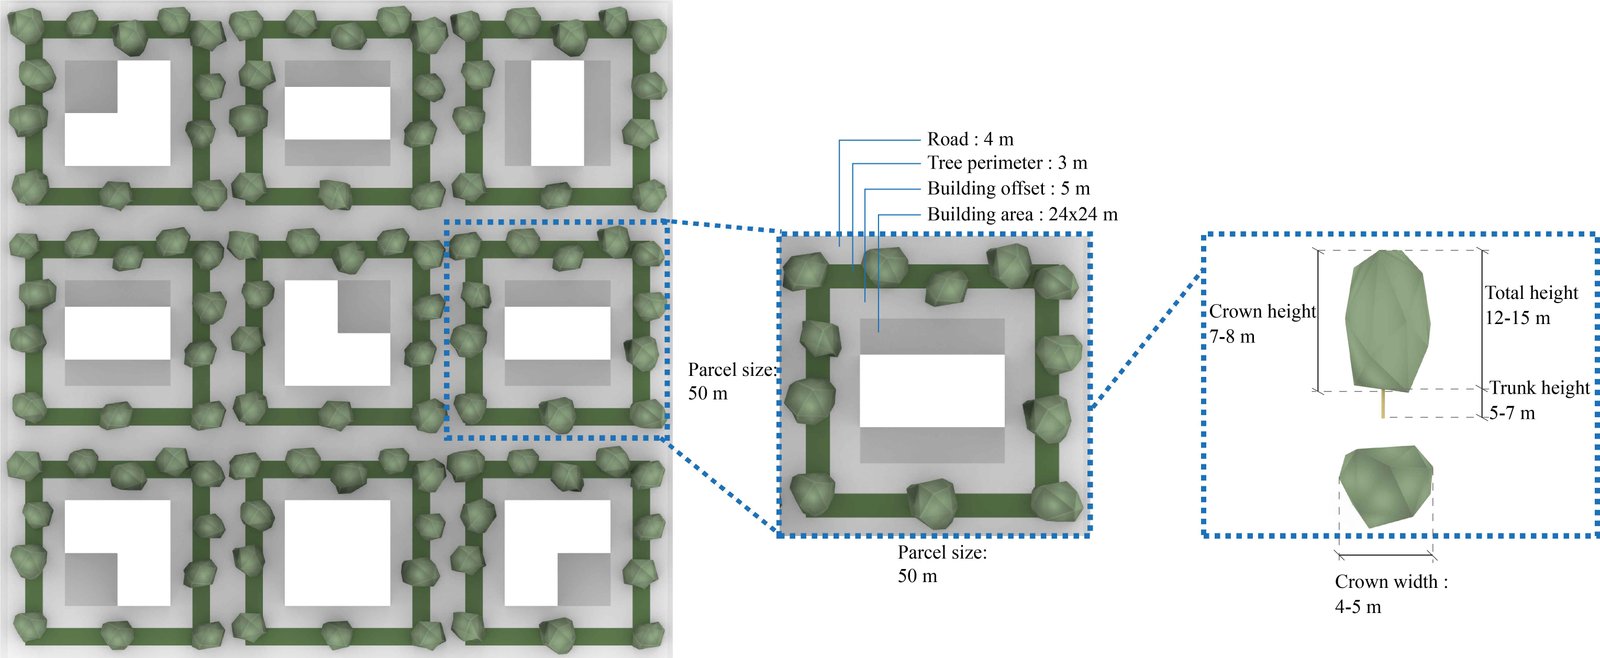
Fig. 2. Parametric model and tree dimensions.
The selected building forms are configurations commonly used in the literature [8], [33]. These configurations have been used to provide geometric variety in studies involving objectives such as daylight and solar radiation. Complex geometries outside these are excluded to isolate the effects of trees and buildings together. The square building is placed entirely within the remaining floor area left from setbacks. The rectangular building is adjusted so that its shorter side is 12 m, allowing the dwelling to comfortably fit within the interior plan [34]. In the L-shaped building, one corner of the square building is removed, with a length of 12 meters. Thus, the buildings are designed to be both deep enough to test daylight and long enough to avoid insufficient building plan design. Mid-rise buildings can be 5-12 stories; the average height of 6-story buildings is taken as 18 meters [35].
The 18-meter height is chosen to better observe the effect of the trees when determining the mid-rise height of the buildings. Trees that are 12-15 meters tall would only provide shade affecting the lower floors of very tall buildings, so mid-rise buildings are chosen as an appropriate option.
Figure 3 illustrates the relationship between the defined building and tree parameters and the objectives. The form and orientation of buildings, and their distances from trees, affect daylight and solar radiation. Tree locations, number of trees, and allocation type can affect daylight filtering, change the green view ratio, and impact UTCI and solar radiation by shading effects. A novel design approach is proposed that considers complex parameters at the neighborhood scale and optimization of these objectives.
Figure 3
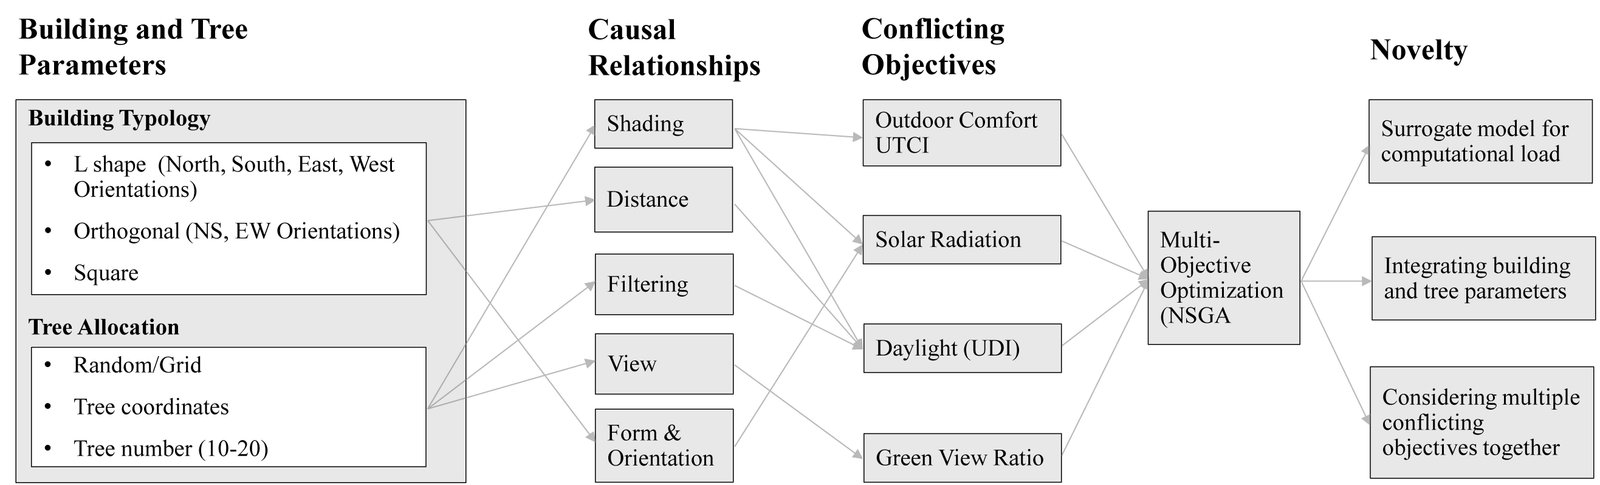
Fig. 3. Theoretical framework explaining causal relationships.
3.2. Random and grid tree allocation
Assessing tree integration and shading conditions is necessary for the neighborhood daylight performance, solar radiation, green view ratio, and UTCI. Figure 4 shows two types of tree placement: grid-based and random. In the first scenario, 10-20 trees are in a 3-meter perimeter of the parcel. These trees move parametrically back and forth in the defined domain, changing their distance from the buildings. In the second scenario, 10-20 trees are randomly placed in the defined domain without a grid. Instead of high-poly meshes, cylinders are used, and their geometry is smoothed to reduce simulation time. The tree type is selected using the "Kültürpark’s Guide to Trees, Shrubs, and Bushes" (in Turkish) published by İzmir Metropolitan Municipality, choosing average tree dimensions suitable for urban growth [36]. The heights are selected to closely match the building heights in the model, given İzmir's hot, summer Mediterranean climate. Trees are not seen as opaque objects [20], but rather as deciduous trees that shed their leaves in winter, with permeability set to 20% in hot summer days. These trees have a trunk height of 5-7 meters, a crown width of 4-5 meters, a crown height of 7-8 meters, and a total height of 12-15 meters. The tree is commonly used in İzmir and is well adapted to the climate. The number of trees, location, building types, and orientations are independent variables of the parametric model that define the design space for generating the machine learning model. Figure 2 shows the tree dimensions in detail.
Figure 4
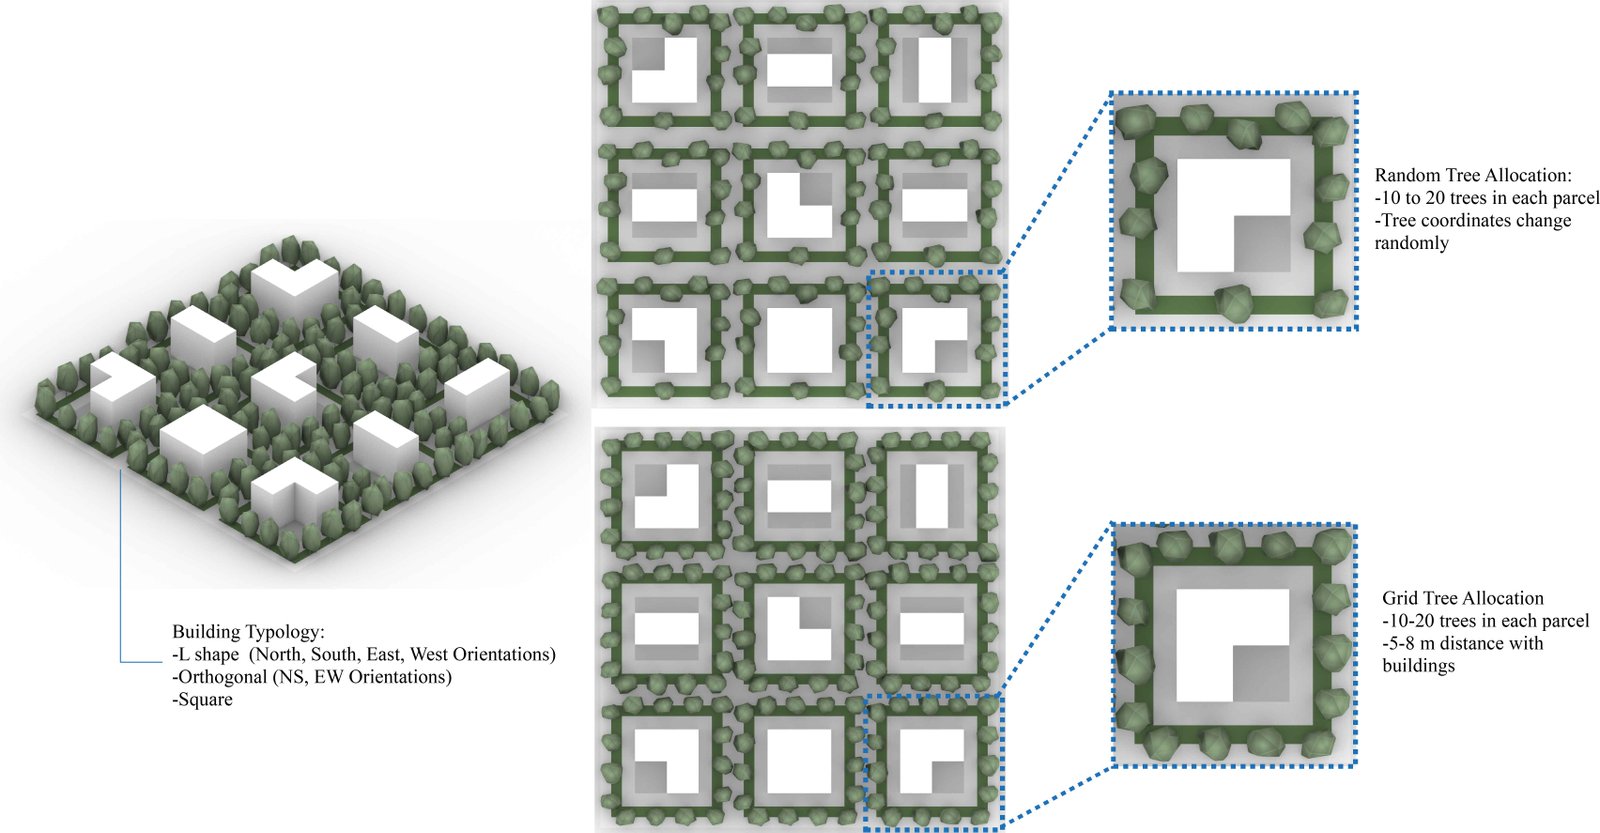
Fig. 4. Hypothetical neighborhood with various building typologies and tree allocations.
3.3. Performance simulations and data generation
The parametric model serves as the basis for performance simulations, including daylighting, solar radiation, UTCI, and green view ratio. The first one measures Useful Daylight Illuminance (UDI) to assess daylight performance inside the buildings using Honeybee tools. UDI values are calculated at the middle floor of each building using a reference plane height of 0.80. A 40% window-to-wall ratio and a 2-meter window height are assigned to the buildings. The hypothetical neighborhood is located in İzmir, so the weather data is collected from the İzmir EPW file. Figure 5 shows the geographical location of İzmir. İzmir's climate is classified as a hot-summer Mediterranean climate [37]. In this climate, summers are hot, with temperatures reaching their highest levels, especially in August. As detailed in Table 3, the Mean Temp. reaches 27.7 °C in August, while the Mean Max. Temp. reaches 33 °C, which is above İzmir's annual average.
Figure 5
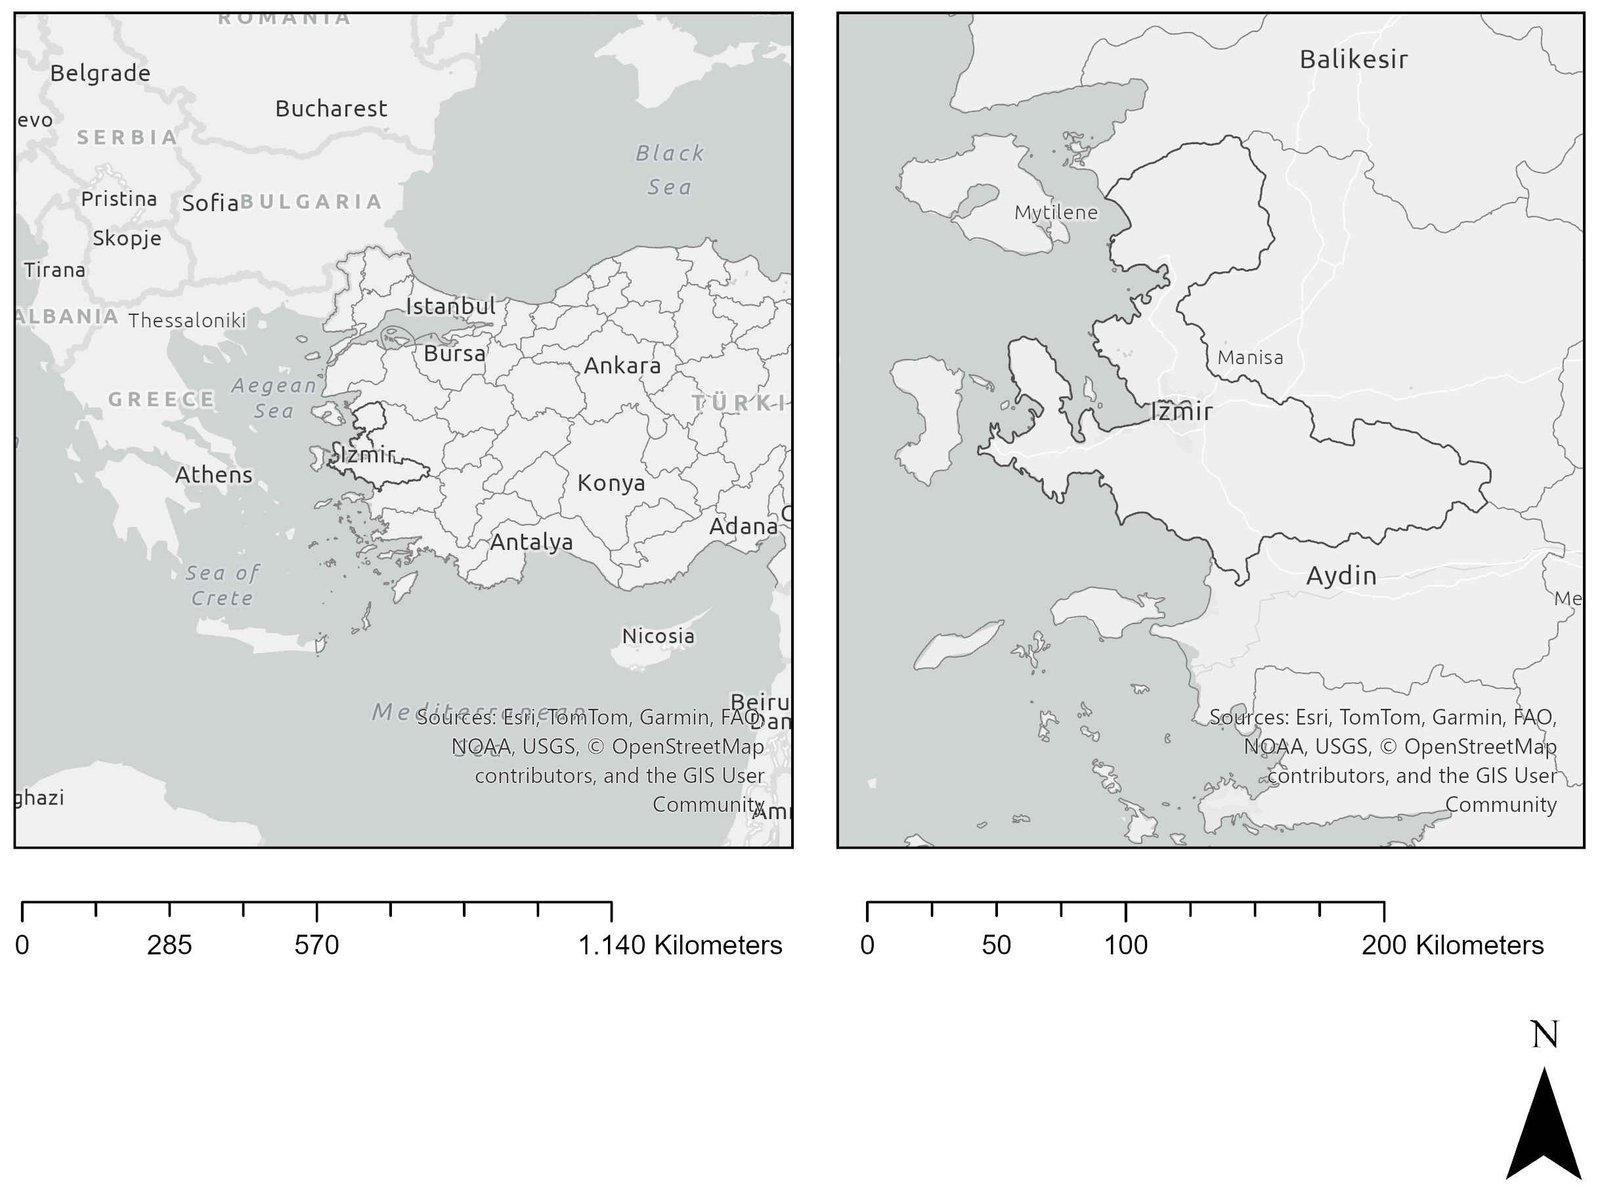
Fig. 5. Location map of İzmir, Türkiye.
Table 3
![İzmir climate data from General Directorate of Meteorology, Türkiye (in Turkish) [38].](figures/13-646-12.jpg)
Table 3. İzmir climate data from General Directorate of Meteorology, Türkiye (in Turkish) [38].
The second performance simulation was on solar radiation. Solar radiation incident on the facades is calculated to assess the feasibility of installing solar panels. The average incident radiation (kWh/m2) is calculated using Ladybug tools to assess the effects of building type, tree count, and tree placement around buildings. The time is set for the 15th of August between 10.00 and 15.00 to capture the hottest hours. The third simulation aims to see the effects of trees on the outdoor microclimate and thermal comfort. The 15th of August, between 10.00 and 15.00, is set to summer-time hot weather. Average UTCI values are calculated outdoors, including areas around buildings, under trees, and along roads. The green view analysis requires the use of Isovist in Grasshopper. The point of view is set at the center of the building, looking outward with a 160-degree field of view. Lines intersecting the trees provide a green view, while lines that intersect the buildings or the trees behind them are eliminated. The data collection process from the model, including simulations, starts to obtain data for the machine learning process. Twenty parameters for four variables, including building locations, rotations, and tree number and placement, are set. The Latin Hypercube System is used to generate these combinations. There were two models: grid-tree allocation and random-tree allocation. Therefore, the data collection process is repeated twice. 1000 iterations are taken in 48 hours per model. The collected data is internalized as CSV files.
3.4. Surrogate model training
Surrogate models are developed to reduce computation time for the next step. 1000 samples for each tree allocation type are imported to the DODO plug-in in Grasshopper to build an Artificial Neural Network (ANN) prediction model. These 1000 samples are divided into 70% for training and 30% for testing to evaluate the model accuracy and to prevent overfitting. There are 20 inputs: the parameters of building typology, building rotation, random or grid tree allocation, tree numbers, and the distances of the trees to the buildings. The ANN model predicted the UTCI and radiation results. Bipolar sigmoid is the activation function, sigmoid alpha value is set to 0.5, learning rate is 0.1, and the layer number is 2. Four models for random and grid tree allocations are built, each with neuron counts of 15, 20, 25, and 30 for 10000 iterations. The R2 values of each model are compared to find the most accurate combination (Table 4).
Table 4
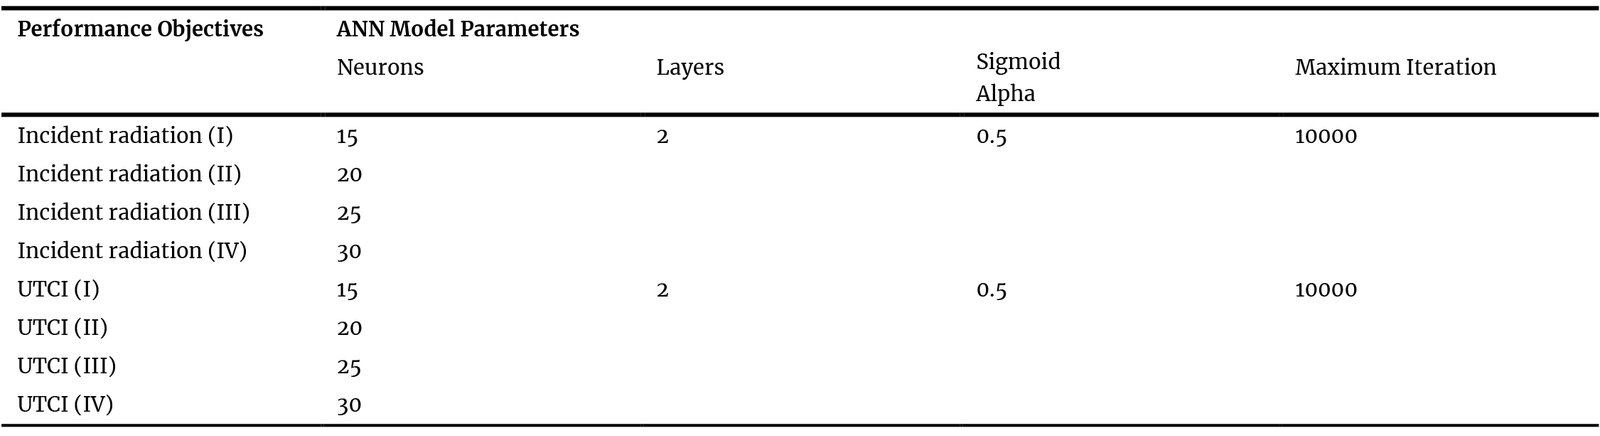
Table 4. ANN Model Parameters.
3.5. Decision support with multi-objective optimization
Performance objectives require comfortable outdoor spaces in summer while generating incident radiation on the facades to contribute to sustainability. Multi-objective optimization is required to generate design alternatives that address these conflicting objectives. Moreover, these alternatives should provide comfortable indoor environments through daylighting, with Useful Daylight Illuminance (UDI), and a green view. UDI and view conditions are set as constraints to achieve the design objectives, as shown in Table 5. The goal is to keep the UDI of each building over 75%, and the view should contain at least 80% tree view. The Optimus plug-in is used to arrange constraints. Multi-objective optimization of the 20 parameters, including building typology, orientation, tree counts, and positions, is performed using the Wallacei plug-in. This plug-in optimizes conflicting objectives using NSGA-II (Non-dominated Sorting Genetic Algorithm-II). This algorithm searches the design space to identify Pareto-front solutions by applying crossover and mutation to design parameters in each generation, thereby modeling the relationship between conflicting incident radiation and UTCI metrics. The optimization is set to run for 100 generations with a population size of 50 per generation. The crossover probability is set to 0.9, and the mutation rate is 0.05 (Table 6). Additionally, using the NFT component of Grasshopper, UDI, and green view percent metrics are defined as constraints in the design space solutions. Failure to meet these constraints is considered a violation, penalizing the design's fitness value.
Table 5

Table 5. Objectives and constraints of the model.
Table 6
Table 6. Wallacei optimization settings.
A large number of design alternatives exist in the design space. The non-dominated solutions form the Pareto-front solutions.
Pareto-front solutions represent a large amount of continuous solution space. This data has design alternatives that improve conflicting design objectives. Each design alternative presents a solution to the design problem. Therefore, choosing one among them may be challenging for the designer. The K-means clustering algorithm is used to divide these alternatives, which have trade-offs, into sub-regions. The clustering process is conducted in Wallacei. These clusters represent design alternatives that improve different objectives. Therefore, clustering makes it easier to select the design most suitable to the design context from among the representative alternatives. K-means clustering is beneficial because it objectively reduces the design space to a manageable size in the decision-making process.
4. Results
4.1. Machine learning and optimization results
A systematic comparison of ANN models was conducted to find the optimal surrogate model. Models with 15, 20, 25, and 30 neurons were evaluated. The model with the best predictive performance was selected for the optimization process. The model with 30 neurons yielded the highest R2 for random (0.9603, 0.9947) and grid (0.9914, 0.9978) tree models, as shown in Table 7. Mean Absolute Error (MAE) values of the model were presented in Table 7 as well. MAE values for the overall model were low, indicating that the ANN model demonstrated minimal error while predicting these values. As the number of neurons increased from 15 to 30, the models' MAE decreased. However, in the grid allocation model, the lowest MAE was found with 25 neurons. Since R2 values were highest with 30 neurons for both random and grid allocation, the 30-neuron model was selected.
Table 7

Table 7. Performance objective scores.
Multi-objective optimization was applied to compare random and grid tree layouts. 5000 design alternatives were generated as a result of the optimization. In the study, the K-means clustering grouped the design alternatives into five clusters based on similar fitness values, as shown in Figure 6. Results with similar performance, based on the UTCI and incident radiation, were mathematically grouped under the same cluster. Based on the optimization results, one scenario was selected from each cluster. Each of these scenarios was an alternative with different building types, tree numbers and locations, and different performance results. These scenarios were compared with respect to tree allocation and neighborhood design. The comparison revealed similar results between the grid and random approaches, with the grid performing slightly better. Among the representatives selected from the clusters, the lowest UTCI was observed in the grid tree allocation scenario, at 31.15 °C, while the highest score was obtained in the incident radiation grid scenario, at 1.33 kWh/m². Table 8 shows the lowest UTCI and the highest incident radiation value in random and grid scenarios.
Figure 6
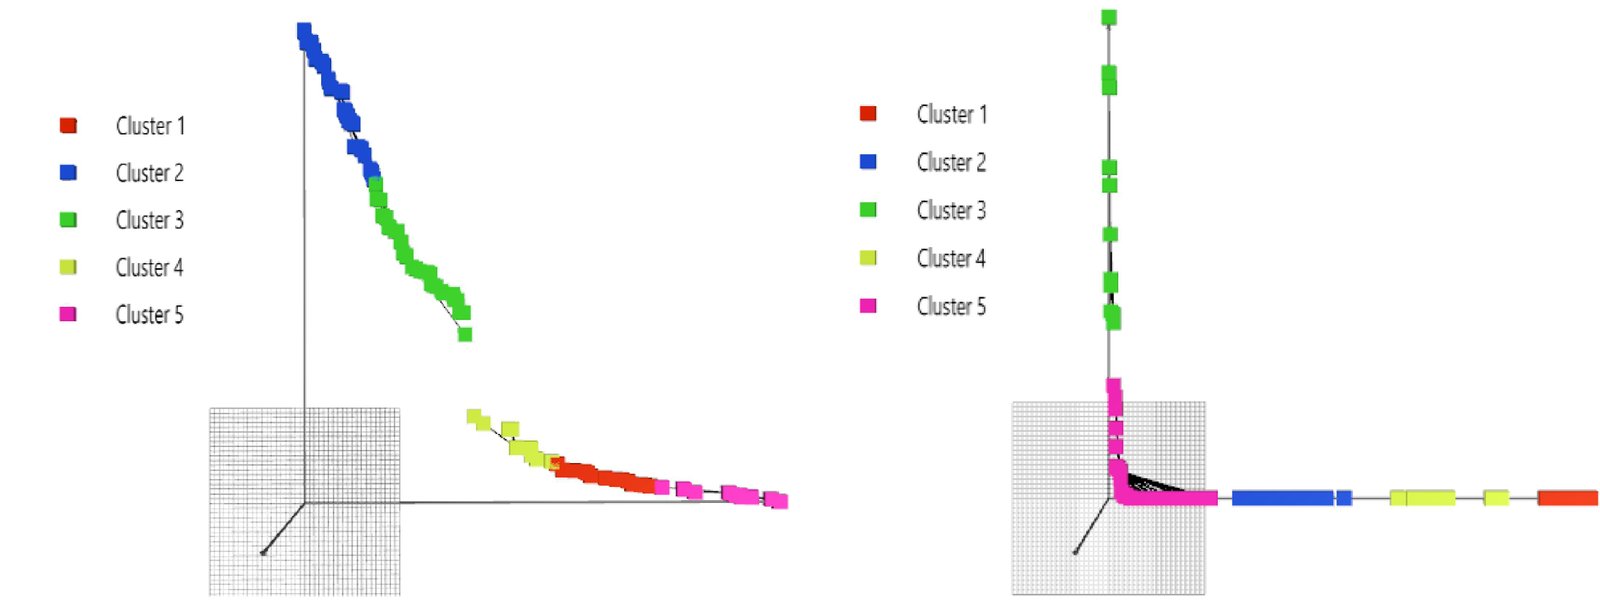
Fig. 6. K-means clustering into 5 groups on the Pareto-front of a) random-tree allocation b) grid-tree allocation.
Table 8
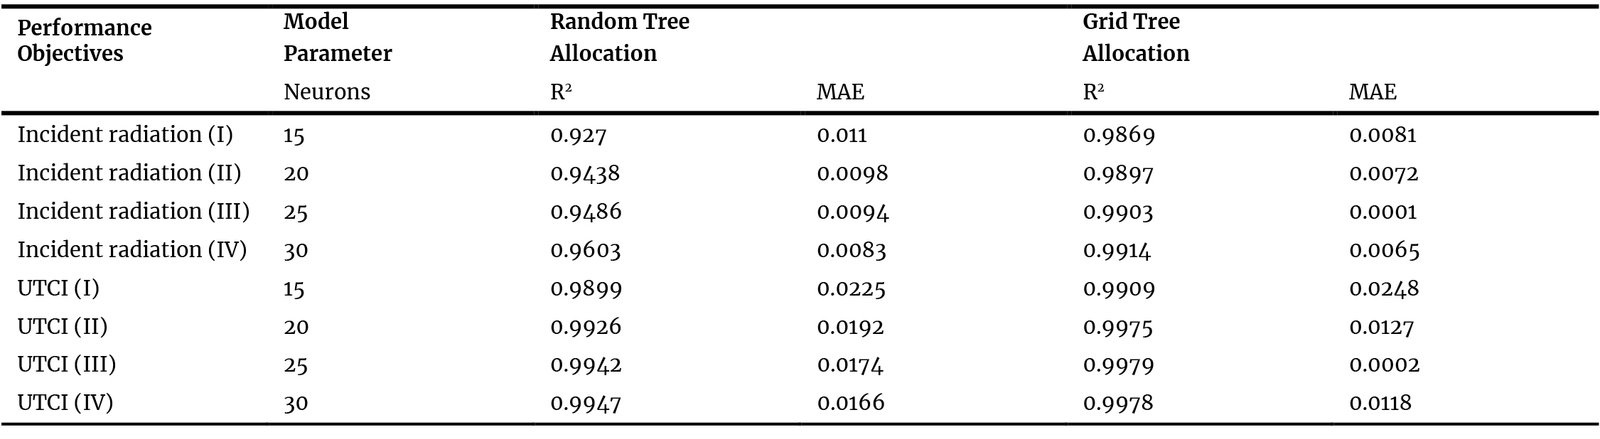
Table 8. Minimum UTCI values and maximum incident radiation result in random and grid allocation design alternatives.
4.2. Solar energy and UTCI
In the random allocation, the minimum UTCI value was 31.30 °C. Even though the scenario has a maximum number of trees per parcel, the irregular placement disrupted tree shading, leading to higher UTCI values. In both layouts, UTCI values were lower under trees and in streets but higher around buildings. Figure 7 shows that the uninterrupted grid system resulted in continuous shading for pedestrians in the outdoor environment, whereas the random system showed greater increases in UTCI values.
Figure 7
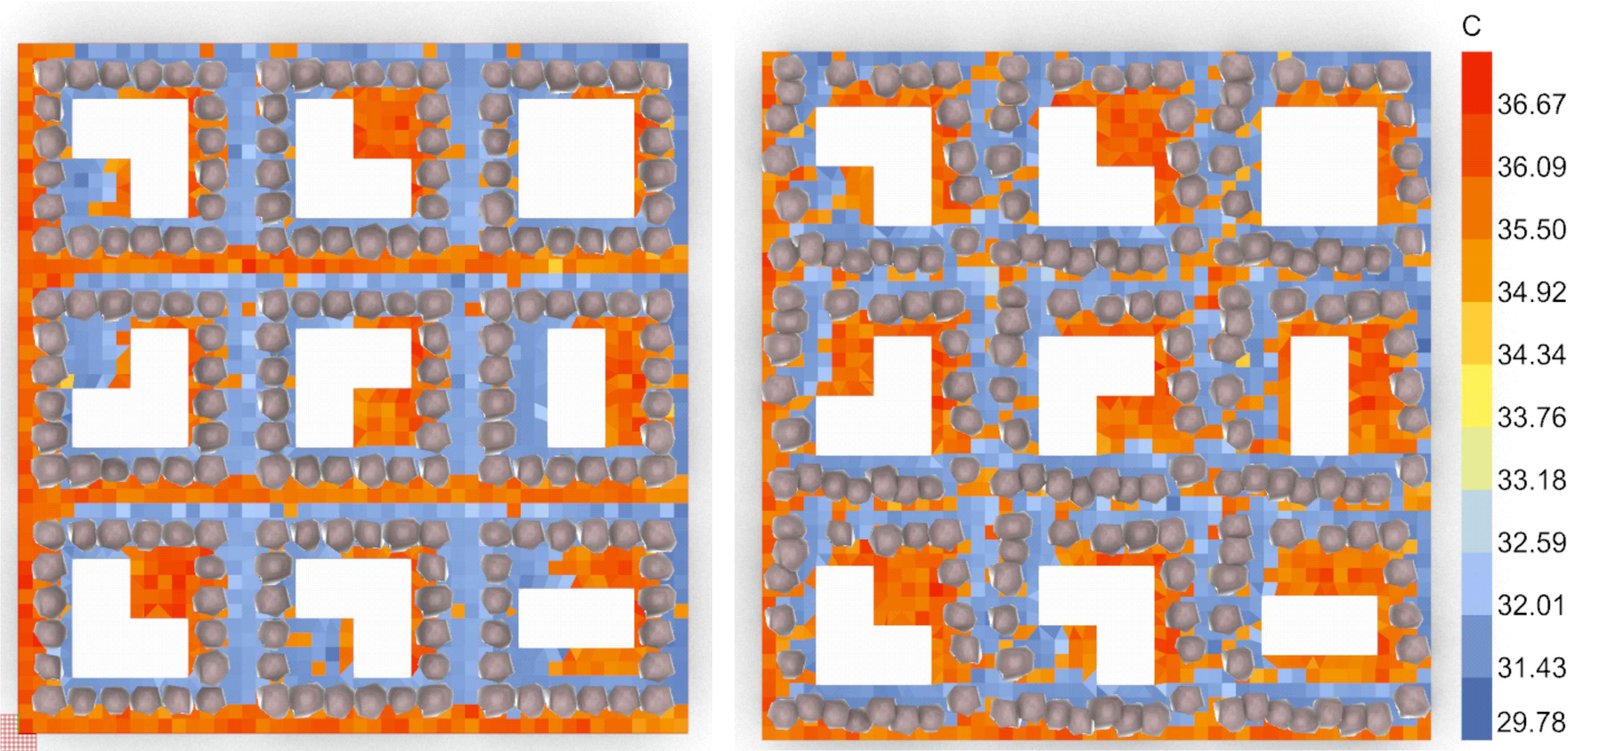
Fig. 7. Grid and random tree allocation (respectively) effects on UTCI.
The facades received an average incident radiation of 1.33 kWh/m2 in the grid system’s best radiation scenario. 12 trees were placed at the furthest positions within the tree location area to maximize this value. 8 out of 9 buildings were rectangular, rotated on the east-west axis, with the south façade maximized. The random design with minimum UTCI has reached an average incident radiation of 1.13 kWh/m2. The maximum incident radiation in the random tree allocation scenarios was 1.27 kWh/m², while the UTCI was 31.87 °C. When the maximum radiation potentials of both allocation scenarios were compared, the results showed that the lower incident radiation in the random allocation may be due to the inability to control the trees' shading effects.
In the grid model, the scenario with the lowest UTCI value was 31.15 °C, indicating a moderate heat stress level [12]. This scenario includes 20 trees, each positioned within 8 meters of the building perimeter of its parcel. Additionally, buildings were mostly L-shaped and square to increase the amount of shaded area.
4.3. Daylight performance and view
The algorithm aimed to increase the number of trees to achieve a higher green view ratio, whereas solar radiation requires fewer trees. The total green area visible to occupants is the green view [39]. This study used Isovist to measure the ratio of visible trees, as shown in Figure 8. The number of rays from the building's occupant that strike trees is considered the green view ratio. The ratio of rays striking the trees to total rays within a 160-degree radius gives the green view ratio. By allocating 18 trees per parcel, the green view reached its highest value as 97% in the grid design. By choosing rectangular buildings in different orientations, the algorithm created corridors that allowed more trees to be seen through the windows.
Figure 8
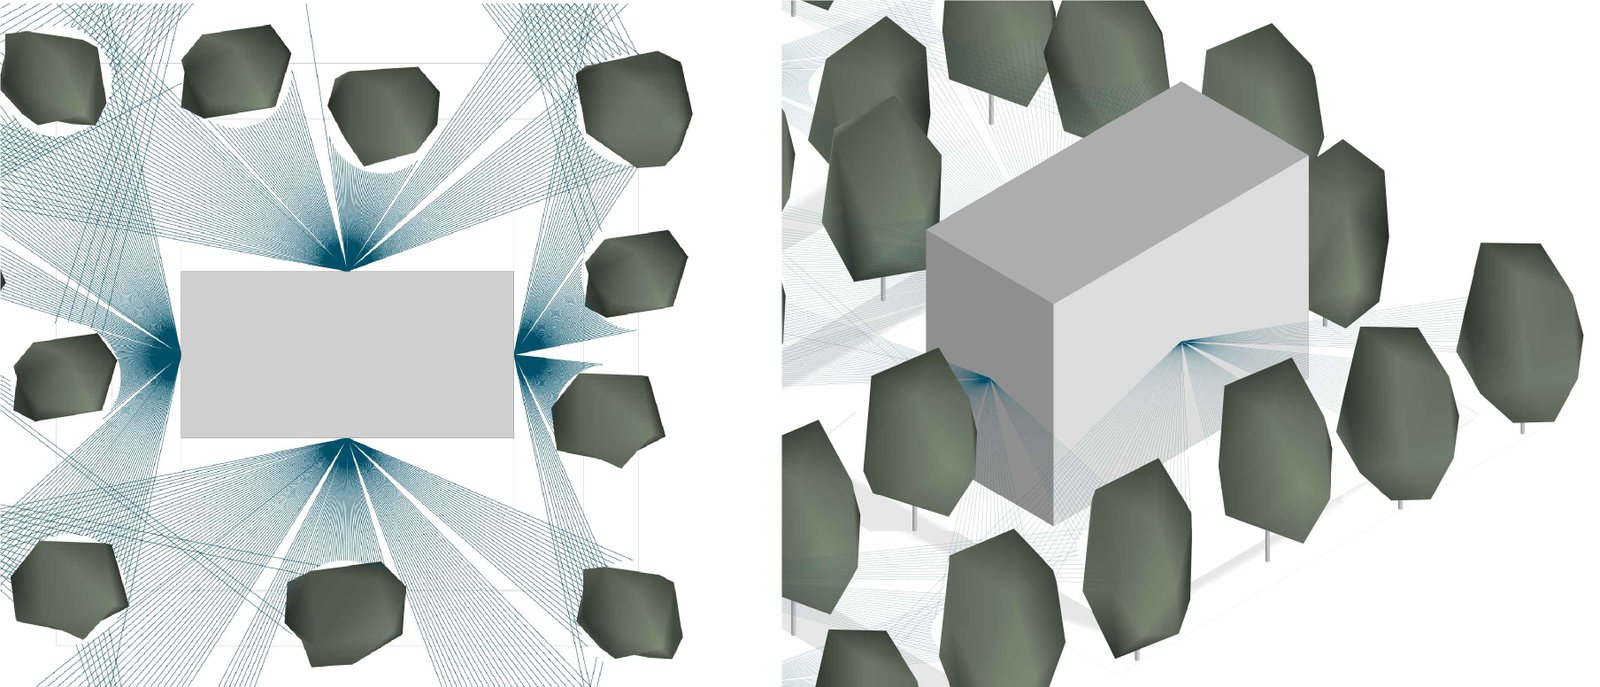
Fig. 8. Green view ratio plan and perspective view, generated by Isovist.
Grid and random tree allocation, as well as building typologies, affect indoor daylight performance. Optimal-scenario simulations showed a relationship between these parameters and Useful Daylight Illumination (UDI). The UDI values of optimal scenarios are mostly within a narrow range of 76.3% to 79.9%. Thus, indoors are mostly illuminated at more than 100 lux. Leaves filter the sunlight, keeping illuminance below 2000 lux and preventing glare. In the grid allocation, researchers controlled the number of trees and their distance from buildings, which helped distribute daylight more evenly.
In the grid allocation, as trees were further from the building, daylight penetrated deeper, increasing UDI to 79.9%. However, a scenario without trees would increase glare and lower the UDI. In random allocation, trees are distributed asymmetrically; some parts of the indoors receive more daylight, while others experience more shading. Rectangular building forms allow daylight to penetrate the center of the buildings more evenly. They are the forms that benefit most from daylight, with UDI values up to 79%. Square and L-shaped building forms receive less daylight to their centers due to their depths. When trees are denser in the grid layout, the UDI levels of square and L-shaped buildings decreased to 77%. Figure 9 shows three optimal allocation scenarios. In the grid scenario with the lowest UTCI (31.15 °C), the highest number of trees (20) occurs, which reduces UDI in the centers of square buildings (Figure 9(a)). In the grid allocation, where fewer trees were allocated, UDI values in the centers of square buildings improved (Figure 9(b)). The random allocation with the lowest UTCI (31.30 °C) is similar to Figure 9(a), with low UDI values due to higher tree density (Figure 9(c)). Overall, the grid tree allocation is more predictable in daylight performance than the random allocation. Nevertheless, both layouts are similar and provide adequate daylight indoors.
Figure 9
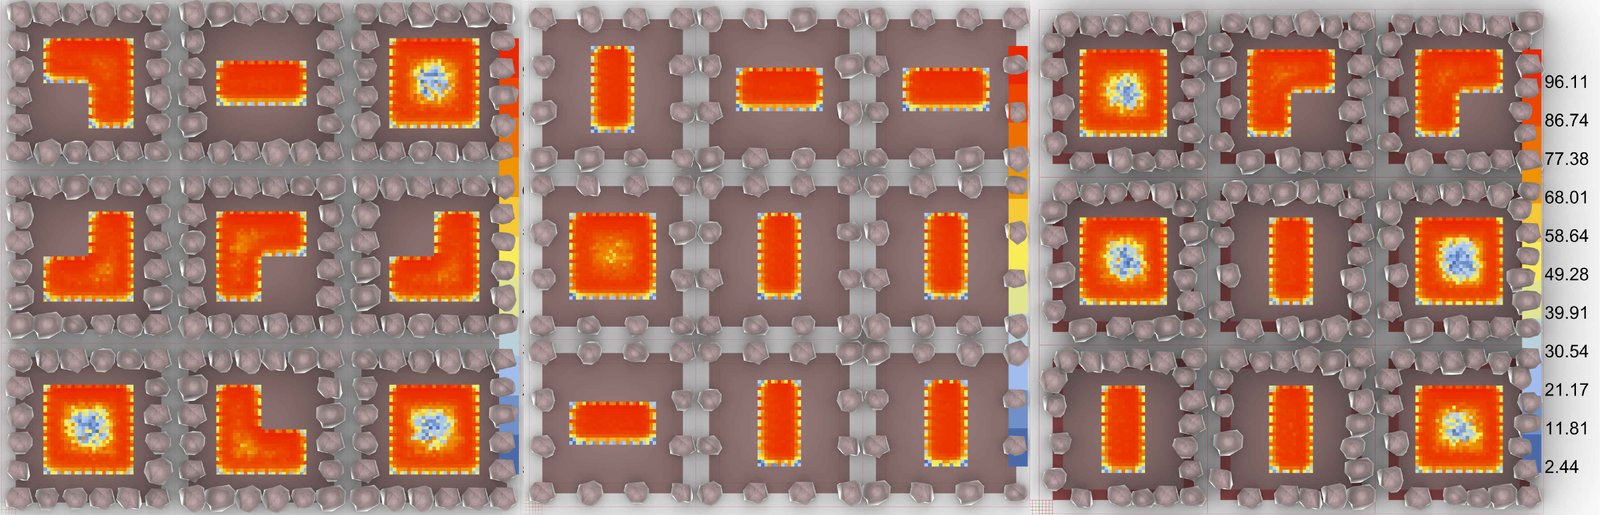
Fig. 9. UDI percentage of (a) Grid tree allocation with dense trees (20 trees). (b) Grid tree allocation with fewer trees (12 trees). (c) Random tree allocation (20 trees).
5. Discussion
This study optimizes the tree allocation problem by using machine learning to predict daylight, solar radiation, UTCI, and green views, accounting for building types and rotations to support sustainable neighborhoods. Researchers provided grid and random-tree allocation models and developed surrogate models by collecting 1,000 samples from each model. Thus, surrogate models provide high precision and rapid optimal design scenarios.
The results highlighted that trees are as effective as buildings in neighborhood design. The study combines outdoor thermal comfort and incident radiation objectives while considering indoor daylight levels and green view ratio. Grid tree allocation resulted in better sustainability performance than random allocation. Grid and random tree allocation scenarios yielded similar UTCI results, 31.15 and 31.30 °C, respectively. Even though the grid allocation scenario had a lower value, both results are in the moderate heat stress zone. Therefore, the difference cannot be perceived by pedestrians. However, uninterrupted shadows provided by grid allocation on streets during the summer may increase outdoor comfort. It has more controllable distance and count parameters, enabling more precise shading. Therefore, optimization algorithms are better at achieving optimal objectives in grid systems. Random modeling had a limited effect due to unpredictable, misaligned placement.
Trees reduce the building's shading potential because they are located farther from the building, and it was highlighted that a distance of 4-5 meters between buildings and trees prevents shading of buildings [31]. However, the solar energy potential of the building’s facades increases when trees are located further from the buildings. Therefore, the optimization algorithm suggested designs in which trees were farthest from the building in the grid system. Some studies argue that placing trees only on the north facade does not block sunlight and can enhance solar radiation [24]. On the contrary, a study considering outdoor thermal comfort suggests clustering trees in places with the most daylight exposure [12]. Therefore, the study’s objective affects the placement method of trees. This study argues that gaps between trees negatively impact thermal comfort in neighborhoods due to the lack of uninterrupted shading on streets; thus, tree allocation without interruptions on each façade is necessary. As the number of trees decreases, UTCI values increase, which leads to reduced thermal comfort.
There are studies on outdoor thermal comfort and solar radiation that consider multiple tree parameters, but neighborhood morphology should also be considered [24]. To reduce UTCI, L-shaped buildings with a dense grid-tree allocation were most successful, whereas rectangular buildings were more effective at reducing solar energy. Different tree allocations and building typologies yielded distinct results; thus, there is no single optimal neighborhood layout that meets all sustainability objectives. Each defined goal requires different design decisions. To guide designers through the complex design decision process, using surrogate models and optimization algorithms together enabled quick testing of conflicting objectives and parameters, as well as the identification of optimal results.
The results showed that grid tree allocation with a defined number and spacing provided a clear advantage. Homogeneous distribution stabilized the incident radiation and kept the UTCI under control. The research highlights that the presence of trees alone is not sufficient; the allocation strategy is more important for achieving neighborhood performance objectives. Tree allocation changed the daylight metric UDI within a certain range, but this value exceeded the 50% threshold according to the literature [40] in both scenarios. Trees are considered part of a view; the more trees in the grid allocation, the higher the view ratio from the windows, resulting in higher quality views. Random placement with fewer trees is the worst-case scenario for the green view ratio, reducing quality.
6. Conclusion
Combining various tree allocation options with building types reveals numerous design options. These designs should provide neighborhood performance objectives to ensure sustainability. Performance objectives, including indoor daylighting, incident radiation on facades, green view ratio, and outdoor thermal comfort, are affected by tree and building designs and conflict with one another. Simulations are computationally intensive; therefore, surrogate models and optimizations are needed to analyze the conflict between these objectives. As a result, the study revealed that grid-tree allocation improves outdoor comfort, while trees farther from buildings increase the potential for incident radiation on facades. Although there is a slight, unnoticeable difference in minimum UTCI values, the continuous shading created by the grid system may make pedestrians feel more comfortable. Rectangular buildings helped provide sufficient daylight in the center of buildings, and design options mostly resulted in satisfactory views. The tree-and-building design process developed in this study to optimize objectives can be applied to the design of sustainable neighborhoods. Meeting daylight and view limits in most design scenarios prioritizes UTCI and solar energy objectives in sustainable neighborhood designs. In particular, places such as İzmir, which are exposed to very high heat stress during summer, could only be reduced to the moderate heat stress zone through optimal design. These climate conditions require more detailed neighborhood designs to improve outdoor comfort and should be considered in future studies. Due to the high computational cost, the study includes fewer parameters related to tree types. Fewer parameters led to limited variation in performance. Future studies aim to conduct simulations with additional parameters, including building height, building density, and tree height, to test the study's applicability in existing neighborhoods and to contribute to sustainable neighborhood design. Simulations were conducted between 10:00 and 15:00 on August 15th to assess scenarios under peak summer conditions, and the grid layout proved more effective. However, annual weather conditions may affect the neighborhood design parameters such as tree allocation, building typologies, and orientation. Therefore, conducting annual simulations is necessary for future studies.
Funding
The corresponding author receives a monthly scholarship from the Scientific and Technological Research Council of Türkiye (TÜBİTAK) [2211-A National PhD Scholarship Program].
Author Contributions
Conceptualization, I.Ç.C., Z.T.K. and B.E.; Writing—Original Draft, Methodology, Writing—review and editing, Investigation, Formal analysis, and Resources, I.Ç.C., Z.T.K. and B.E.; Visualization, Validation, and Data curation, I.Ç.C.; Supervision, Z.T.K. and B.E. All authors have read and agreed to the published version of the manuscript.
Acknowledgement
The corresponding author would like to express her gratitude to the Scientific and Technological Research Council of Türkiye (TÜBİTAK), since she is a scholar under the 2211-A National PhD Scholarship Program.
Declaration of competing interest
The authors declare no conflicts of interest.
References
- M. Hegazy, K. Yasufuku, H. Abe, Evaluating and visualizing perceptual impressions of daylighting in Immersive Virtual Environments, Journal of Asian Architecture and Building Engineering, 20:6 (2020) 768-784.
- N. Nasrollahi, E. Shokri, Daylight Illuminance in Urban Environments for Visual Comfort and Energy Performance, Renewable and Sustainable Energy Reviews, 66:12 (2016) 861-874. https://doi.org/10.1016/j.rser.2016.08.052
- A. Wirz-Justice, D.J. Skene, M. Münch, The Relevance of Daylight for Humans, Biochemical Pharmacology, 191:9 (2021) 114304. https://doi.org/10.1016/j.bcp.2020.114304
- P. Boyce, Light, Lighting and Human Health, Lighting Research & Technology, 54:2 (2022) 101-144. https://doi.org/10.1177/14771535211010267
- S.D. Sureshkumar Jayakumari et al., Energy and Daylighting Performance of Kinetic Building-Integrated Photovoltaics (BIPV) Façade, Sustainability, 16:22 (2024) 9739. https://doi.org/10.3390/su16229739
- D.H.W. Li, E.I. Aghimien, K. Alshaibani, An Analysis of Real-Time Measured Solar Radiation and Daylight and Its Energy Implications for Semi-Transparent Building-Integrated Photovoltaic Façades, Buildings, 13:2 (2023) 386. https://doi.org/10.3390/buildings13020386
- S. Zhu, C. Ma, Z. Wu, Y. Huang, X. Liu, Exploring the Impact of Urban Morphology on Building Energy Consumption and Outdoor Comfort: A Comparative Study in Hot-Humid Climates, Buildings, 14:5 (2024) 1381. https://doi.org/10.3390/buildings14051381
- K. Liu, X. Xu, W. Huang, R. Zhang, L. Kong, X. Wang, A Multi-Objective Optimization Framework for Designing Urban Block Forms Considering Daylight, Energy Consumption, and Photovoltaic Energy Potential, Building and Environment, 242 (2023) 110585. https://doi.org/10.1016/j.buildenv.2023.110585
- W. Wang, Q. Lin, J. Chen, X. Li, Y. Sun, X. Xu, Urban Building Energy Prediction at Neighborhood Scale, Energy and Buildings, 251:7 (2021) 111307. https://doi.org/10.1016/j.enbuild.2021.111307
- C. Nardelli, R. Colombo, A. Banfi, M. Ferrando, X. Shi, F. Causone, A Comparative Analysis of Two Urban Building Energy Modelling Tools via the Case Study of an Italian Neighbourhood, Energies, 18:10 (2025) 2618. https://doi.org/10.3390/en18102618
- Y. Wang, X. Yan, X. Zhang, D. Zhang, A Multi-Objective Optimization Framework for Designing Residential Green Space Between Buildings Considering Outdoor Thermal Comfort, Indoor Daylight and Green View Index, Sustainable Cities and Society, 119:2 (2025) 106045. https://doi.org/10.1016/j.scs.2024.106045
- A. Shaamala, T. Yigitcanlar, A. Nili, D. Nyandega, Algorithmic Urban Greening for Thermal Resilience: AI-Optimised Tree Placement and Species Selection, Cities, 167:12 (2025) 106356. https://doi.org/10.1016/j.cities.2025.106356
- X. Yu, Y. Su, Daylight Availability Assessment and Its Potential Energy Saving Estimation - A Literature Review, Renewable and Sustainable Energy Reviews, 52:12 (2015) 494-503. https://doi.org/10.1016/j.rser.2015.07.142
- IES LM 83 : 2012 Approved Method: IES Spatial Daylight Autonomy (sDA). (Accessed: Feb. 12, 2026).
- J. Jayaram, L. Sundaram, Evaluating the Effects of Vegetation on Daylight Performance: A Simulation-Based Study of Government School Buildings in the Hot-Humid Climate of Chennai, India, Buildings, 15:17 (2025) 3231. https://doi.org/10.3390/buildings15173231
- R. Aghamolaei, M.M. Azizi, B. Aminzadeh, J. O Donnell, A Comprehensive Review of Outdoor Thermal Comfort in Urban Areas: Effective Parameters and Approaches, Energy & Environment, 34:8 (2022) 2204-2227. https://doi.org/10.1177/0958305X221116176
- C. Miao, S. Yu, Y. Hu, H. Zhang, X. He, W. Chen, Review of Methods Used to Estimate the Sky View Factor in Urban Street Canyons, Building and Environment, 168:1 (2020) 106497. https://doi.org/10.1016/j.buildenv.2019.106497
- L. Hong, X. Zhang, J. Du, A Benchmarking Analysis of Sunlight and Daylight Availability in a Highly Dense Urban Area in Southern China, Energy and Buildings, 323 (2024) 114847. https://doi.org/10.1016/j.enbuild.2024.114847
- M. Lu, J. Du, Assessing the Daylight and Sunlight Availability in High-Density Residential Areas: A Case in North-East China, Architectural Science Review, 56:2 (2013) 168-182. https://doi.org/10.1080/00038628.2012.729311
- P. Balakrishnan, J.A. Jakubiec, Trees in Daylight Simulation - Measuring and Modelling Realistic Light Transmittance through Trees, LEUKOS, 19:3 (2023) 241-268. https://doi.org/10.1080/15502724.2022.2112217
- P. Hanuliak, T. Hakszer, A Simulation-Based Case Study of Deciduous Tree Impacts on Office Building Daylighting, in: Proceedings of the Juniorstav, Brno, Czech Republic, 2025, pp. 1-10. https://doi.org/10.13164/juniorstav.2025.25021
- iTeh Inc, EN 17037:2018 - Daylight in Buildings, iTeh Standards, 2018. (Accessed: Feb. 12, 2026).
- H.G. Sezgin-Ugranlı, Photovoltaic System Performance Under Partial Shading Conditions: Insight into the Roles of Bypass Diode Numbers and Inverter Efficiency Curve, Sustainability, 17:10 (2025) 4626. https://doi.org/10.3390/su17104626
- U. Berardi, J. Graham, Investigation of the Impacts of Microclimate on PV Energy Efficiency and Outdoor Thermal Comfort, Sustainable Cities and Society, 62:11 (2020) 102402. https://doi.org/10.1016/j.scs.2020.102402
- L. Marchi, J. Gaspari, K. Fabbri, Outdoor Microclimate in Courtyard Buildings: Impact of Building Perimeter Configuration and Tree Density, Buildings, 13:11 (2023) 2687. https://doi.org/10.3390/buildings13112687
- K. Blazejczyk et al., Principles of the New Universal Thermal Climate Index (UTCI) and Its Application to Bioclimatic Research in European Scale, Miscellanea Geographica, 14:11 (2018) 91-102. https://doi.org/10.2478/mgrsd-2010-0009
- S. Elkhateeb, R. Anwar, Parametric Optimization of Urban Street Tree Placement: Computational Workflow for Dynamic Shade Provision in Hot Climates, Urban Science, 9:12 (2025) 504. https://doi.org/10.3390/urbansci9120504
- M. Rouhollahi, D. Whaley, J. Byrne, J. Boland, Potential Residential Tree Arrangement to Optimise Dwelling Energy Efficiency, Energy and Buildings, 261:4 (2022) 111962. https://doi.org/10.1016/j.enbuild.2022.111962
- A. Maged, A. Abdelalim, A.F.A. Mohamed, Generative Design Optimization of Tree Distribution for Enhanced Thermal Comfort in Communal Spaces with Special Reference to Hot Arid Climates, Sci Rep, 15:1 (2025) 16659. https://doi.org/10.1038/s41598-025-96763-4
- A.Y. Abdelmejeed, D. Gruehn, Optimization of Microclimate Conditions Considering Urban Morphology and Trees Using ENVI-Met: A Case Study of Cairo City, Land, 12:12 (2023) 2145. https://doi.org/10.3390/land12122145
- K. Zielonko-Jung, J. Janiak, Trees as a Solar Control Measure for Southern-Oriented Street Frontages: Analysis of a Selected Street Model for a Humid Continental Climate, Urban Ecosystems, 25:1 (2022) 111-119. https://doi.org/10.1007/s11252-021-01128-0
- J. Natanian, O. Aleksandrowicz, T. Auer, A Parametric Approach to Optimizing Urban Form, Energy Balance and Environmental Quality: The Case of Mediterranean Districts, Applied Energy, 254 (2019) 113637. https://doi.org/10.1016/j.apenergy.2019.113637
- G. Li, Q. He, B. Lin, M. Wang, X. Ju, S. Xu, Accelerated Inverse Urban Design: A Multi-Objective Optimization Method to Photovoltaic Power Generation Potential, Environmental Performance and Economic Performance in Urban Blocks, Sustainable Cities and Society, 120:2 (2025) 106135. https://doi.org/10.1016/j.scs.2025.106135
- E. Ahmadian, B. Sodagar, G. Mills, H. Byrd, C. Bingham, A. Zolotas, Sustainable Cities: The Relationships Between Urban Built Forms and Density Indicators, Cities, 95:12 (2019) 102382. https://doi.org/10.1016/j.cities.2019.06.013
- M. Pim-Wusu, K. Asante, C. Asante, N.K. Asidivu, T.A. Gyamfi, Assessment of Lift in Low to Mid-Rise Buildings Within the Greater Accra Region, Ghana, in: Proceedings of the International Conference on Engineering, Science, and Urban Sustainability (ICESUS 2025), Atlantis Press, 2025, pp. 108-118. https://doi.org/10.2991/978-94-6463-970-4_9
- T. Birişçi, H.S. Türel, M.Ö. Alkan, Kültürpark's Guide to Trees, Shrubs, and Bushes (in Turkish: Kültürpark'ın Ağaç, Ağaççık ve Çalıları), İzmir Büyükşehir Belediyesi Yayınları, İzmir, 2018. (Accessed: Aug. 08, 2026). https://www.izmir.bel.tr/YuklenenDosyalar/Yayinlar/0_08022018_061455_kulturpark_bitki_kitabi.pdf
- H.E. Beck, N.E. Zimmermann, T.R. McVicar, N. Vergopolan, A. Berg, E.F. Wood, Present and Future Köppen-Geiger Climate Classification Maps at 1-km Resolution, Sci Data, 5:1 (2018) 180214. https://doi.org/10.1038/sdata.2018.214
- General Directorate of Meteorology, Türkiye (in Turkish: Meteoroloji Genel Müdürlüğü). (Accessed: Aug. 05, 2026). https://www.mgm.gov.tr/veridegerlendirme/il-ve-ilceler-istatistik.aspx?k=&m=İZMİR
- Y. Hua, Y. Qian, T. Fei, Z. Chen, W. Zhou, A New Method for Efficient Green View Index Quantification Using Remote Sensing, Urban Forestry & Urban Greening, 113 (2025) 129013. https://doi.org/10.1016/j.ufug.2025.129013
- A. Nabil, J. Mardaljevic, Useful Daylight Illuminances: A Replacement for Daylight Factors, Energy and Buildings, 38:7 (2006) 905-913. https://doi.org/10.1016/j.enbuild.2006.03.013
Disclaimer/Publisher’s Note: The statements, opinions and data contained in all publications are solely those of the individual author(s) and contributor(s) and not of Solarlits and/or the editor(s). Solarlits and/or the editor(s) disclaim responsibility for any injury to people or property resulting from any ideas, methods, instructions or products referred to in the content.
 Get PDF (4.11 MB)
24
Total views
Citations
SHARE ON


