Volume 8 Issue 2 pp. 270-283 • doi: 10.15627/jd.2021.21
Development of a Machine-Learning Framework for Overall Daylight and Visual Comfort Assessment in Early Design Stages
Hanieh Nourkojouri, Nastaran Seyed Shafavi, Mohammad Tahsildoost, Zahra Sadat Zomorodian*
Author affiliations
Department of Architecture and Urban planning, Shahid beheshti University, Tehran, Iran
*Corresponding author.
ha.nourkojouri@mail.sbu.ac.ir (H. Nourkojouri)
S_seyedshafavi@sbu.ac.ir (N. S. Shafavi)
M_tahsildoost@sbu.ac.ir (M. Tahsildoost)
Z_zomorodian@sbu.ac.ir (Z. S. Zomorodian)
History: Received 16 August 2021 | Revised 29 September 2021 | Accepted 24 October 2021 | Published online 29 November 2021
Copyright: © 2021 The Author(s). Published by solarlits.com. This is an open access article under the CC BY license (http://creativecommons.org/licenses/by/4.0/).
Citation: Hanieh Nourkojouri, Nastaran Seyed Shafavi, Mohammad Tahsildoost, Zahra Sadat Zomorodian, Development of a Machine-Learning Framework for Overall Daylight and Visual Comfort Assessment in Early Design Stages, Journal of Daylighting 8 (2021) 270-283. https://dx.doi.org/10.15627/jd.2021.21
Figures and tables
Abstract
Application of machine learning methods as an alternative for building simulation software has been progressive in recent years. This research is mainly focused on the assessment of machine learning algorithms in prediction of daylight and visual comfort metrics in the early design stages and providing a framework for the required analyses. A dataset was primarily derived from 2880 simulations developed from Honeybee for Grasshopper. The simulations were conducted for a side-lit shoebox model. The alternatives emerged from different physical features, including room dimensions, interior surfaces’ reflectance factor, window dimensions, room orientations, number of windows, and shading states. Five metrics were applied for daylight evaluations, including useful daylight illuminance, spatial daylight autonomy, mean daylight autonomy, annual sunlit exposure, and spatial visual discomfort. Moreover, view quality was analyzed via a grasshopper-based algorithm, developed from the LEED v4 evaluation framework. The dataset was further analyzed with an artificial neural network algorithm. The proposed predictive model had an architecture with a single hidden layer consisting of 40 neurons. The predictive model learns through a trial and error method with the aid of loss functions of mean absolute error and mean square error. The model was further analyzed with a new set of data for the validation process. The accuracy of the predictions was estimated at 97% on average. The View range metric in the quality view assessment, mean daylight autonomy and useful daylight illuminance had the best prediction accuracy among others respectively. The developed model which is presented as a framework could be used in early design stage analyses without the requirement of time-consuming simulations.
Keywords
Artificial neural networks, Machine learning, Daylight assessment, Visual comfort
Nomenclature
| ASE | Annual Sunlit Exposure |
| AI | Artificial intelligence |
| ANN | Artificial Neural Networks |
| CBDM | Climate-Based Daylight Modelling |
| CGI | CIE Glare index |
| DA | Daylight Autonomy |
| DF | Daylight Factor |
| DGP | Daylight Glare Probability |
| sVD | Spatial Visual Discomfort |
| sDA | Spatial Daylight Autonomy |
| UDI | Useful Daylight Illuminance |
| ML | Machine Learning |
| MAE | Mean Absolute Error |
| WWR | Window to Wall Ratio |
| MLR | Multiple Linear Regression |
| SVM | Support Vector Machine |
| MLA | Machine Learning Algorithm |
| MSE | Mean Square Error |
1. Introduction
Due to the binding effect on occupant wellbeing and energy savings, daylight and visual comfort assessment have been within the comprehensive discussion of sustainable building design in recent years [1]. During previous years, lighting energy has consumed up to 20% of the total electricity consumption of the buildings [2], and office buildings were responsible for more than 20% of this energy [3]. Nowadays 7% of energy demand in buildings is for lighting; thanks to the progress in daylight standards and regulations [4]. Thus, improving the mentioned efficiency via controlled use of natural daylight inside buildings, known as daylighting [5], seriously affects the lighting and cooling energy demand, especially in harsh climates [6]. Daylight also provides an array of health and comfort benefits that make it essential for buildings’ occupants [7]. Besides, contact to the outside living environment is an important psychological aspect linked to daylighting. Windows could supply information of orientation, give experience of weather changes and allow us to follow the passage of time over the day [8]. Therefore, the size and position of window systems need to be considered carefully in relation to the eye level of the building occupants [9].
Successful daylighting requires design considerations at earlier stages of the building design process. This will reduce the costs of any possible design change and increase the ability to change the design [5-7]. Different metrics that should be considered in providing acceptable daylight and visual comfort include daylight sufficiency, glare, and quality views altogether. Historically daylight predictions have been conducted via simple methods, i.e., diagrams, protractors, scale models, mathematical formulas, and rules-of-thumb [10]. In recent years, because of the progress of computer processing, newly introduced methods, named white-box, extended the former approaches [11]. Constant efforts have been made to integrate all available techniques into the design process, and climate-based daylight metrics are now widely used as the most accurate indicators of the overall daylight situation of the spaces; however, the tools and applied professional methods that predict daylighting performance in buildings are not still completely practical [12]. Time-intensive CBDM can be a challenge when assessing the daylight performance for numerous design alternatives, especially in parametric design environments when designers aim to push for daylight optimization [13]. Besides, architects do not prefer to spend time to include what they assume complex methods into their practices [14].
Artificial intelligence (AI) and ML applications are achieving significant successes in many fields nowadays. Predictive models that are built on MLAs, called black-box, have been receiving recognition from the building design community and stakeholders because they are able to handle complex problems in a short time with high accuracy. These methods are based on algorithms that learn the mathematical relationship between a dataset’s parameters and construct a mathematically-fit model. Much useful information about the data could then be extracted without the need for time-consuming simulations or calculations. The application of ML methods in daylighting prediction is still underexploited [10], however an increasing number of studies with different objectives such as location, building type, output parameters, and selected algorithm, have been published over the past years. Studies use ML for daylight and visual comfort metrics prediction and focus on comparison between different ML algorithms regarding their accuracy and computational cost. Muhammad Ayoub [15], in a study on the application of MLAs in daylight metrics prediction, quantified the daylighting and energy consumption of residential buildings with different physical configurations and facades. The calculated metrics in daylight are sDA and ASE. The results indicate insignificant errors and are in agreement with the simulation results. In another research, Radzisewski and Kaczynski [16] evaluate ANN model in early design stages on various office models, via DF, DA, and Daylight Glare Probability (DGP), presenting a design tool with acceptable results in daylight metrics calculations. However, its performance is considered limited because of the narrow set of variants for the training of the MLA, similar to the conclusion of other researches. Moreover, a study by Lorenz et al. in 2020 indicates that an ANN could predict DA levels in three different stages including single design space, detailed design in windows configurations, and effects of shading devices. All three stages of the research showed acceptable accuracy.
In similar research, Chatzikonstantinou and Sariyildiz in 2015, evaluated three algorithms, including ANN, K-nearest, and random forest, focusing on DA and DGP. The results accordingly indicate that the approaches, which are based on ML, achieve a favorable trade-off between accuracy and computational cost. The authors suggest that they provide a worthwhile alternative for performance evaluations during architectural conceptual design.
ML-based methods are applied for predicting not only dynamic metrics calculations but also static illuminance-related metrics. Liu et al. [17] and Becalli et al. [18] have assessed the performance of MLAs in predicting actual illuminance values. The firstly mentioned research has offered a review that is focused on the accuracy analyzes of different models. The analyses were conducted for different types of buildings and in different temporal granularities. Two MLAs were compared in terms of their complexity and accuracy, both confirmed the accuracy of the predictions as in the acceptable range.
The studies with the same idea of comparing and assessing the algorithms’ performance have grown in number recently; the latest of them are presented in Table 1. Mohammad Ayoub, in 2020, has reviewed previous researches in this field in the following categories: procedure of prediction, MLAs, data sources, sizes and temporal granularities, and evaluation metrics. According to the review, the most common used algorithms are ANN, MLR, and SVM, considering regression as the most mentioned problem to solve. Besides, the most used output parameters are illuminance values, DA, sDA, and DGP, respectively.
Table 1
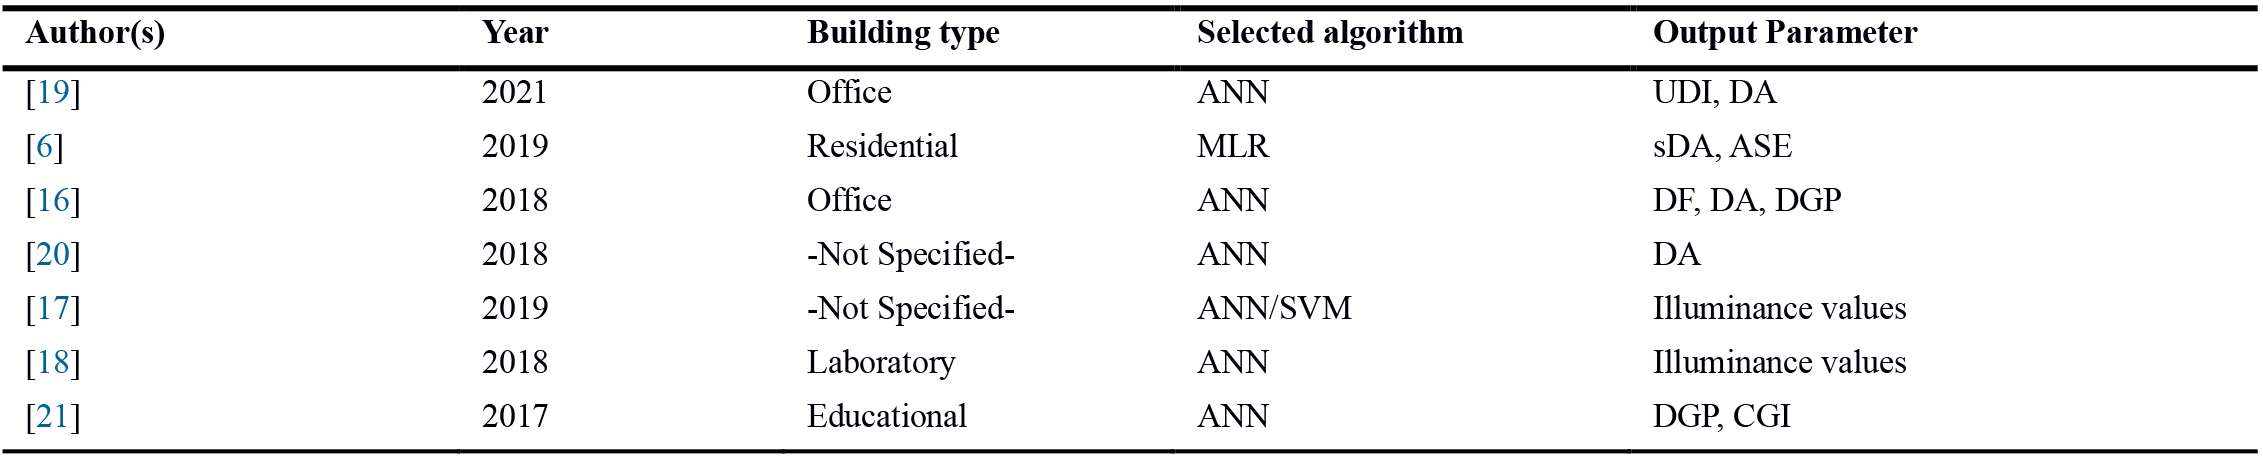
Table 1. Some of the Latest Studies on MLAs application in daylight and visual comfort parameters prediction.
Despite the vital importance of providing proper views to the outside, the focus of previous researches was mainly on windows’ daylighting effects, and outside views are rarely considered in window size, shape, pattern and placement design. Thus, analyzing the view quality in spaces along with daylight and glare assessments could be useful in early design stages. Besides, the previous researches and studies of this field have mostly considered a few number of performance metrics and do not thoroughly cover the assessment of ML-based methods in varied metrics of daylight and visual comfort.
Involving performance assessments from the beginning will reduce the costs of changes. Despite providing a precise prediction of building performance, simulation-based methods hinder rapid initial approximations during the early design stages, where many vital decisions are made. Moreover, simulation programs need a complex set of inputs, many of which are unknown even for designers at the outset. In other words, the simulations cannot be processed until the design is progressed to an acceptable level, where the requisite inputs are identified. This will make difficult to go back and improve the preliminary design. Thus, using a less time consuming method rather than simulation will be advantageous in preliminary stages of design. Moreover, architects are asked to quantify their design intentions and evaluate their alternatives in terms of sustainable performance criteria while they are trained to place value in the concept of spatial experience and do not have the proficiency to work with complex simulation tools. This highlights the need for a simplified tool that can be used rather than simulation-based softwares and help architects and other decision makers to realize the consequences of their choices in an easily-understandable way. With the help of such tools designers will be aware of the consequences of their decisions in acceptable timeframes, realize which design variables are more effective and ultimately make more efficient choices. According to the mentioned needs, this research is focused on the assessment of MLA in prediction of daylight and visual comfort metrics in the early design stages and providing a practical framework based on the findings.
The framework can be representative of space types with similar lighting and visual comfort needs. The main purpose of this paper is to evaluate the algorithm in the estimation of the mentioned metrics with a suitable number and variance and compare the algorithm’s accuracy in the prediction of different visual-comfort-related metrics.
Consideration of essential metrics for a comprehensive luminous analysis (daylight sufficiency, visual comfort and view quality) of indoor spaces is the main novelty of this research. This was a shortcoming in previous studies that were focused on calculation of one or two aspects of the luminous environment by a few number of metrics.
For this purpose, a dataset is primarily developed based on simulation-derived results. The dataset is then analyzed with the MLA and predictive models are presented for each metric. Furthermore, models have been validated by comparing to simulation results and the accuracy of the predictions are studied. Finally, a framework has been introduced based on selected features for daylight, visual comfort and view quality assessments in early design stages.
2. Methodology
Machine learning is a specific subset of AI that trains a machine to make predictions. There are three main learning types in algorithms; namely, Supervised, Unsupervised, and Reinforcement [10]. The supervised learning approach, which was utilized in this study to make daylight performance assessments, consists of two main steps. First, a dataset was generated using simulation-based softwares. Second, an MLA was used to analyze the created dataset and form the predictive model. A new set of variables that did not exist in the primary dataset was utilized to evaluate the model’s performance in processing the new input data. This step included a repeated trial and error process that led to optimization of the MLA performance. After all, a sensitivity analysis was conducted by a recently introduced method named Shapley Additive Explanations [22] to determine which features have the greatest impact on each of the calculated metrics (Fig. 1).
Figure 1
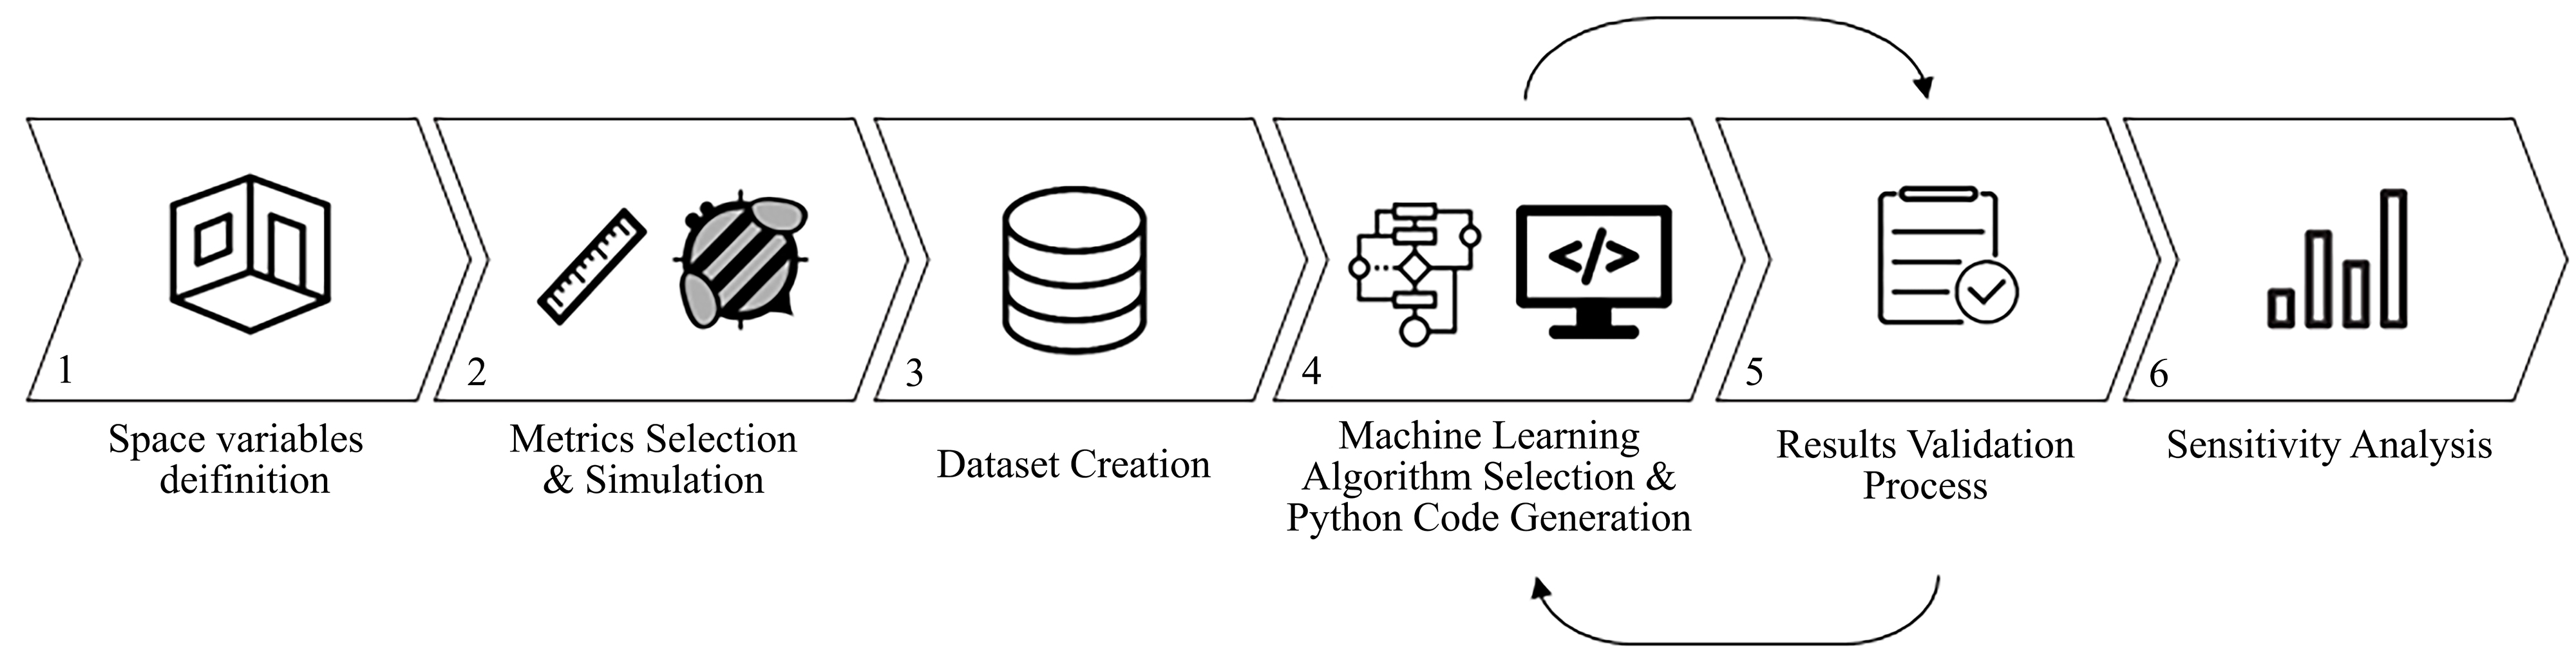
Fig. 1. General schematic diagram of research methodology steps.
2.1. Dataset creation
For this study, two separate datasets with sizes of 2880 and 64 are generated parametrically in Grasshopper, respectively as training and validation data. Honeybee plugin, which uses Radiance and Daysim for daylight analysis, was chosen for metric simulations. The case study is a side-lit single office zone located in Tehran climate (Bsk, based on Köppen–Geiger classification).
The variables selected for the present work include space dimensions, interior surfaces reflectance, shading states, window height and sill height, orientation, and also the format of window divisions. These variables were chosen to cover the main parameters that lighting designers and architects might take into account during the building envelope design process. Figure 2 shows the geometrical representation of the produced models. Also, some variables were kept constant, namely geographical location, climate conditions, occupation, and height of the space. The parameters and their values are shown in Table 2.
Figure 2
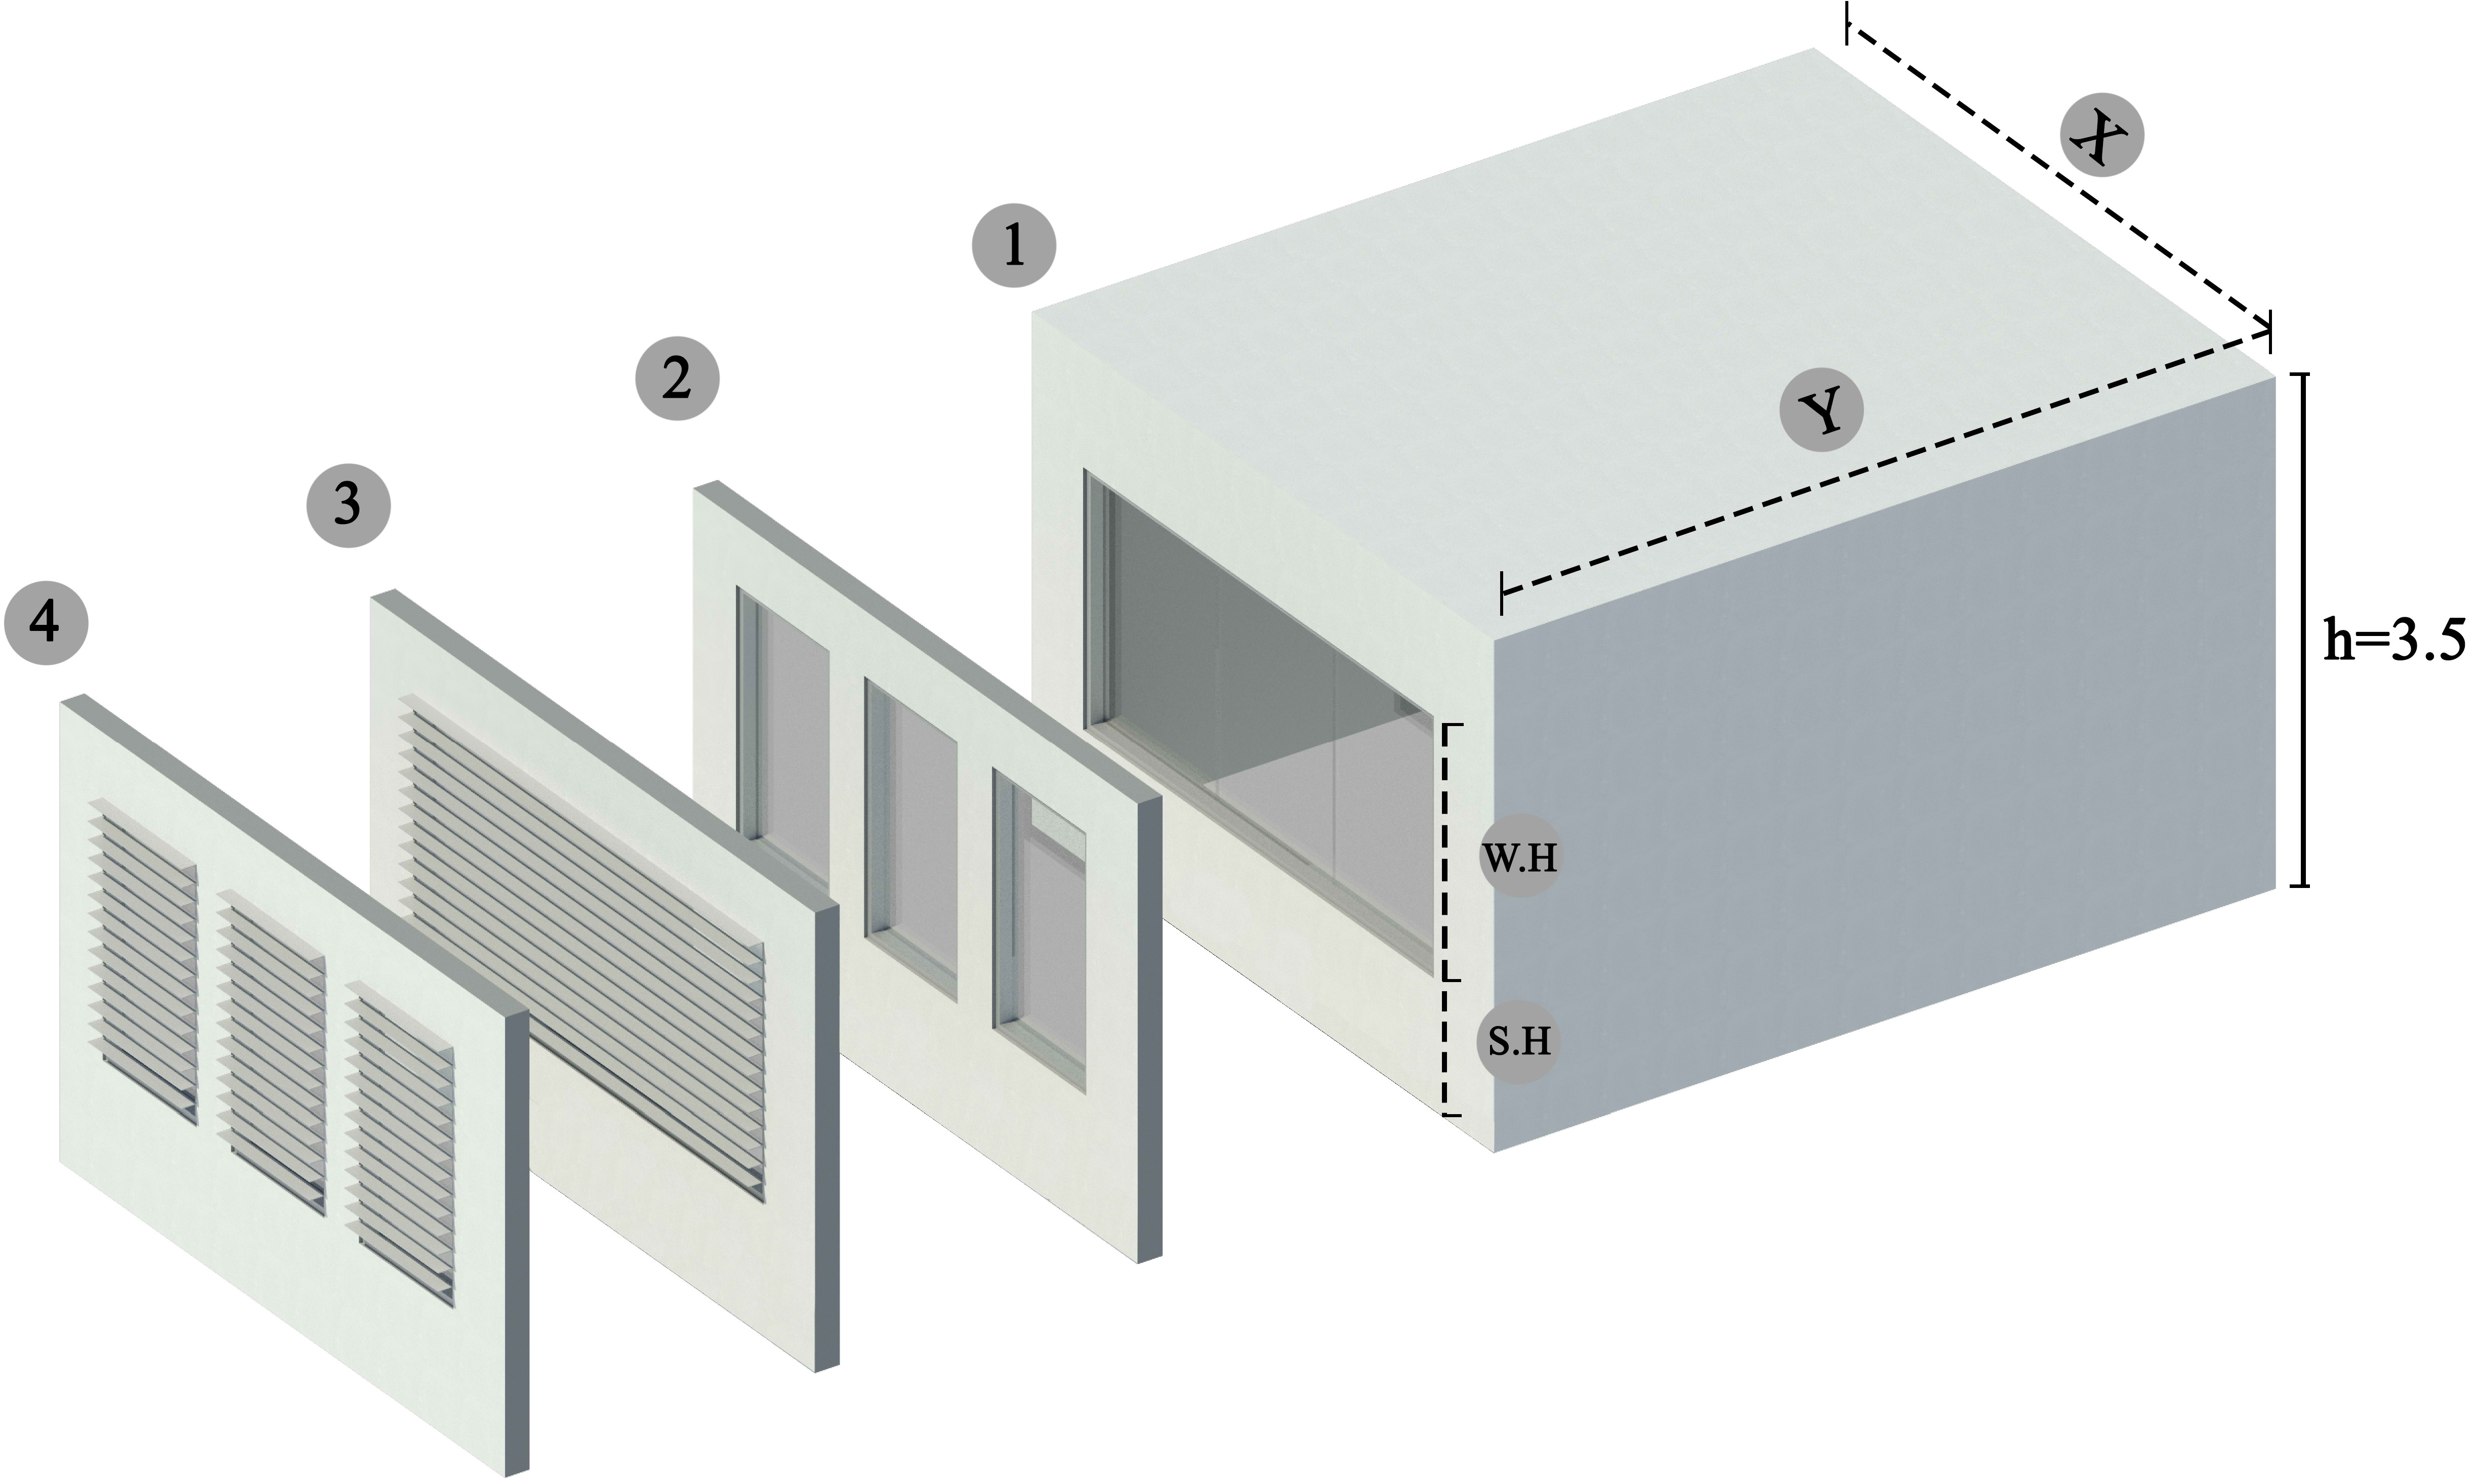
Fig. 2. The shoebox space form. Dimensional Alternatives include room width and length, window height (W.H) and window sill height (S.H).
Table 2
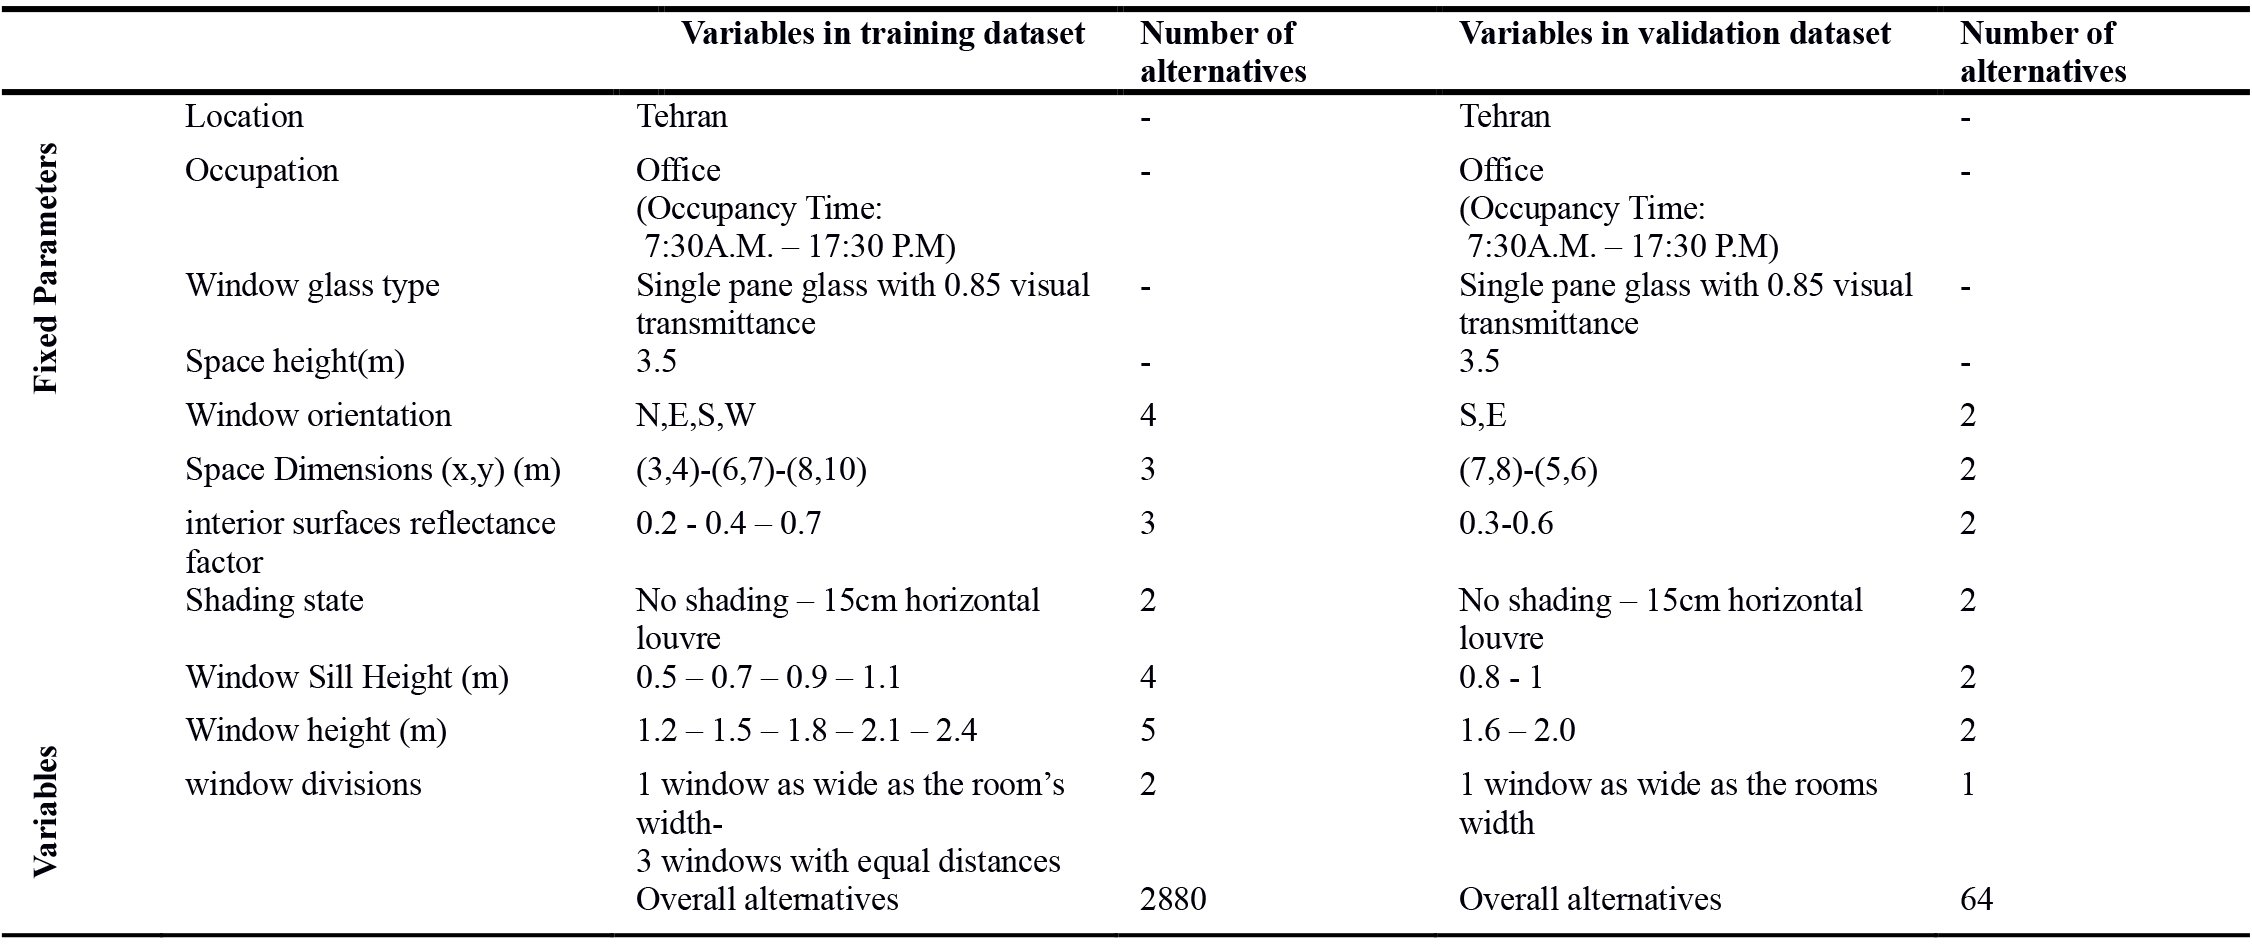
Table 2. Selected parameters and their values in both datasets for model training and validation process.
2.2. Target metrics
All the metrics selected in this study provide a single value representing the overall performance of the whole space. The chosen metrics for daylight assessments include Mean Daylight Autonomy, Spatial Daylight Autonomy, and Useful Daylight Illuminance. Although sDA is currently employed in IES LM-83-12 and LEED v4 recommendations for analysis of daylight sufficiency, it does not provide an upper limit for acceptable illuminance value. Thus, in this study, UDI has been added to inform on both useful levels of daylight illuminance, and the frequency of occurrence of excessive levels of daylight that might result in glare problems. The threshold considered for minimum acceptable illuminance of the space is 300lux, following the LEED v4. Certification and 19th topic of National Building Regulations of Iran [23,24].
The assessment of view quality was conducted based on LEED v.4. [23]. As mentioned in Table 3, this building certification system states four main factors for the evaluation of views in the buildings: view factor, view depth, view range, and the view content. The details of the calculation methods are discussed in [28]. According to LEED v4, if two of the abovementioned terms are provided for at least 75% of the space area, the room achieves the view credit. In this project, the view content is not defined as a variable in the MLA-based predictive model formation and the three other factors are simulated and discussed for view assessment. The view content is later measured individually in the back-end python code which is written for the proposed framework interface.
Table 3
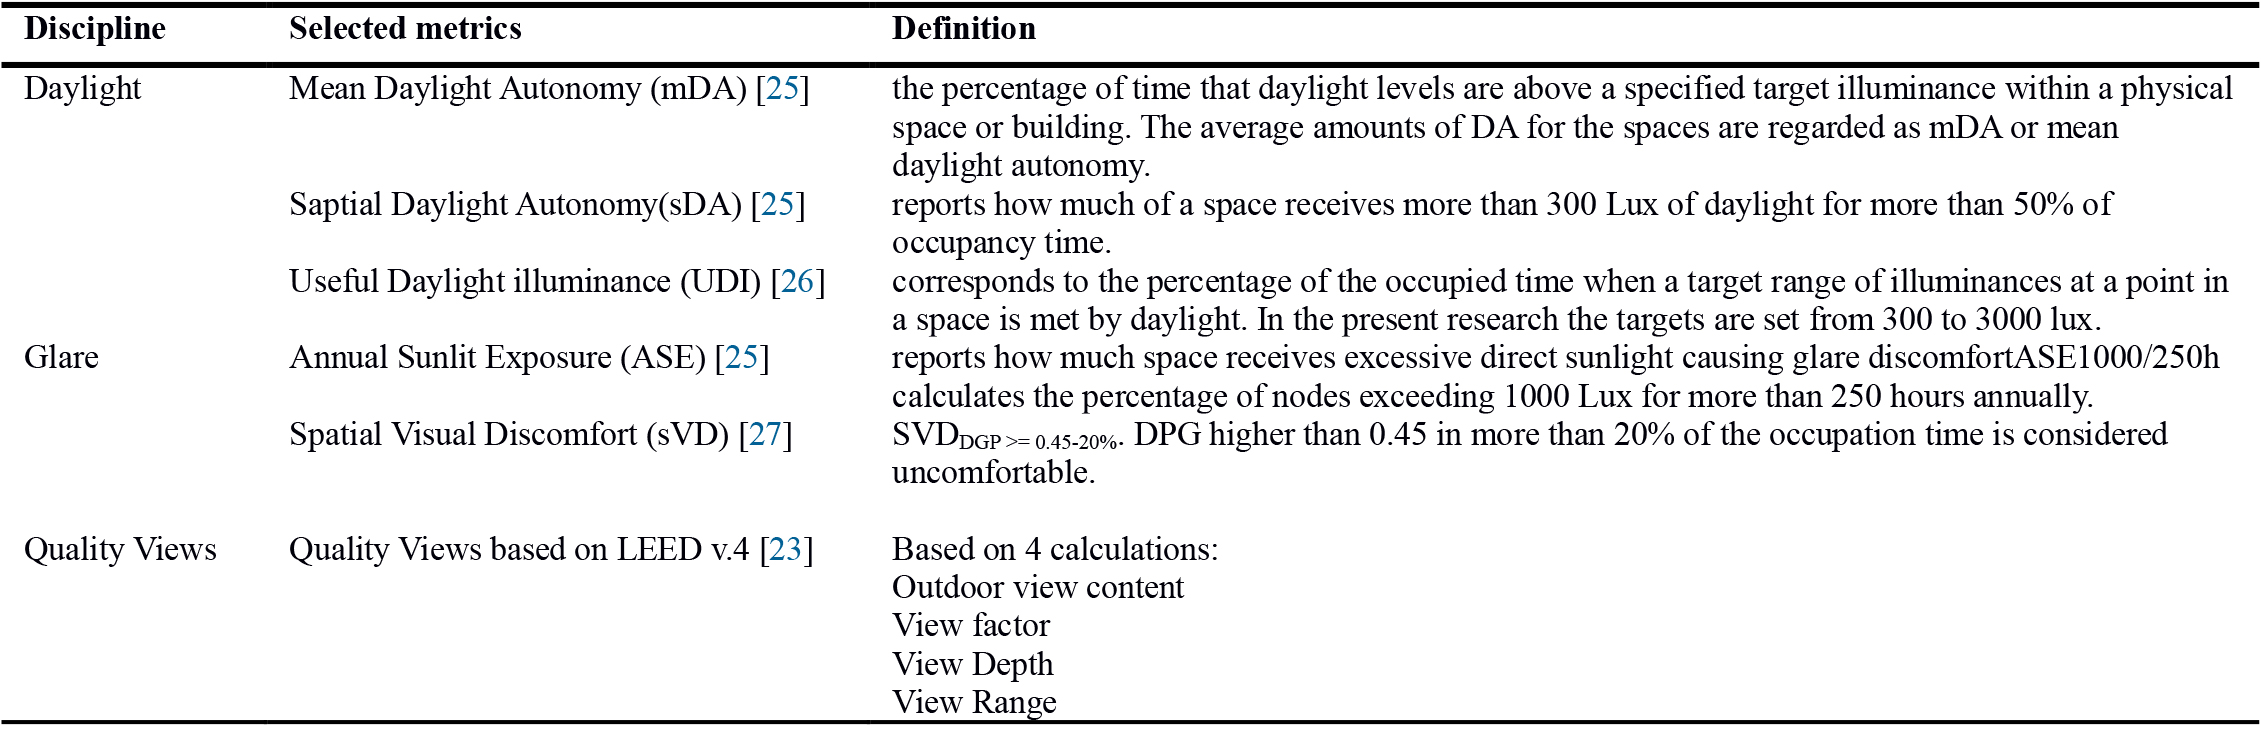
Table 3. The selected metrics to be analysed in the spaces of this research.
The shoebox spaces were modeled in Grasshopper for Rhinoceros. Radiance simulation engine via Honeybee v0.0.66 [29] was used to calculate daylight and glare metrics. The quality view factors were geometrically calculated in Grasshopper (Fig. 3). Table 4 lists the Radiance parameters that were set for daylight simulations. Parametric simulations were performed using Colibri, a plugin for Grasshopper [30].
Figure 3
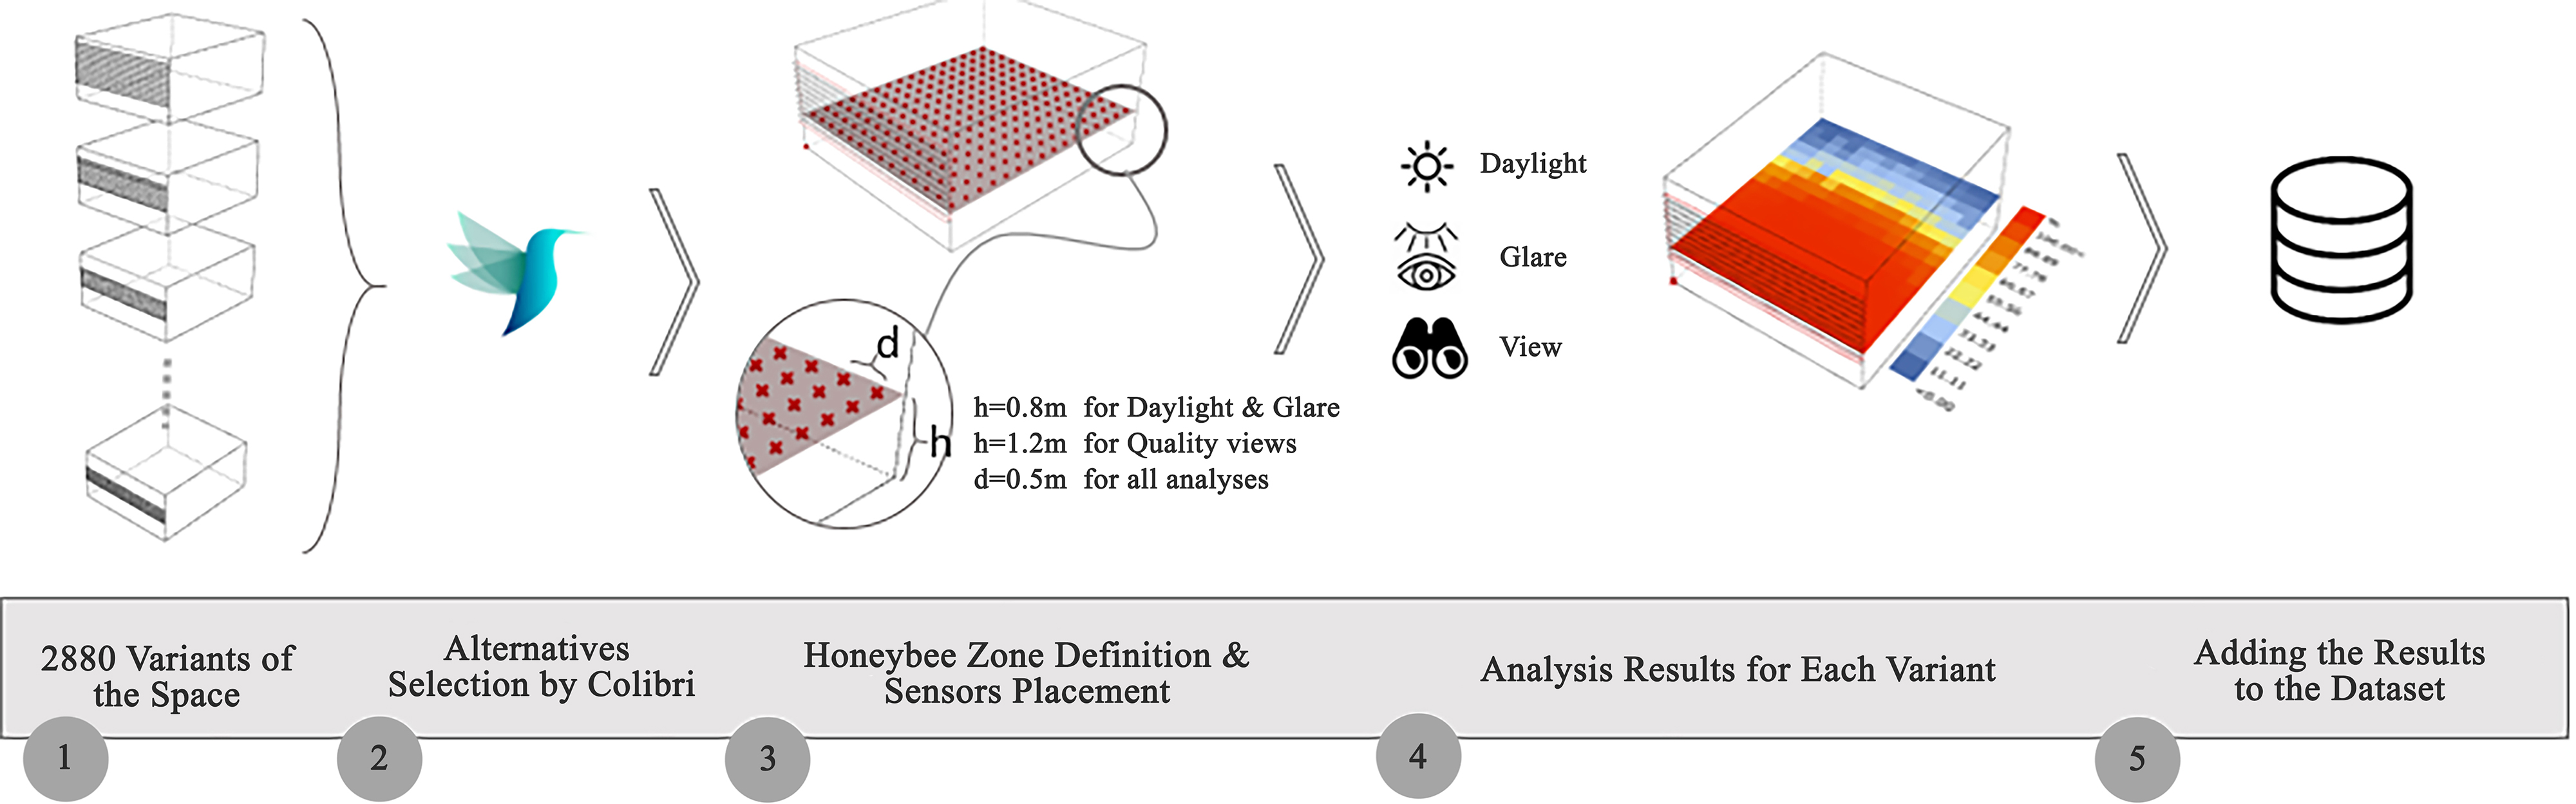
Fig. 3. Grasshopper code for daylight, glare and quality views calculations schematic overview.
Table 4
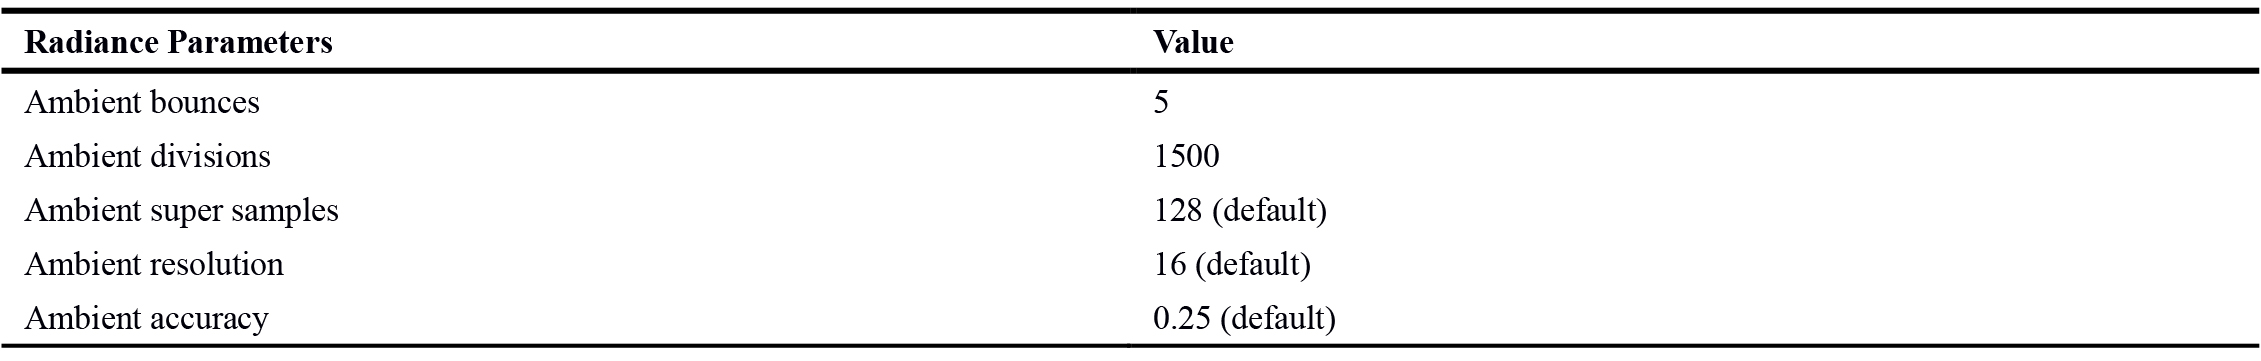
Table 4. Daysim parameters adjustment.
2.3. ML algorithm development
As mentioned before, several algorithms have been used to predict daylight metrics in recent studies. The most common algorithm is ANN with acceptable prediction accuracy [10], which is employed to produce the predictive model in the current research.
ANN algorithm conducts basically non-linear function approximations and performs numerical predictions via supervised, unsupervised, and reinforcement learning techniques [31]. The main concept behind ANN is the biological structure of neural networks that make up the brain and nervous system. This algorithm is composed of several layers, each contains several processing units, called neurons. The input layer receives the input data; the hidden layers perform the computations, and the output layer predicts the results [32]. Inputs are multiplied by corresponding weights, and the sum is then biased to minimize errors that stem from the difference between the actual and predicted outputs [10]. The value passes through an activation function, acting as a gate that allows the transmittance of the value to the next layer [33]. There are key parameters that tune ANN; including the number of hidden layers and hidden neurons, learning rate, number of epochs, batch size, and activation functions. These parameters are selected and tuned through a trial and error process and differs from one dataset to another.
The hyper-parameters of the ANN, optimized for this research, are presented in Table 5. The algorithm architecture has a single hidden layer with 40 neurons (Fig. 4). This architecture had the best performance among all alternatives. At each step, the hyper-parameters of the algorithm were adjusted and the results were observed. After defining the hidden layer properties, epoch and batch sizes were adjusted. The influence of the changes in these two latter parameters is not of vital significance. So that, a simple and fast responding value was finally chosen for them.
Table 5
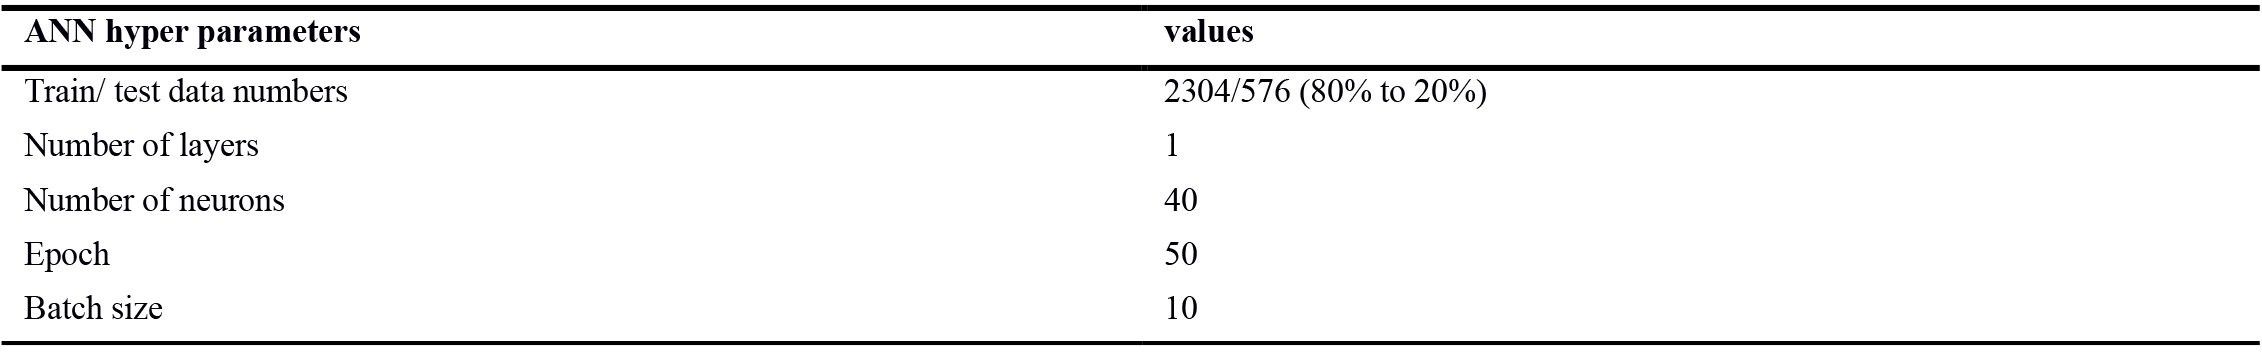
Table 5. Hyper parameters of the best performing ANN algorithm.
Figure 4
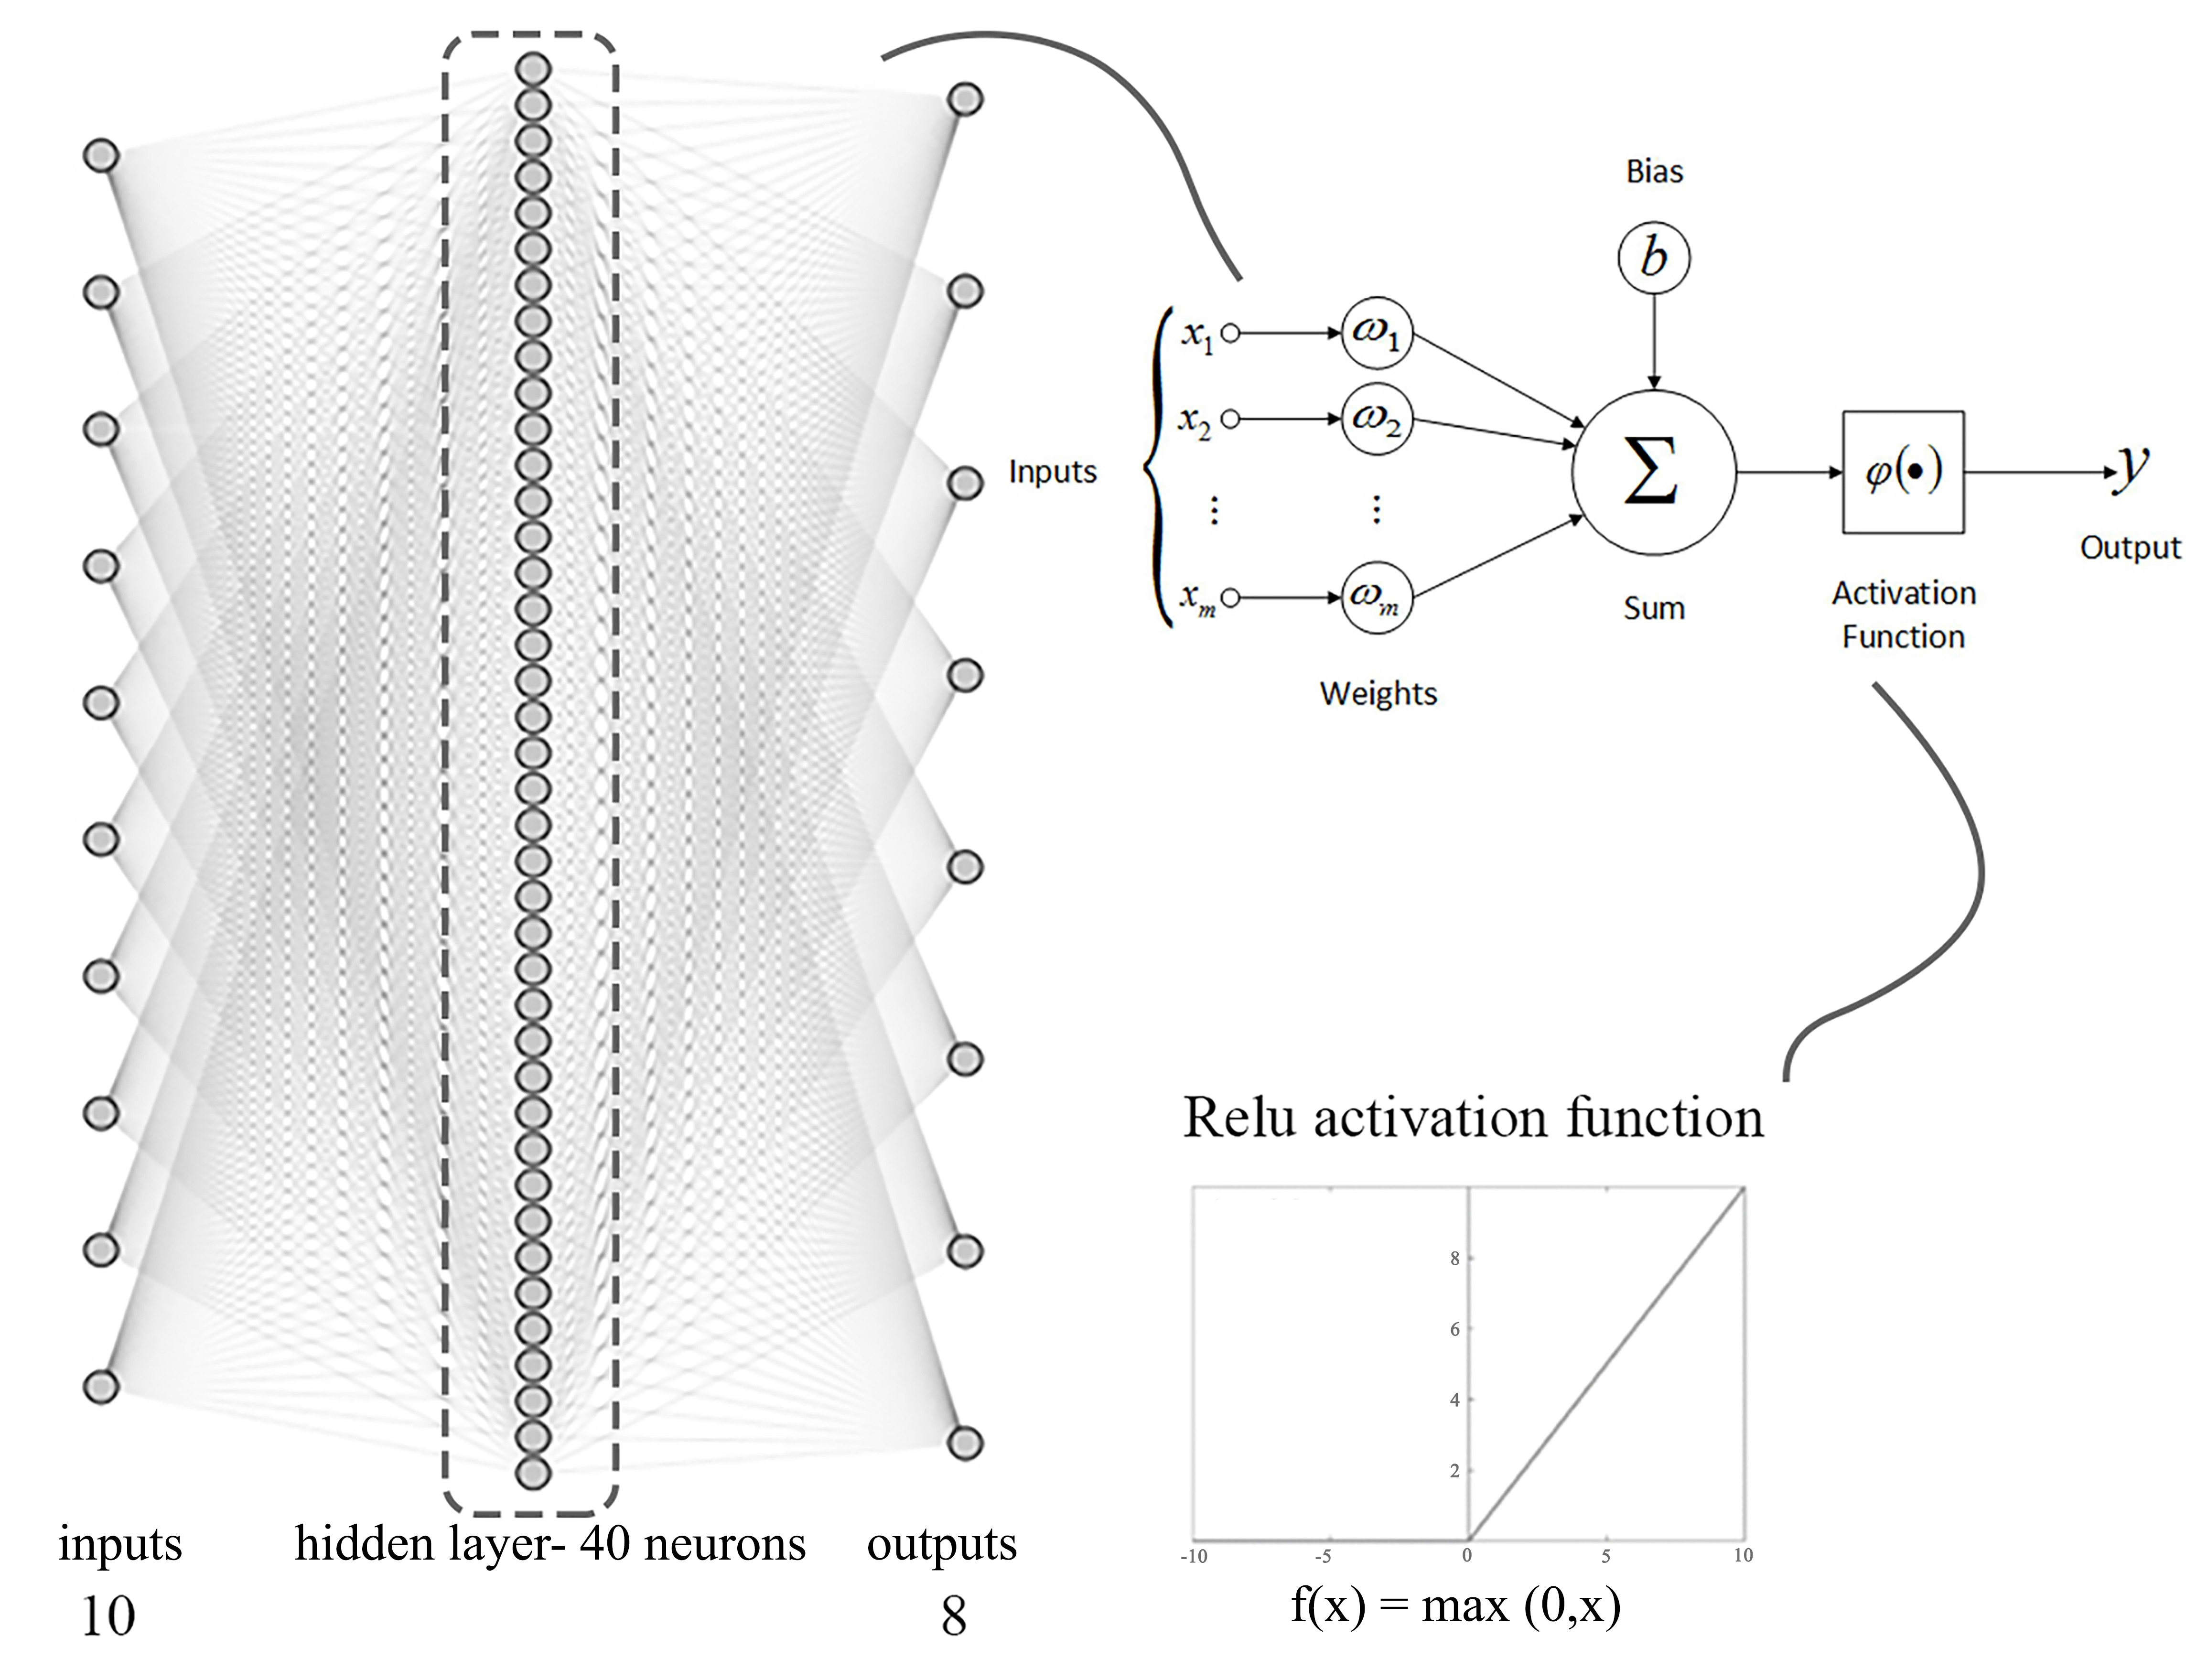
Fig. 4. Applied artificial neural network architecture.
To avoid weighing one orientation against another, the window orientation variable is represented by four Boolean values displayed as numbers of 0 or 1, each corresponding to one cardinal direction. For instance, [1,0,0,0] refers to north orientation, in which the four digits stand for north, east, south, and west, respectively.
To measure the accuracy of different algorithm architectures, two error metrics were adapted: MSE and MAE. These two metrics were applied both in the MLA’s optimization process and in the validation process of the predicted results.
MAE defines the average absolute difference between predicted and simulated values in the dataset, while MSE is the average squared difference between the estimated values and the actual value. MAE fails to punish large errors in prediction, while MSE indicates large errors more obviously [34].
2.4. Sensitivity Analysis with Shapley additive explanations
Since the ANN-based model is categorized as a black-box model, the exact function and formula calculating the metrics in the predictive models is not apparent [10]. So that, there is no confidence about whether the relationship among the values in the current study is linear or not. Accordingly, a new method named Shapley Additive Explanations is applied for the sensitivity analysis, which does not necessarily adopt linear functions for the analyzes [22,35]. In Shapley Additive Explanations, the algorithm performance is evaluated in two different conditions, with and without the target variable’s presence. Then each feature’s effect on the prediction process would be observed by a value named SHAP Value [22].
3. Results
The boxplots showing the distributions of simulated metrics are presented in Fig. 5. According to the results, in most of the reviewed spaces, view depth and view factor metrics are above the minimum acceptable range in LEED v.4 (>75%), which is adequate to get the quality views credit [23].
Figure 5
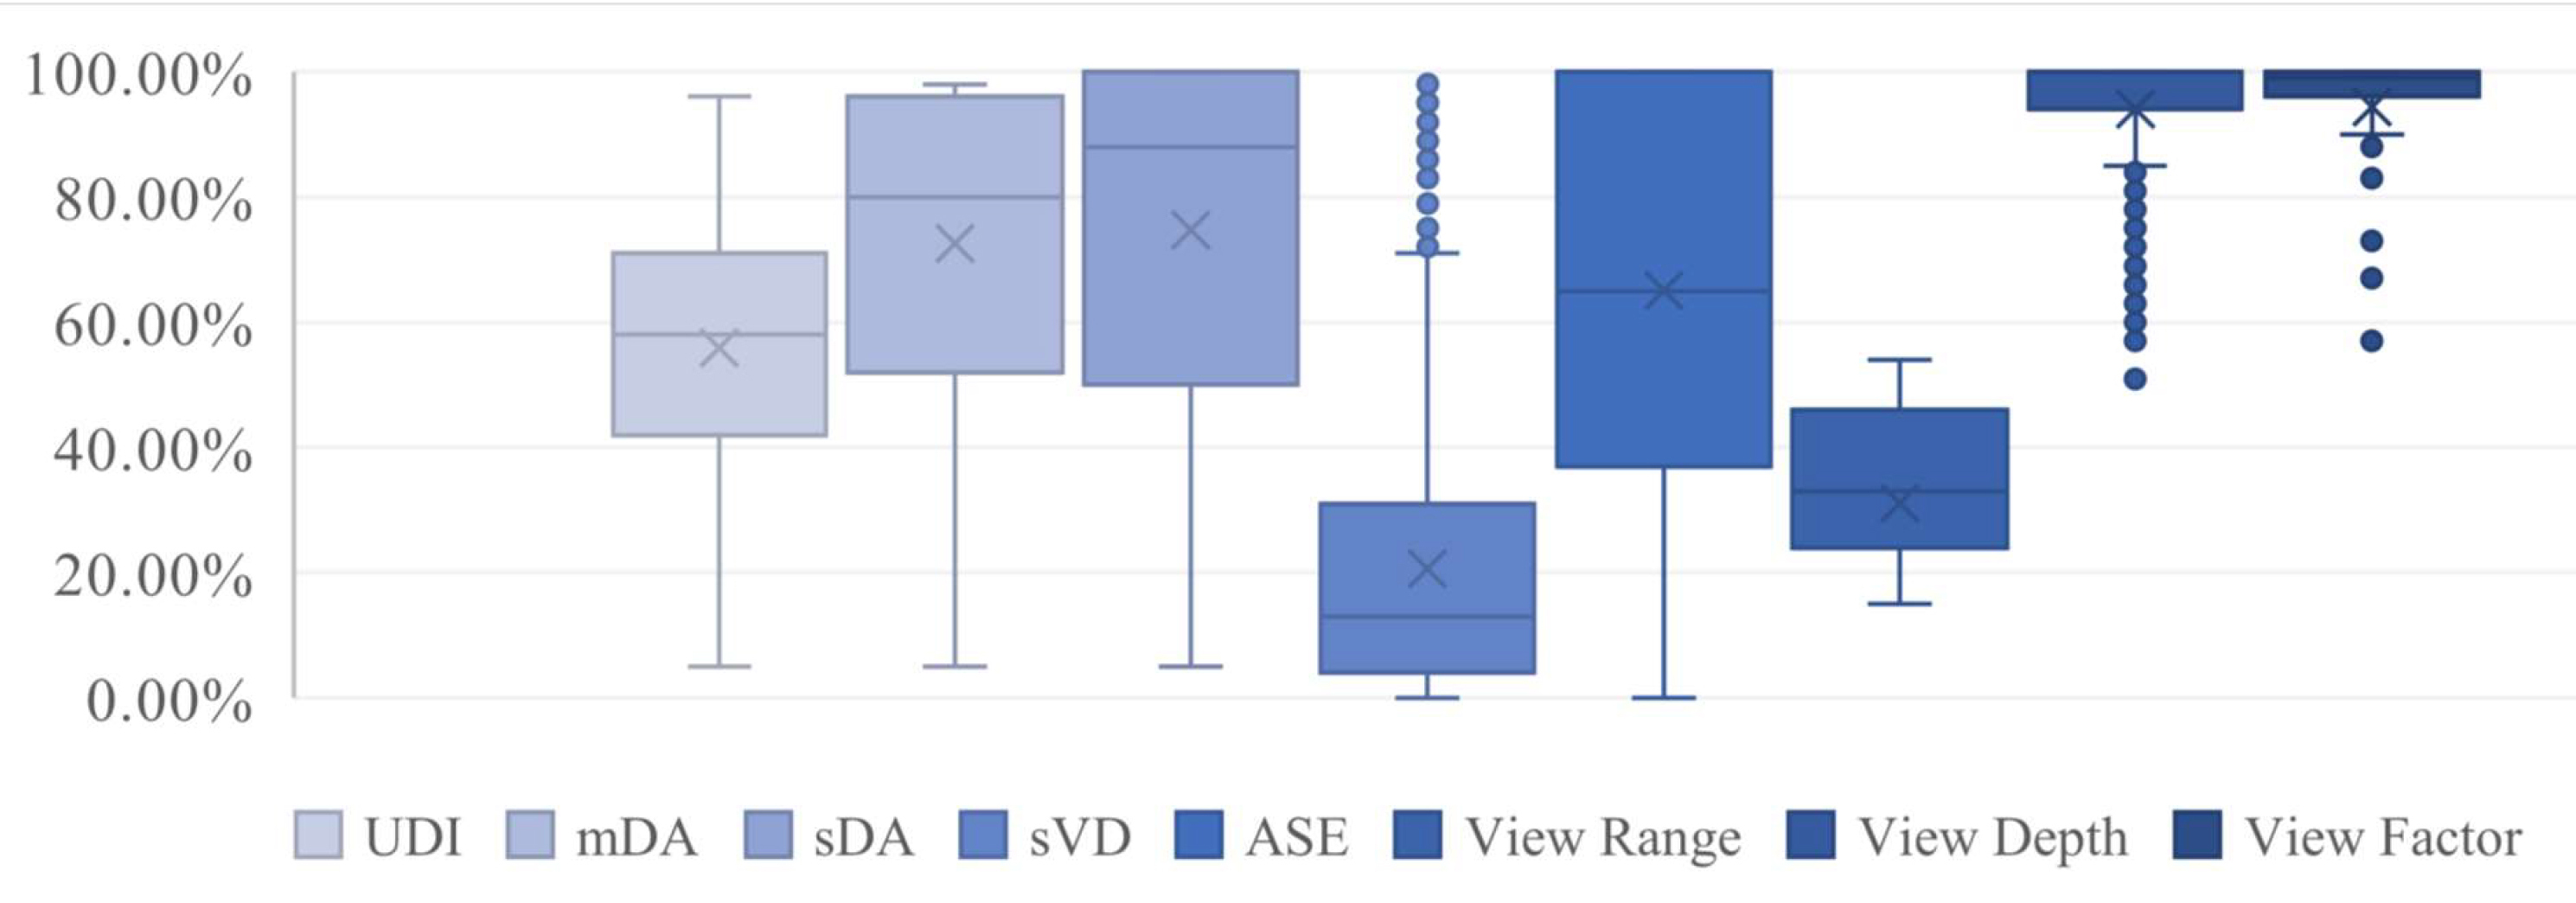
Fig. 5. The simulated metrics values distribution in the dataset.
The simulated daylight sufficiency metrics are distributed in a wide range of less than 10% to 100%. For most cases, the mDA and sDA values are above 50%. In accordance with the LEED v4. [23], the office spaces with the sDA of more than 55% and 75% would receive 2 or 3 credits, respectively. So that, most of the simulated spaces perform well in terms of daylight access/ availability. On the other hand, the UDI-autonomous values show that a high percentage of the received daylight, fall above the range of 300-3000 lux. The significantly high values of the sVD and ASE in most cases, support the claim of spaces facing a high risk of glare. As can be seen in Fig. 5, the median of ASE values is 65.03% which is much higher than the ASE 10% threshold criteria in LEED v.4.
3.1. The artificial neural networks training and optimization process
While a full daylight and glare simulation might take over 30 minutes per variant, depending on the size and complexity of the design, the duration of the introduced ANN-based predictive model for all 64 variants is in the order of seconds. All training and prediction time measurements were performed on an Intel Core i7 machine, with 16 GB of RAM. Tables 6 and 7 present a summary of model training properties. The optimization process of the algorithm included selecting varied hyper-parameters and analyzing the results, using both MAE and MSE accuracy measures. In the first step, the number of layers and hidden neurons were fixed (Table 6). In the second step, the impact of epochs and batch size values on the model outputs were analyzed. As can be seen in Table 7, the error values were not affected much but the training times were significantly influenced. Refinement of hyper-parameters may reduce the training time; however, it is not of vital importance in the evaluation of the predictive model. That is mainly because the training process happens only once and after that the model is able to predict the metrics in the order of seconds.
Table 6
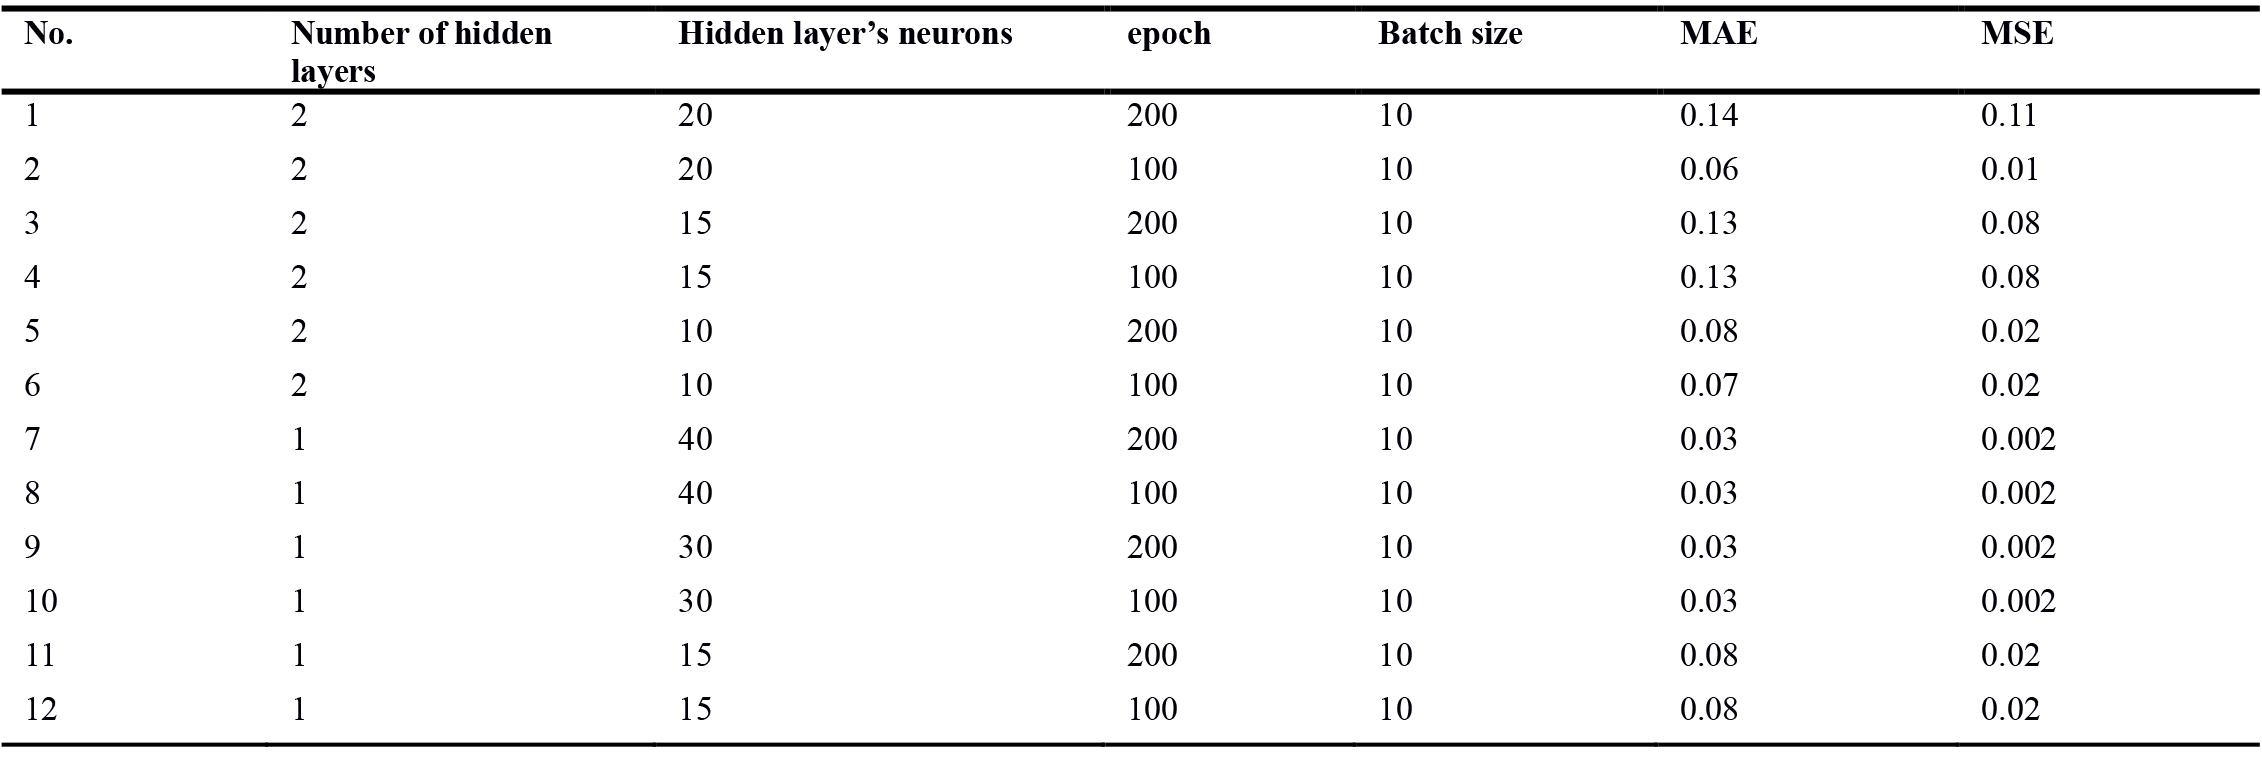
Table 6. Hyper parameters of the best performing ANN algorithm.
Table 7
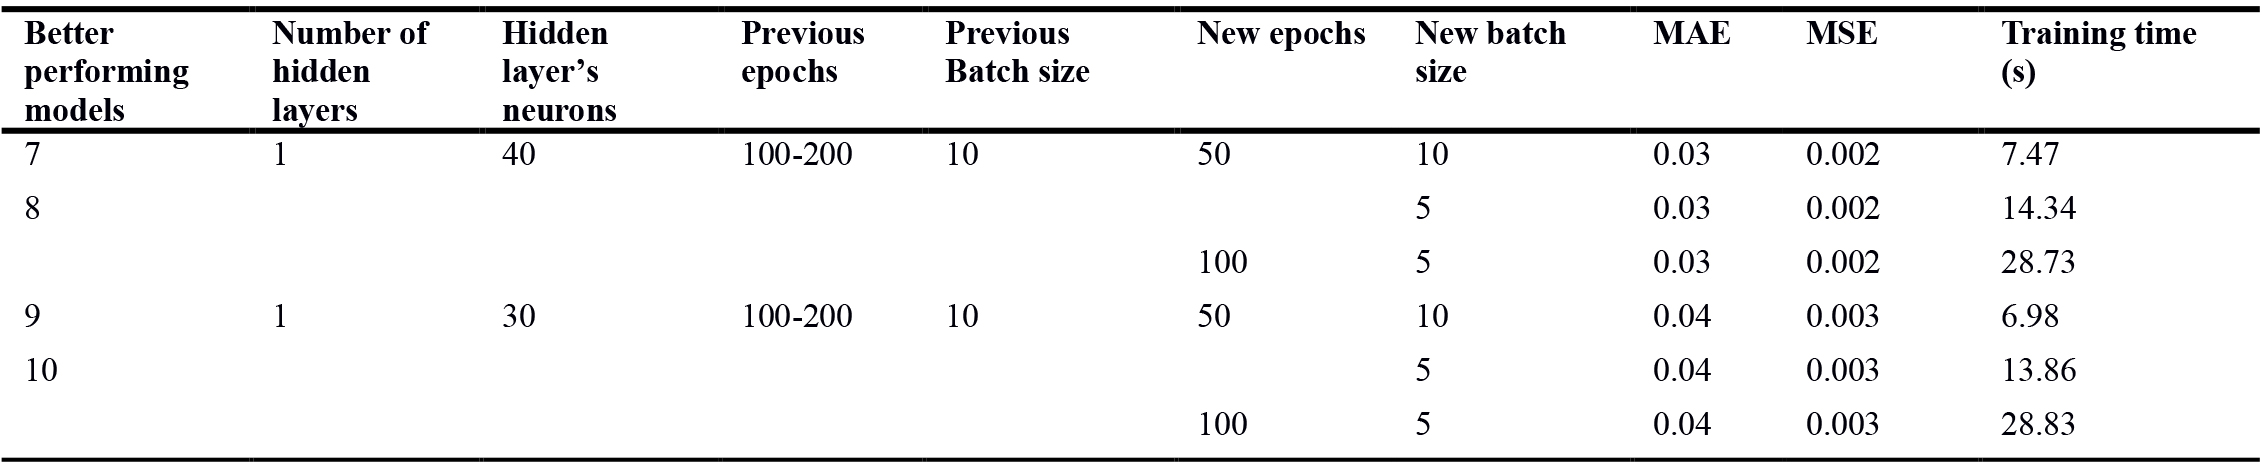
Table 7. The second step of trial and error process of the ANN algorithm optimization.
3.2. The neural networks validation results
To assess the efficiency of the MLA-based method, a comparison was made between the results of the ANN predictive model and CBDM simulations, using 64 alternatives as a validation dataset. As illustrated in Fig. 6, the predicted values obtained from the two methods are close, for nearly all eight metrics. Table 8, shows the results for MAE and MSE of the ANN model. The findings indicated that on average, the model performs better in the prediction of daylight sufficiency metrics than the others with an overall accuracy of 91.7%. The prediction error is highest with sDA among daylight sufficiency metrics, while mDA resulted in the least MAE and MSE values. The average MAE in the prediction of daylight metrics is 0.027. This value is 0.039 for glare metrics and 0.036 for quality views. Still, all errors are within the acceptable range where MAE falls between 1.8% and 6% and MSE is 0.007. On the whole, the model’s accuracy is satisfying considering the fact that there would be no need for time-consuming simulations, and the overall performance of the space in daylight, glare, and quality views would be available in a short time.
Figure 6

Fig. 6. Simulated vs. predicted values of the metrics.
Table 8

Table 8. Metrics prediction overall error values.
The actual error values in the prediction of the new 64 shoebox spaces are presented in Fig. 7. The absolute values of errors in daylight metrics vary from 0.02 to 0.13. The errors in sVD and ASE are more varied ranging from 0.01 to 0.18; and finally, the errors in quality views vary from 0 to 0.12. View range got the lowest accuracy in prediction, with the highest MAE value in comparison to the other factors, varying from 0.01 to 0.13 in the actual values of the metric. According to the results, daylight sufficiency and glare metrics have similar performance with the same MAE and MSE values; but actual errors on each alternative hardly exceeded 10%.
Figure 7
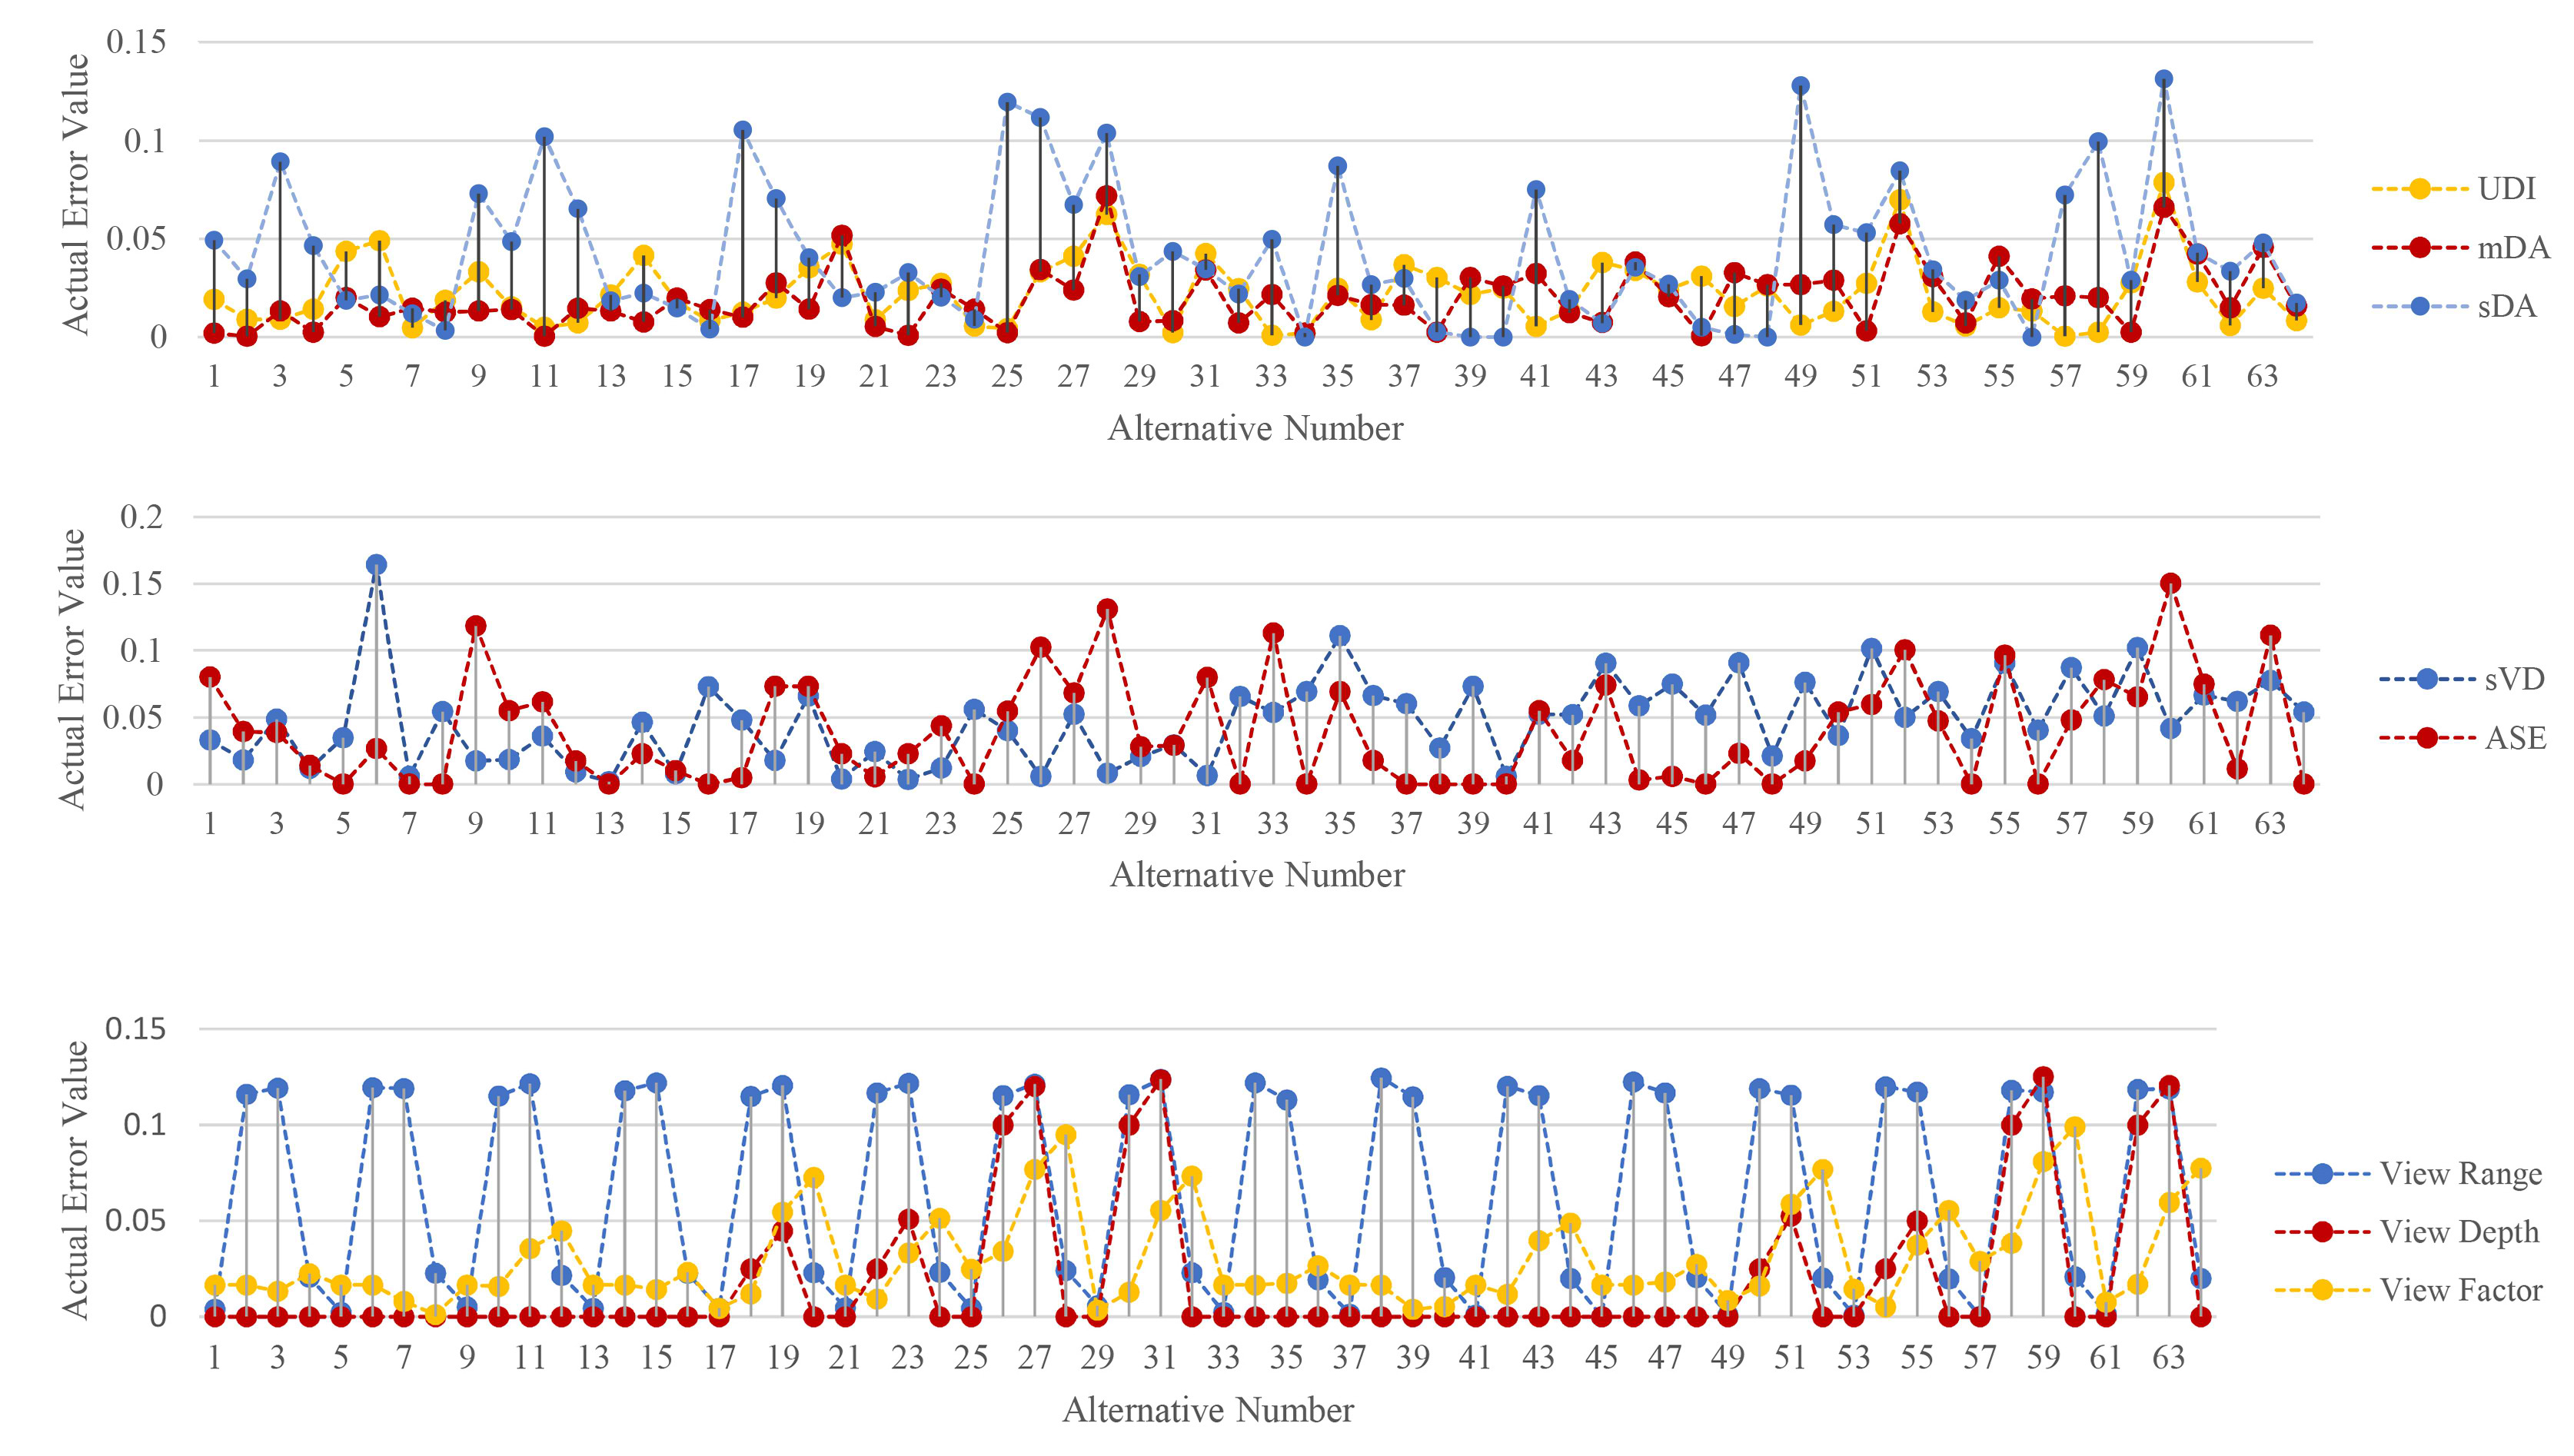
Fig. 7. Actual errors in the metrics predictions by the ANN in validation dataset.
Considering the average error values, the model performs well with a high degree of precision. However, the actual error for each variable might be problematic, since the bias might cause the predicted metric value to fall below/above certain thresholds defined by standards and building certifications. For instance, an actual error value of 0.10 in each of the quality views metrics will directly change a space’s verification in accordance with LEED v.4. A wider range of variables in datasets of future work can improve not only the overall accuracy of the predictive models but also the actual accuracy of each alternative.
3.3. Sensitivity analysis
The SHAP value was utilized to identify the contribution of each variable to the calculated metrics. This analysis can reveal the main effective variables/ inputs, which can be explored in more detail in future studies. The graph in Fig. 8 indicates the SHAP value analysis for input variables. The color of each point represents the impact of that variable on the resulted metrics. According to the graph, the parameters related to the size of the windows, e.g. window height, room dimensions, and the number of windows are the most effective inputs to explain the variability of calculated daylight and glare metrics.
Figure 8

Fig. 8. Sensitivity analysis of the metrics to different variables using SHAP value.
Besides, each input feature may have a positive or negative effect on the output targets. Figure 8 visualizes this influence with a gradient of red and blue. The SHAP values for daylight and glare metrics are mostly above 0.1 with an almost balanced distribution of impacts for each input feature. On the other hand, some input features of view analyses have nearly no effect on the targets, with SHAP value of less than 0.01 on average.
According to the overall results of the sensitivity analysis, as shown in Fig. 9, the parameters affecting the window to wall ratio and room dimensions are the top three most influential parameters. The effect of these parameters is three times higher than those related to shading state or window sill height. It shall be noted that these results are only applicable to the present dataset and analyzed space and cannot be generalized to other space types and alternatives without further investigation.
Figure 9
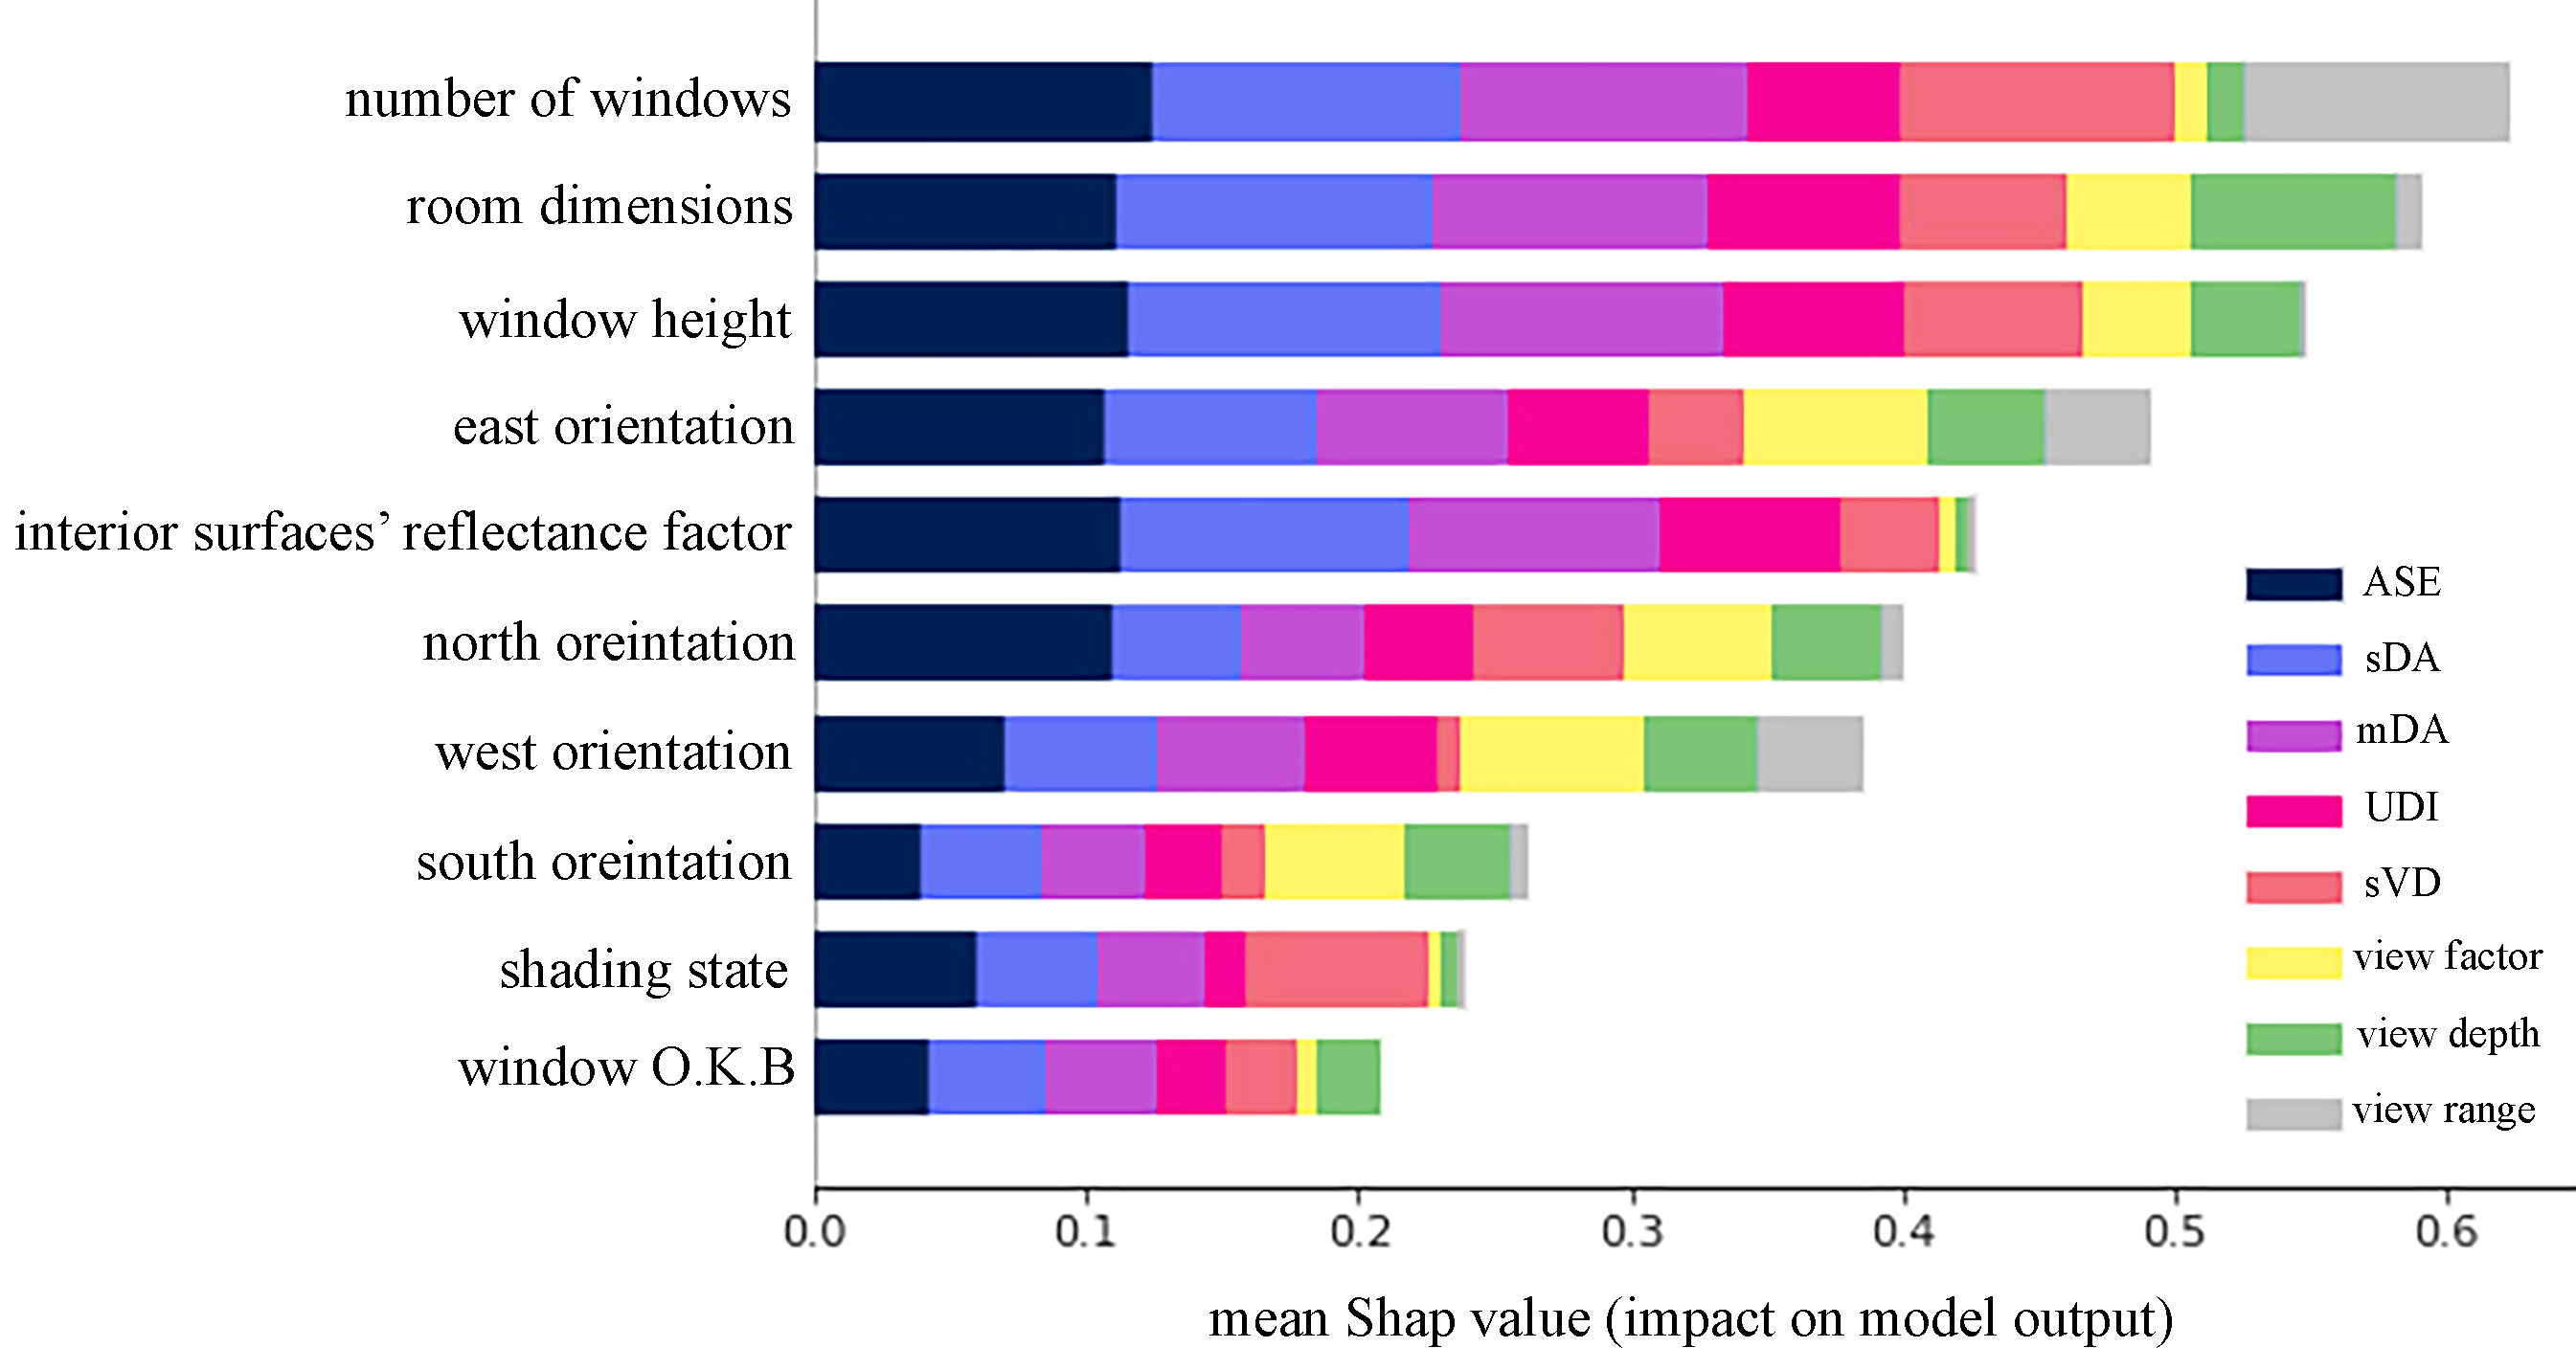
Fig. 9. Overall Sensitivity analysis of the metrics to different variables using SHAP value.
4. Discussion
This paper examines the suitability of ML algorithms for application in daylight and visual comfort assessments. In line with the findings reported in the literature [10], the high accuracy of the predictive model created in the current research shows the feasibility of using ML-based methods for the prediction of daylight and glare. The first research objective was to provide a comprehensive analysis by covering essential metrics. Findings showed that the obtained model could be applied for the evaluation of all mentioned aspects with an accuracy of 94% to 98.2% on average. The created model in this research, provides more varied metrics compared to previous studies, while the error measures and loss functions show almost the same quality and accuracy (Table 9).
Table 9

Table 9. Comparison of the results and methodology in recent studies.
Considering the second research objective, view quality of the spaces has been included in the framework along with daylight and glare assessment, to generate a more holistic framework. It should be noted that most recent studies focused on the prediction of daylight or glare metrics (Table 9) and window view has been rarely discussed in the literature. The results of this research contribute to 94% to 97% of accuracy in view analyses on average.
In previous studies, internal design parameters (e.g. interior surfaces properties, WWR, room length and width) were used more frequently compared to external ones(e.g. exterior obstruction height and angles, distance from obstructions, solar hour) [10], meaning that in the designers’ opinion interior features are considered to have more effect on the space’s performance. Based on this clue, the selection of the input features was mainly based on the interior design options of the studied room. Although the feature selections may have limited the comprehensiveness of the inputs the user can manage, the options still have sufficient variation for an early decision-making process.
The method of this research was to solve a regression type problem to predict the output targets of the ANN-based model. According to the literature review, 87% of the ML-based daylight studies were regression problems [10]. Some of the metrics like UDI and DGP (which is regarded in form of sVD in this paper) can be also analyzed via a classification method, as they are defined with a qualitative scoring system as well [26,36]. This can be a target for future researches in this field.
Temporal granularities are another effective factor in the analyses. Both hourly analyses and specific time-steps have been calculated with MLAs in pervious studies [10]. It is of vital importance to develop the ML models for practical implementation that could assist architects. That would prioritize the annual hourly basis for the calculations rather than selected instances of time. This issue also applies to dynamic and static illuminance metrics as well. Dynamic metrics have been selected to make the analyses applicable to annual performances. sVD metric in glare predictions has also been applied instead of the static DGP for this reason. This is one of the aspects of the present research which makes it practically applicable for early design stage analyses.
The hyper-parameters that were tuned for the MLA are number of Hidden Neurons and Hidden Layers, Epochs, Activation Function, and Learning Rate. These parameters are mainly balanced based on a trial and error procedure. Two purposes are required to be fulfilled when tuning these parameters: Model Calculation Speed and Prediction Accuracy. Since the speed of predictions is far better than the former CBDM techniques, the accuracy becomes the main purpose which is further evaluated by loss functions, MAE and MSE, at each step of optimizing the model. This step is also based on a common method which is applied by other researches of this field repeatedly [37].
The hyper-parameters tuning process went through two main steps. First, the number of hidden layers and neurons were adjusted to examine their influence on the model’s prediction accuracy. Although increasing the number of hidden layers and neurons seems to improve the model’s performance, it was found that one or two hidden layers performed better in comparison with deeper networks. Increasing the number of neurons up to 40, improved the model’s performance. Thereafter the model started to plateau, as more complex networks require more data to process; otherwise, the predictive model overfits the data, and the loss function increases in value.
Epochs and batch sizes were adjusted in the next step of algorithm optimization. Although the loss functions were approximately not affected by decreasing the epochs down to 50 and the batch sizes down to 5, the training time was highly influenced. By comparing the overall results of the MAE and MSE in the model’s prediction accuracy, the best-performing model was selected for further application in the target framework.
To make accurate predictions using MLA, training relevant data is required to construct mathematically-fit models; but they are only applicable in the data range from which they were emerged [10]. For this reason, sensitivity analysis can be useful to develop the input and output features in a practical form. In contrast with similar researches, thanks to the newly introduced method of Shapley Additive Explanations, sensitivity analysis has been conducted for every single data of the dataset individually. This would clarify the effects of the inputs on the targets and forms the future developments of the framework by adapting more influential parameters on each of the metrics involved in the analyses.
As indicated in Figs. 8 and 9, the impact of each variable on the output metric is different. The results of sensitivity analysis shall be studied along with the metrics’ description. For instance, view metrics are highly influenced by the number of windows and window orientation in the analyzed dataset. View factor, view range, and view depth are calculated based on the physical dimensions of the spaces and their windows. By changing the window orientation, the glazed wall would also be changed and consequently, the width of the opening was impacted. Thus, the effect of window size is also shown in the results of sensitivity analysis and it is observed that view metrics were more influenced by west and east orientations compared to south and north ones. Accordingly, while applying the results of sensitivity analyses to the spatial parameters, their embedded calculation procedures shall be considered beforehand.
One of the main challenges of using MLAs in constructing a holistic predictive model is the tediousness of creating a separate optimal algorithm for every building performance metric. That is why usually a small number of outputs are investigated in a single research item. But in this paper, a single predictive algorithm was generated for all the output targets including eight different metrics. Any number of input parameters can be used in Machine learning models; more inputs can offer more accuracy, but at the expense of more complexity. In fact, more complexity of the model may lead to overfitting of predictive algorithm. In contrast, fewer inputs, might yield less accuracy. So, it is a challenge to achieve an acceptable range of accuracy while keeping the amount of data at a logical value. Concerning previous studies, a set of around 3000 data was assumed to be sufficient in number and variance. The input features were then distributed to cover the regarded number and at the same time prevent any interpretability.
Overall, three main issues affect the concept of MLAs application in the prediction of building performance and are addressed in researches like the present one. They include the model architecture, Input and Output Features, and Sensitivity Analysis. Each of these issues has been the primary purpose of recent studies individually, but in this paper, they have all been covered together to propose a comprehensive study in this field.
In order to define practical applications of the research results in a form of a comprehensive toolkit, a graphical user interface is required to be added to the calculation python code. Figure 10 shows a recommended format for this interface. The obtained ANN predictions can be also fed back to Grasshopper or Dynamo models as a plugin component to perform the analyses along with the design process.
Figure 10
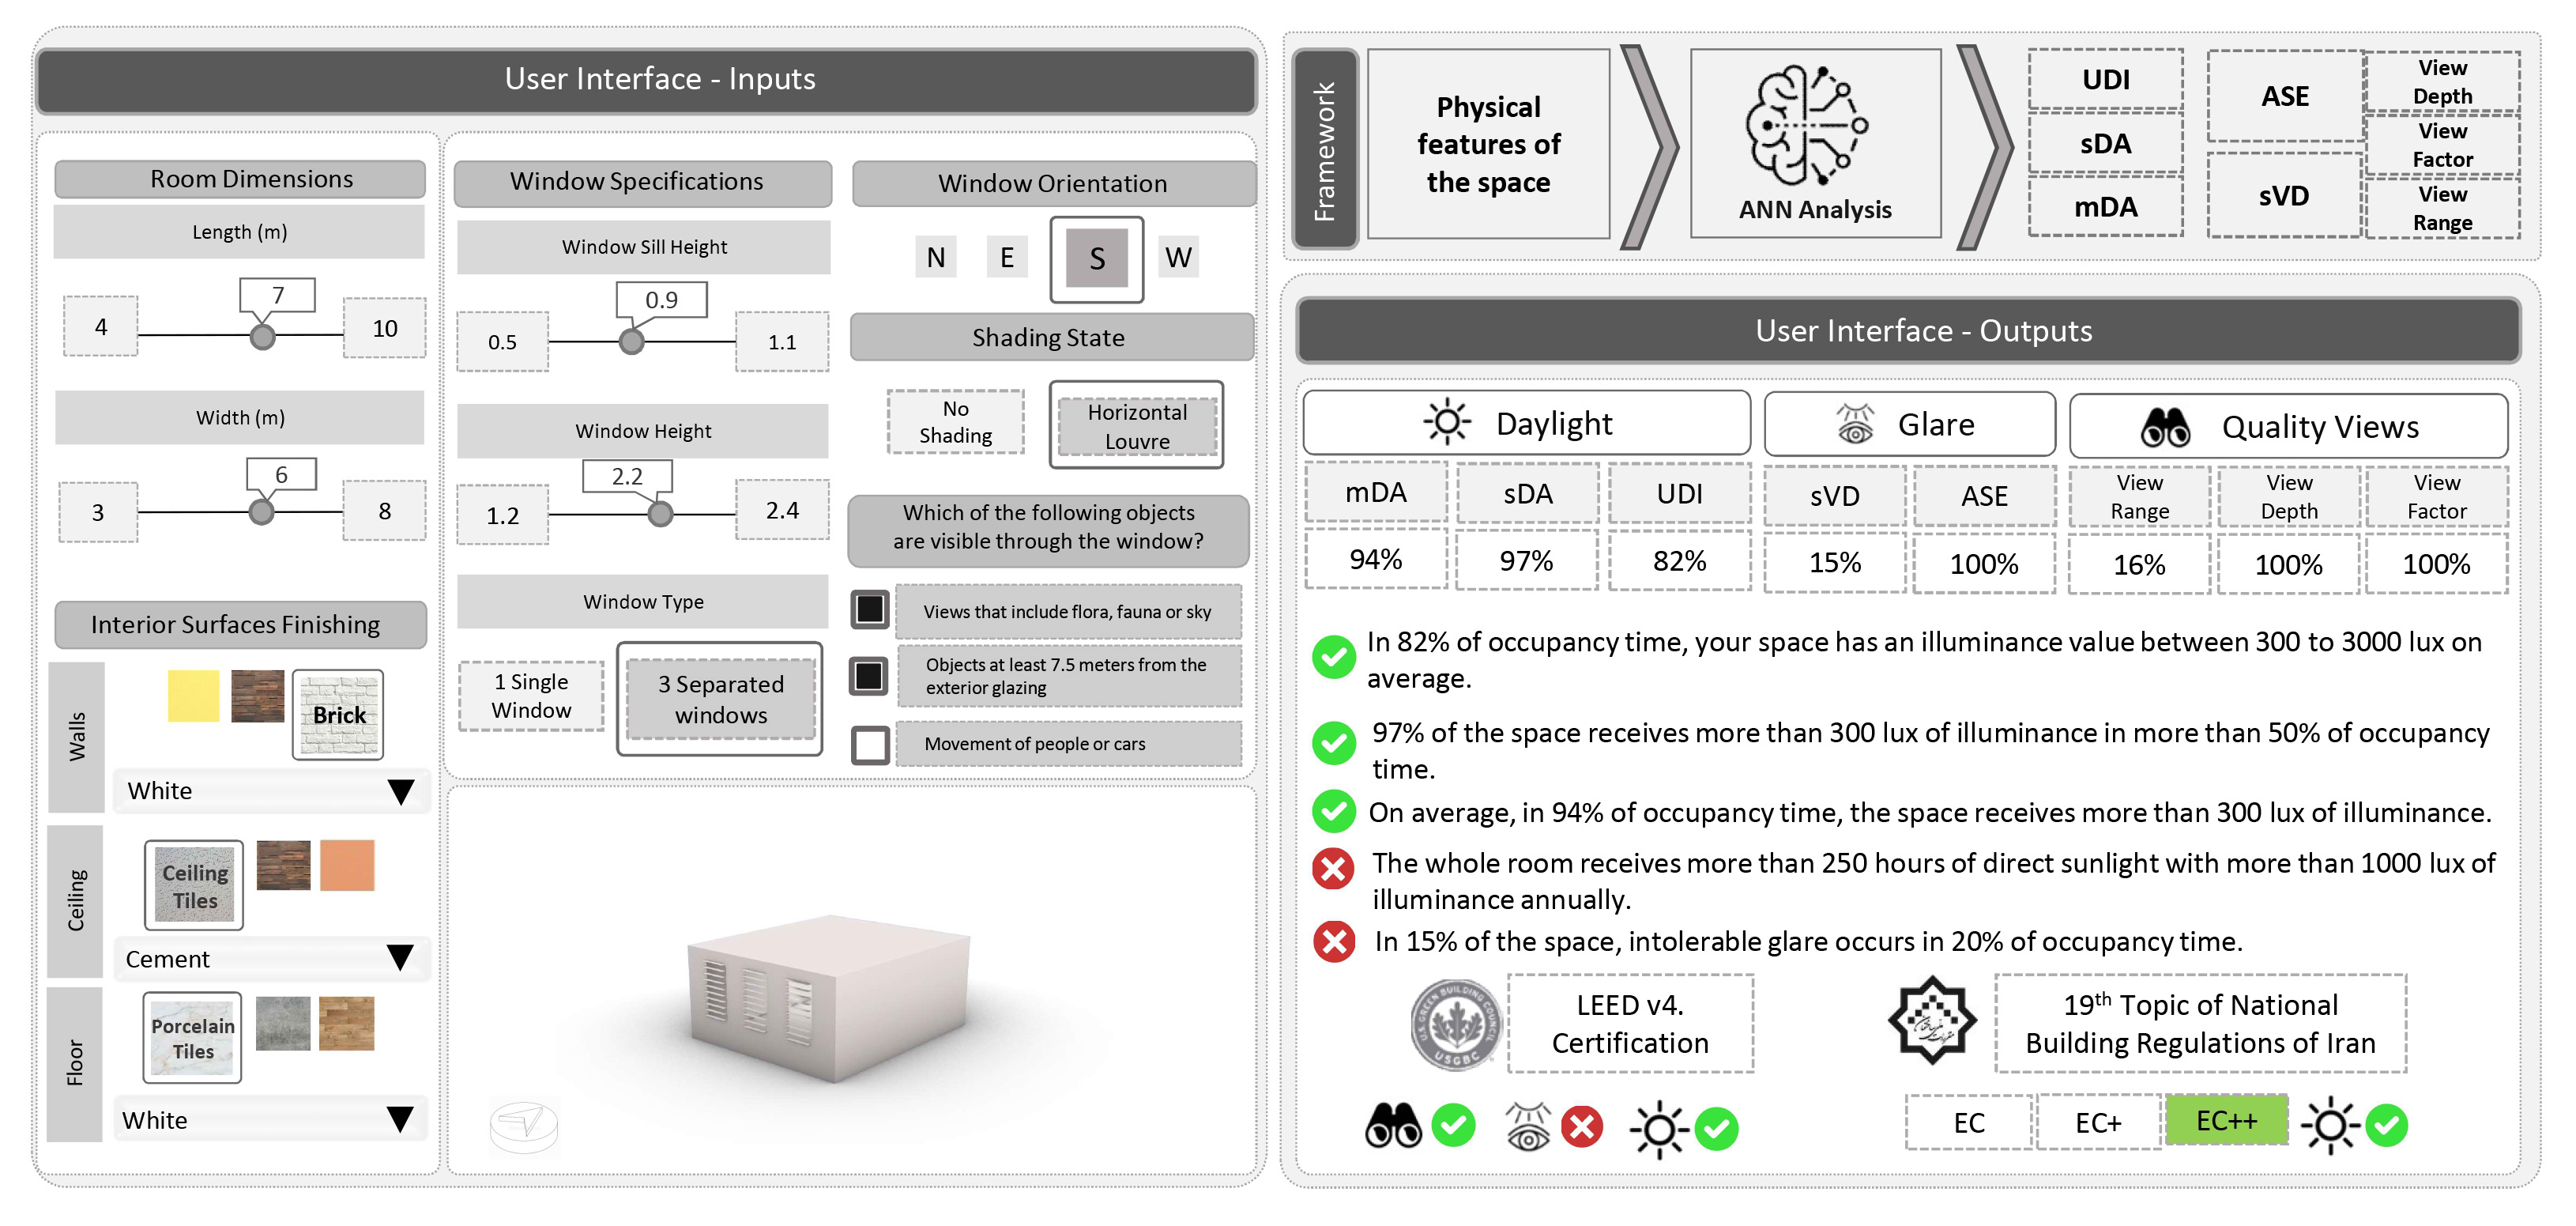
Fig. 10. Featured framework for the analysis of the spaces in early design stages, including user interfaces.
As it is indicated in the proposed interface, some physical features of the space are directly entered by the user; while others are available as options that would be translated into the ANN model input features e.g., Interior surfaces finishing. Besides, the view content factor is entered manually, to be considered along with other three calculated metrics including view range, view depth, and view factor.
Since all users may not have sufficient expertise for interpreting the outputs, the intended results of the framework include some explanations about each calculated metric. Moreover, a comparison between the metrics’ values and their acceptable range would be available based on LEED v4 [23] and the 19th topic of National Building Regulations of Iran. Three levels of efficiency have been declared for daylight quality of spaces in the latter source and the obtained model can classify the designed space based on the defined principles [24].
The predictive model and the derived frameworks are essentially required for building industries’ stakeholders in developing countries like Iran to improve the coordination among architects and members from different disciplines. The proposed tool in this research, will be formed on the basis of national and international regulations in daylight and visual comfort metrics to address these shortcomings in the building industry.
However, to provide more precise and trustworthy information, it seems considerable to indicate the limitations present in the study, together with recommendations for future researches.
- The nature of the train and test dataset: The main limitation relates the nature of the dataset creation process. Designing for daylighting performance is a complicated task that is mainly based on simulation-derived analyses. Although the application of simulation-based procedures allows the manipulation of different elements (e.g., WWR) and enables the developed models to be trained on a wide range of influential factors, obtaining daylighting data from real buildings would provide more accurate findings. Therefore, it is suggested that future studies develop indoor illuminance predictive models based on real field data from multiple buildings with different design configurations.
- A finite set of design variants: The investigated dataset in this study was derived from 2880 simulations which took about twenty days to be completed. However, the dataset still does not comprise a sufficient amount of interior and exterior parameters. This limited number of features prevents the framework from supporting varied design scenarios. It is recommended that in future researches, the ML-based model be trained with a more holistic dataset that contributes to different environmental features like neighborhood buildings, more shading devices details, and other climate regions data. All results, including the correlation levels and the model structure, are therefore dictated by the reference dataset and underlying assumptions.
- The geometry and size of spaces: the current study considered daylight performance in a square space of a special size, which is not necessarily a general representation of many built working spaces despite being utilized in previous daylight studies. Future studies should attempt to establish a prototype model that can be used for daylight studies in the scale of the whole building rather than single spaces.
Automation of the transfer of ANN results to existing interfaces for visualization and feedback can facilitate design exploration and user interaction with the results. Future works can focus on the development of a plug-in to the architectural softwares (like Grasshopper or Dynamo) in order to automate model parameterization, ANN training feature extraction, ANN training and validation, and ANN optimization.
5. Conclusion
An ANN-based predictive model has been developed in this research which can be utilized in holistic daylight and visual comfort design evaluations. Daylight and visual comfort metrics have been analyzed in a single shoebox space. The results indicated that all three fields’ metrics could be predicted by this method with acceptable accuracy. This procedure could form a framework capable to replace the present simulation-based methods. Thus, the calculation of the metrics would be available without the requirement of time-consuming computer-based simulations. The suitability of this approach, however, is dependent on a cost‐benefit analysis regarding the ratio between the needed input training data and the required number of predictions. Since generating the training data continues to depend on conducting full computer simulations or real-world measurements, such a method is, therefore, more practical when a full parametric analysis of all combinations of design variables is available. Considering changeable weighting factors for each aspect, the design ideas can be evaluated based on the designer’s intended priorities and in accordance with the space type. The results of this paper have the potential of forming a tool that could be used in early design stage analyses without the requirement of time-consuming simulations in previously developed platforms and programs.
Acknowledgment
This paper presents some results of the project, supported by the Iran National Science Foundation (INSF, grant number 99008894) and Shahid Beheshti University.
Contributions
All authors contributed equally in the preparation of this article.
Declaration of competing interest
The authors declares that there is no conflict of interest.
References
- G. Mariana, B. Steverson, J. Heerwagen, K. Kampschroer, C. Hunter, K. Gonzales, B. Plitnick and M. Rea, The impact of daytime light exposures on sleep and mood in office workers, Sleep Health 3 (2017). https://doi.org/10.1016/j.sleh.2017.03.005
- IEA, “Light’s Labour’s Lost” – Policies for Energy-efficient Lighting,International Energy Agency,” International Energy Agency, 26 Jun 2006. [Online]. Available: https://www.iea.org/news/lights-labours-lost-policies-for-energy-efficient-lighting. https://doi.org/10.1787/9789264109520-en
- D. Ürge-Vorsatz, N. Eyre, P. Graham, D. Harvey, E. Hertwich, Y. Jiang and C. Kornevall, Global Energy Assessment, Toward a sustainable future, Cambridge University Press, Cambridge, 2012. https://doi.org/10.1017/cbo9780511793677.016
- IEA, Energy Efficiency,International energy agency, International energy agency, 2019. [Online]. Available: https://www.iea.org/reports/energy-efficiency-2019. https://doi.org/10.1787/1594fe3e-en
- Reinhart, Daylighting handbook I: Funamentals, designing with the sun, Muscle & Nerve., Building Technology Press, Cambridge, 2014.
- M. Ayoub, A multivariate regression to predict daylighting and energy consumption of residential buildings within hybrid settlements in hot-desert climates, Indoor and built environment 28 (2019) 848-866. https://doi.org/10.1177/1420326x18798164
- M. Aries, M. Aarts and J. v. Hoof, Daylight and health: A review of the evidence and consequences for the built environment, Lighting research and technology 47 (2015) 6-27. https://doi.org/10.1177/1477153513509258
- P. Foldbjerg, “Daylight, Energy and Indoor Climate Basic Book: Daylighting Quality,” [Online]. Available: https://www.velux.com/what-we-do/research-and-knowledge/deic-basic-book/daylight/daylighting-quality.
- K. Konis and S. Selkowitz, Effective daylighting with high performance facade, Springer, Cham, 2017.
- M. Ayoub, A review on machine learning algorithms to predict daylighting inside buildings, Solar energy 202 (2020) 249-275. https://doi.org/10.1016/j.solener.2020.03.104
- G. Ward, The RADIANCE lighting simulation and rendering system., in: Proceedings of the 21st annual conference on Computer Graphics and Interactive Techniques, 1994, pp. 459-472, United States. https://doi.org/10.1145/192161.192286
- E. Nault, P. Moonen, E. Rey and M. Andersen, Predictive models for assessing the passive solar and daylight potential of neighborhood designs: A comparative proof-of-concept study, Building and Environment 116 (2017) 1-16. https://doi.org/10.1016/j.buildenv.2017.01.018
- C. L. Lorenza, A. B. Spaetha, C. B. d. Souzaa and M. S. Packianatherb, Artificial Neural Networks for parametric daylight design, Architectural Science and Review 63 (2019) 210-221.
- J. Mardaljevic, Climate-based daylight modelling and its discontents, in Simple Buildings Better Buildings? Delivering Performance through Engineered Solutions, CIBSE Technical Symposium, 2015, pp. 180-192, London.
- M. Ayoub, A multivariate regression to predict daylighting and energy consumption of residential buildingswithin hybrid settlements in hot-desert climates, Indoor Building Environment 28 (2019) 848-866. https://doi.org/10.1177/1420326x18798164
- K. Radziszeweski and M. Waczynska, Machine learning algorithm-based tool and digital framework for substituting daylight simulation in early-stage architectural design evaluation, in The symposium on simulation for architecture and urban design, 2018, Delft, Netherlands. https://doi.org/10.22360/simaud.2018.simaud.001
- Z. Liu, D. Wu, Y. Liu, Z. Han, L. Lun, J. Gao, G. Jin and G. Gao, Accuracy analyses and model comparison of machine learning adopted in building energy consumption prediction, Energy Explor. Exploit. 37 (2019) 1426-1451. https://doi.org/10.1177/0144598718822400
- M. Becalli, M. Bonomolo, G. Ciulla and V. Brano, Assessment of indoor illuminance and study on best photosensors' position for design and commissioning of daylight linked control systems. A new method based on artificial neural networks, Energy 154 (2018) 466-476. https://doi.org/10.1016/j.energy.2018.04.106
- Y. Hon, L. Shen and C. Sun, Developing a parametric morphable annual daylight prediction model with improved generalization capability for the early stages of office building design, Building and Environment, 200 (2021) 107932. https://doi.org/10.1016/j.buildenv.2021.107932
- C. Lorenz, M. Packianather, A. Spaeth and C. De Souza, Artificial neural network based modeling for daylight evaluation, in The symposium on simulation for architecture and urban design, 2018, Delft, Netherlands.
- S. Yacine, Z. Noureddine, B. Piga and E. Morello, Developing neural networks to investigate relationships between lighting quality and lighting glare indices., Energy Procedia 122 (2017) 799-804. https://doi.org/10.1016/j.egypro.2017.07.406
- P. Rathi, A Novel Approach to Feature Importance-Shapley Additive Explanations, 2020. [Online]. Available: https://towardsdatascience.com/a-novel-approach-to-feature-importance-shapley-additive-explanations-d18af30fc21b.
- USGBC, LEED® green building program v.4, Washington D.C: The U.S Green Building Council, United States, 2016.
- 19th topic of National Building Regulations of Iran, Road, Housing & Urban Development Research Center of Iran, Tehran, 2020.
- IES LM 83-12 Approved Method: IES Spatial Daylight Autonomy (sDA) and Annual Sunlight Exposure (ASE), Illuminating Engineering Society, 2012.
- A. Nabil and J. Mardaljevic, Useful daylight illuminance: a new paradigm for assessing daylight in buildings, Lighting Research and technology 37 (2005) 41-59. https://doi.org/10.1191/1365782805li128oa
- Z. S. Zomorodian and M. Tahsildoost, Assessment of window performance in classrooms by long term spatial comfort metrics 134 (2017) 80-93. https://doi.org/10.1016/j.enbuild.2016.10.018
- L. Heschong and M. Saxena, Windows and Offices: A Study of Office Worker Performance Environment, California Energy Commission, California, 2003.
- M. S. Roudsari, Honeybee[+], 2020. [Online]. [Accessed 25 March 2018].
- C. Studio, Colibri Release, Core Studio, 2017. [Online]. Available: http://core.thorntontomasetti.com/colibri-release/. [Accessed 2017].
- X. Yao, Evolving Artificial Neural Networks, in: Proceedings of the Institute of Electrical and Electronics Engineers, 1999, 1423-1447, Kohala Coast, United States.
- R. Hecht-Nielsen, Theory of the backpropagation neural network., Neural networks for perception, Academic press, (1992) 65-93.
- S. Bishop, Pattern Recognition and Machine Learning, Springer, Singapore, 2006.
- C. J. Willmott and K. Matsuura, Advantages of the mean absolute error (MAE) over the root mean square error (RMSE) in assessing average model performance, Inter-Research Science Publisher 30 (2005) 79-82. https://doi.org/10.3354/cr030079
- Lundberg, S. M. and S.-I. Lee, A unified approach to interpreting model predictions, in: Conference on Neural Information Processing Systems, 2017, 4768-4777, United states.
- J. Weinold and J. Christoffersen, Evaluation methods and development of a new glare prediction model for daylight environments with the use of CCD cameras, Energy and Buildings 38 (2006) 743-757. https://doi.org/10.1016/j.enbuild.2006.03.017
- M. Stewart, Simple Guide to Hyperparameter Tuning in Neural Networks, 2019. [Online]. Available: https://towardsdatascience.com/simple-guide-to-hyperparameter-tuning-in-neural-networks-3fe03dad8594, Accessed: 2019.
Copyright © 2021 The Author(s). Published by solarlits.com.

3345
Total views
Citations
SHARE ON


